| Param | Original file | Final file |
|---|---|---|
| Filename | modeM0/AS1A13_004T11_9000006018_44743cztM0_level2.fits | modeM0/AS1A13_004T11_9000006018_44743cztM0_level2_quad_clean.evt |
| Size (bytes) | 1,253,949,120 | 238,150,080 |
| Size | 1.2 GB | 227.1 MB |
| Events in quadrant A | 12,178,865 | 1,626,128 |
| Events in quadrant B | 9,151,165 | 1,650,829 |
| Events in quadrant C | 9,202,271 | 1,556,352 |
| Events in quadrant D | 14,646,259 | 1,271,795 |
| Mode SS | |||
|---|---|---|---|
| Quadrant | BADHDUFLAG | Total packets | Discarded packets |
| A | 0 | 324 | 0 |
| B | 0 | 324 | 0 |
| C | 0 | 324 | 0 |
| D | 0 | 324 | 0 |
| Mode M0 | |||
|---|---|---|---|
| Quadrant | BADHDUFLAG | Total packets | Discarded packets |
| A | 0 | 50267 | 1 |
| B | 0 | 38368 | 1 |
| C | 0 | 39397 | 1 |
| D | 0 | 54497 | 1 |
| Mode M9 | |||
|---|---|---|---|
| Quadrant | BADHDUFLAG | Total packets | Discarded packets |
| A | 0 | 4 | 0 |
| B | 0 | 4 | 0 |
| C | 0 | 4 | 0 |
| D | 0 | 4 | 0 |
| Quadrant | Total seconds | Saturated seconds | Saturation percentage |
|---|---|---|---|
| A | 16010 | 699 | 4.366021% |
| B | 16011 | 796 | 4.971582% |
| C | 16011 | 962 | 6.008369% |
| D | 16011 | 2308 | 14.415090% |
Noise dominated data is calculated using 1-second bins in cleaned event files. If a bin has >2000 counts, and if more than 50% of those come from <1% of pixels, then it is considered to be noise-dominated and hence unusable.
| Quadrant | # 1 sec bins | Bins with >0 counts | Bins with >2000 counts | High rate bins dominated by noise | Noise dominated (total time) | Noise dominated (detector-on time) | Marked lightcurve |
|---|---|---|---|---|---|---|---|
| A | 16430 | 16011 | 145 | 145 | 0.88% | 0.91% | 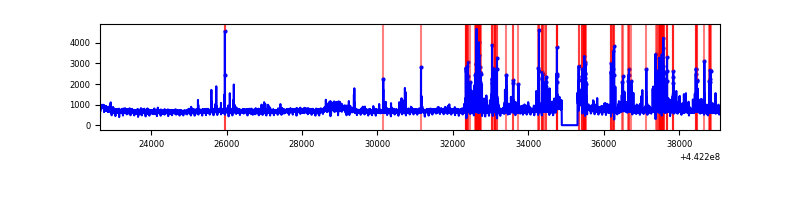 |
| B | 16431 | 16012 | 274 | 274 | 1.67% | 1.71% | 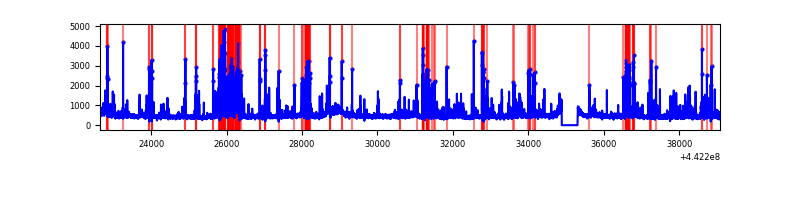 |
| C | 16431 | 16012 | 461 | 461 | 2.81% | 2.88% | 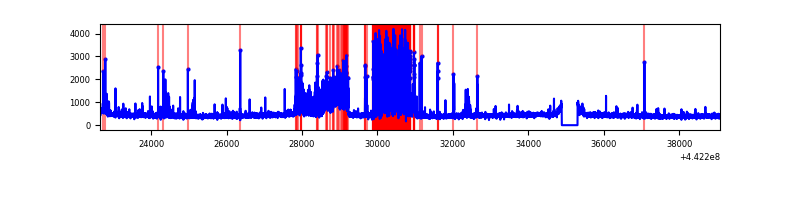 |
| D | 16431 | 16012 | 1858 | 1858 | 11.31% | 11.60% | 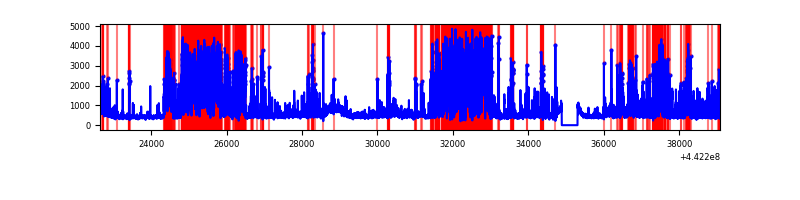 |
Top three noisy pixels from each quadrant. If the there are fewer than three noisy pixels in the level2.evt file, extra rows are filled as -1
| Pixel properties | Quadrant properties | ||||||
|---|---|---|---|---|---|---|---|
| Quadrant | DetID | PixID | Counts | Sigma | Mean | Median | Sigma |
| A | 10 | 83 | 4242056 | 11526.67 | 1766 | 1722 | 367.9 |
| A | 15 | 223 | 873593 | 2370.04 | 1766 | 1722 | 367.9 |
| A | 13 | 248 | 181293 | 488.13 | 1766 | 1722 | 367.9 |
| B | 0 | 189 | 1451278 | 4180.97 | 1743 | 1685 | 346.7 |
| B | 5 | 255 | 371537 | 1066.74 | 1743 | 1685 | 346.7 |
| B | 5 | 172 | 186668 | 533.54 | 1743 | 1685 | 346.7 |
| C | 14 | 254 | 1695497 | 4247.55 | 1701 | 1709 | 398.8 |
| C | 15 | 208 | 714435 | 1787.32 | 1701 | 1709 | 398.8 |
| C | 11 | 16 | 61207 | 149.2 | 1701 | 1709 | 398.8 |
| D | 1 | 52 | 4708421 | 11327.0 | 1654 | 1597 | 415.5 |
| D | 13 | 249 | 802712 | 1927.89 | 1654 | 1597 | 415.5 |
| D | 12 | 233 | 726420 | 1744.29 | 1654 | 1597 | 415.5 |
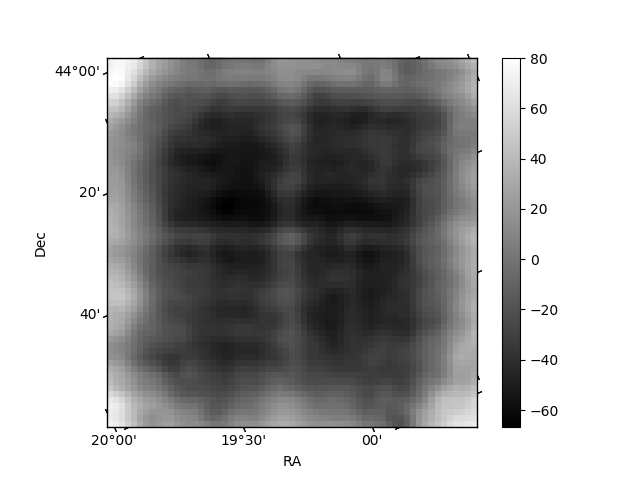
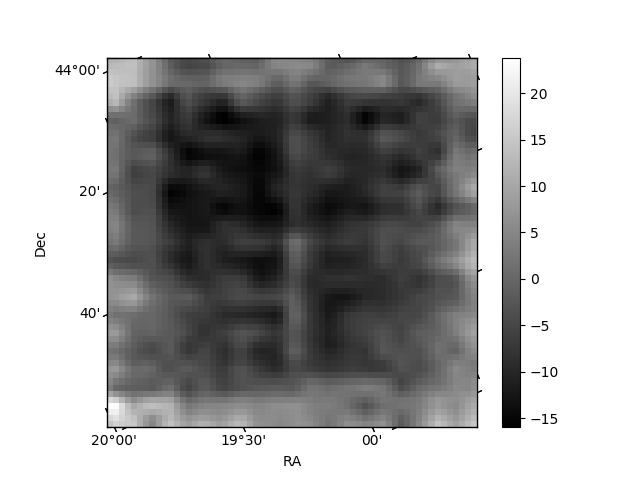
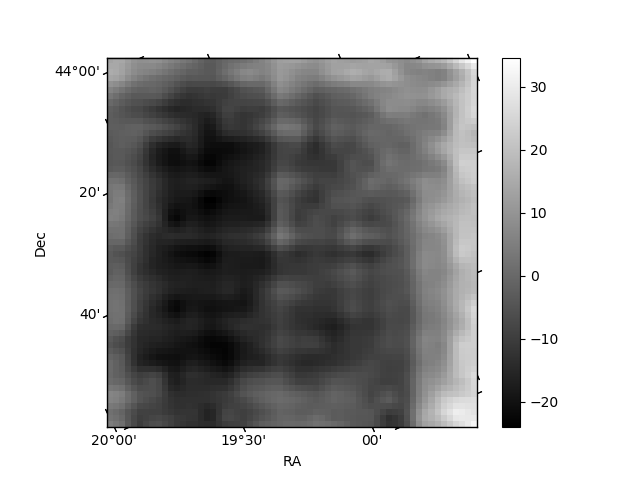
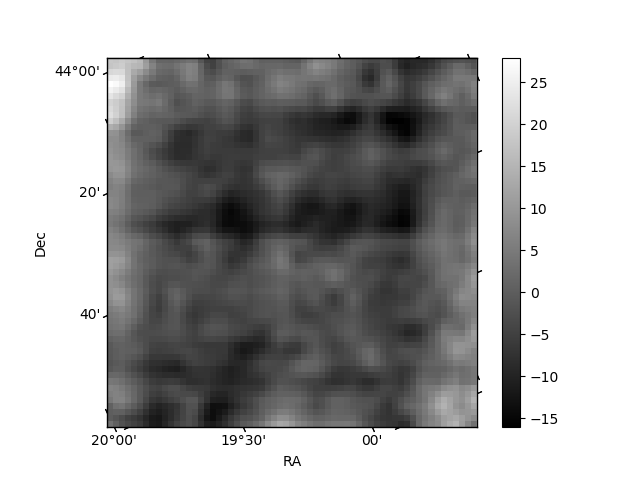
Histogram calculated using DETX and DETY for each event in the final _common_clean file
| Quadrant A | 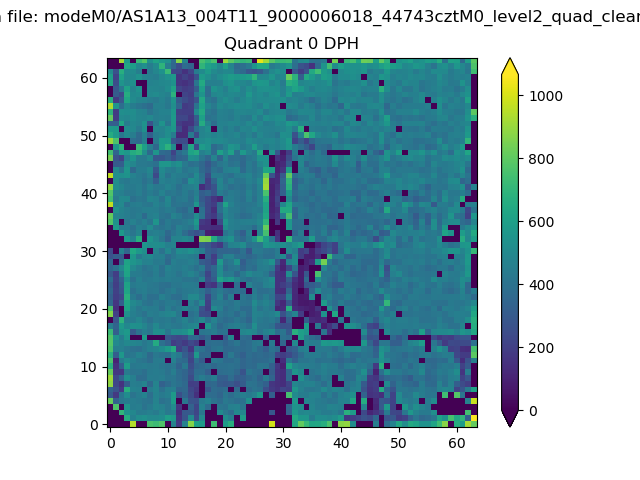 |
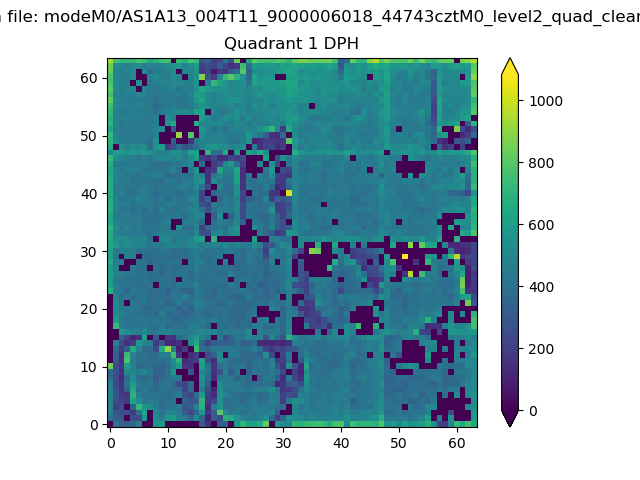 |
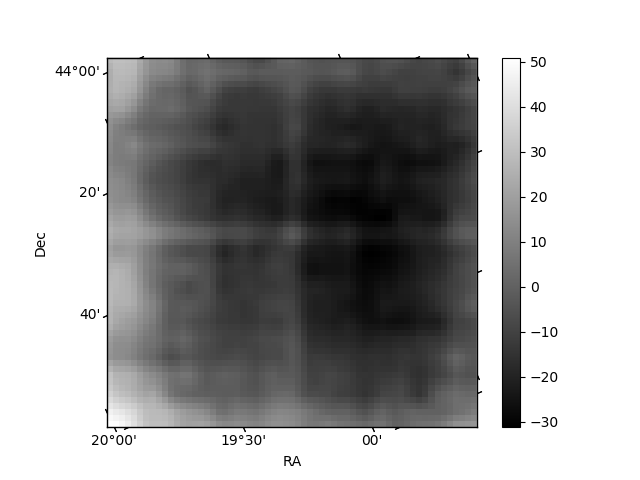
Quadrant B |
|---|---|---|---|
| Quadrant D | 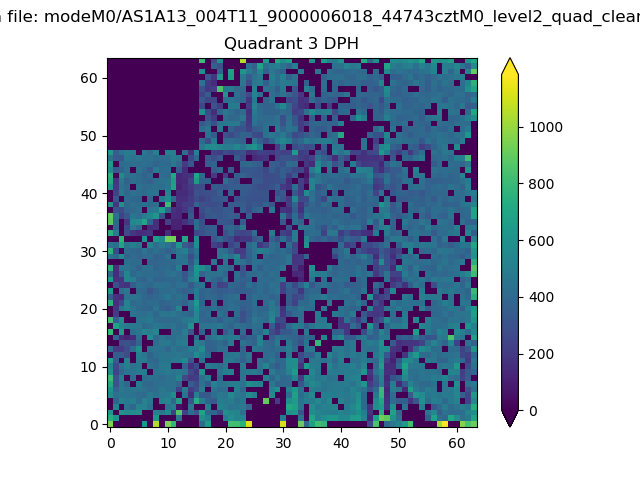 |
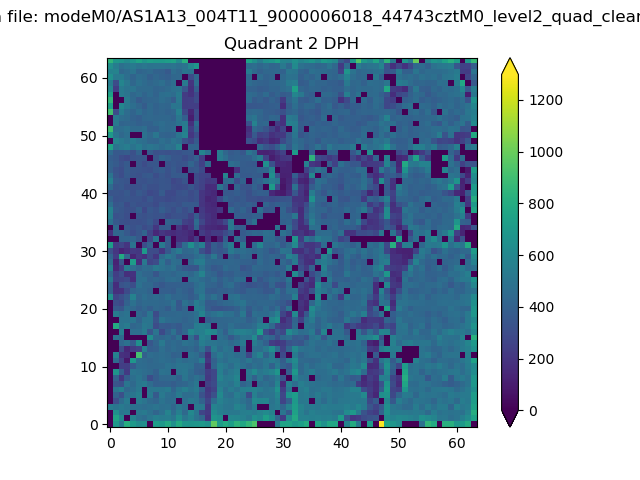 |
Quadrant C |
| Plot type | Count rate plots | Images |
|---|---|---|
| Comparison with Poisson distribution Blue bars denote a histogram of data divided into 1 sec bins. Red curve is a Poisson curve with rate = median count rate of data. |
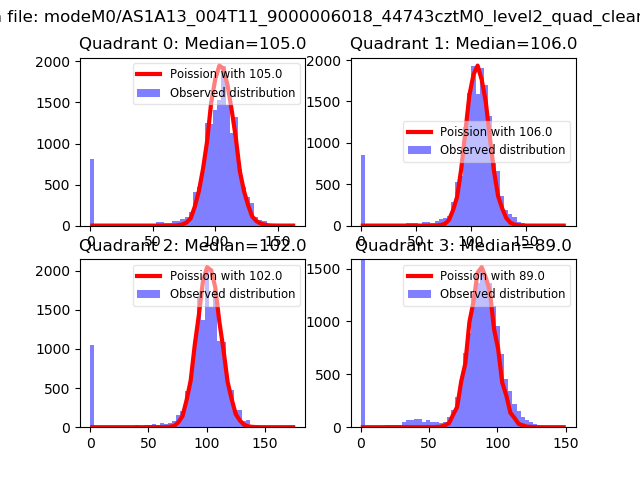 |
 |
| Quadrant-wise count rates Data is divided into 100 sec bins |
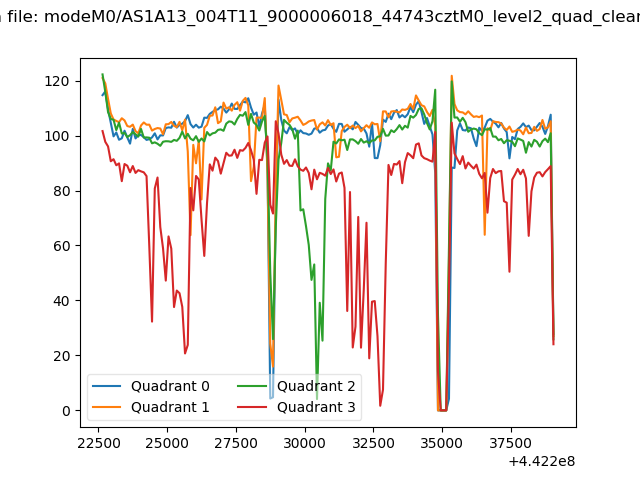 |
|
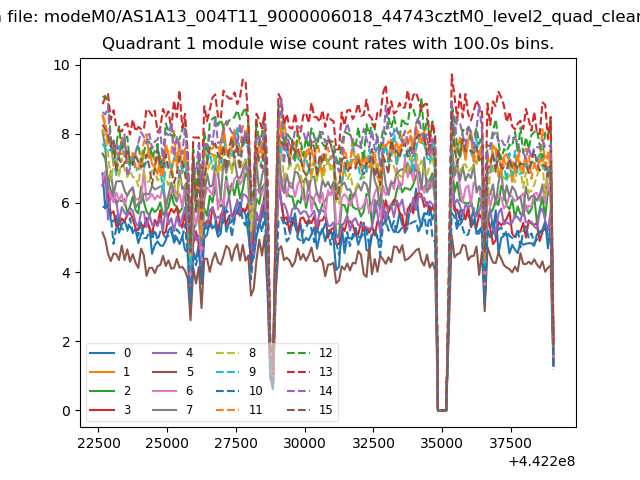
| Module-wise count rates for Quadrant A Data is divided into 100 sec bins |
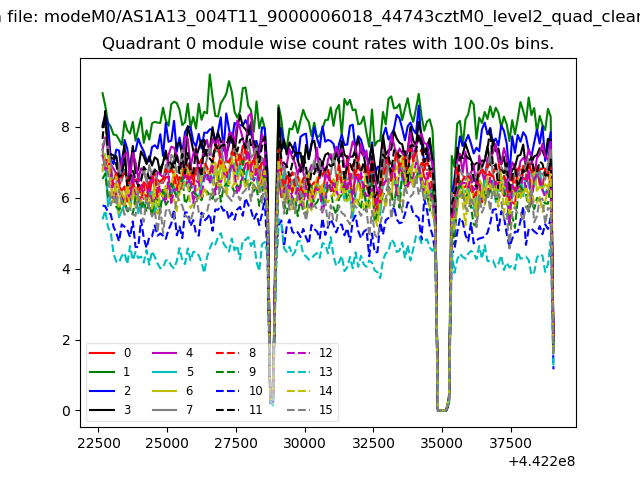 |
 |
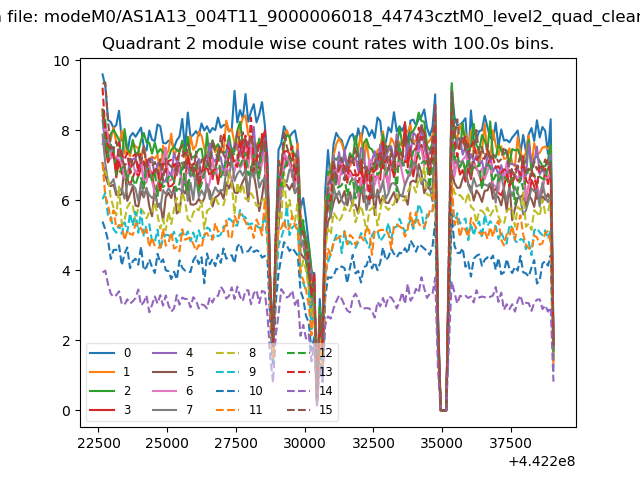
| Module-wise count rates for Quadrant B Data is divided into 100 sec bins |
 |
 |
| Module-wise count rates for Quadrant C Data is divided into 100 sec bins |
 |
 |
| Module-wise count rates for Quadrant D Data is divided into 100 sec bins |
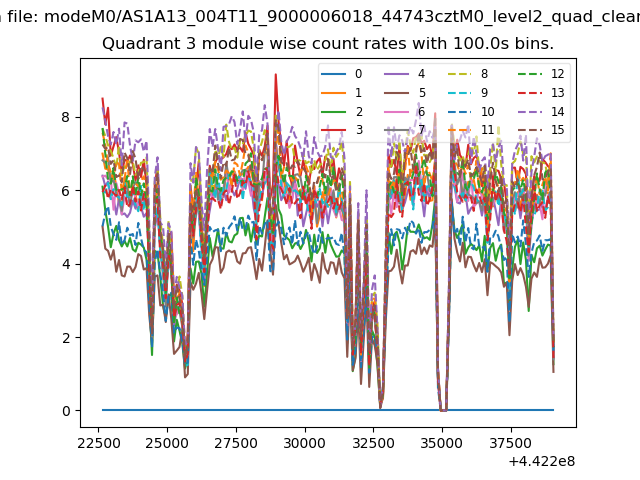 |
 |
| Parameter | Plot |
|---|---|
| CZT HV Monitor | 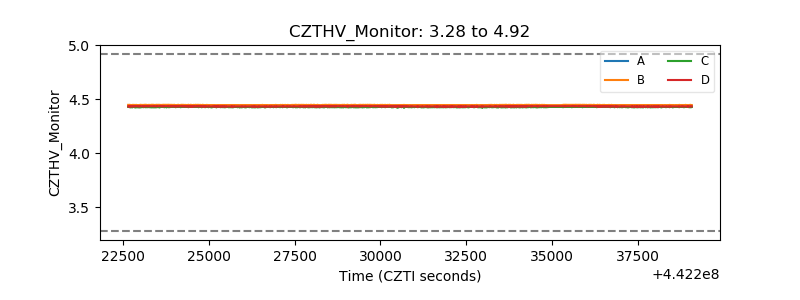 |
| D_VDD | 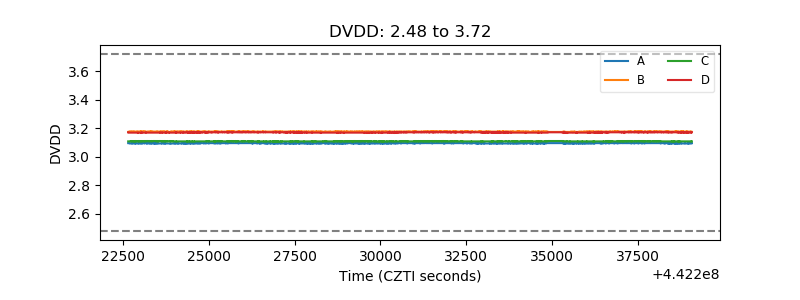 |
| Temperature 1 | 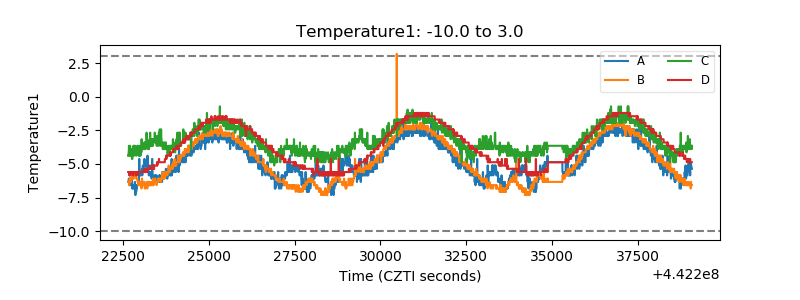 |
| Veto HV Monitor |  |
| Veto LLD | 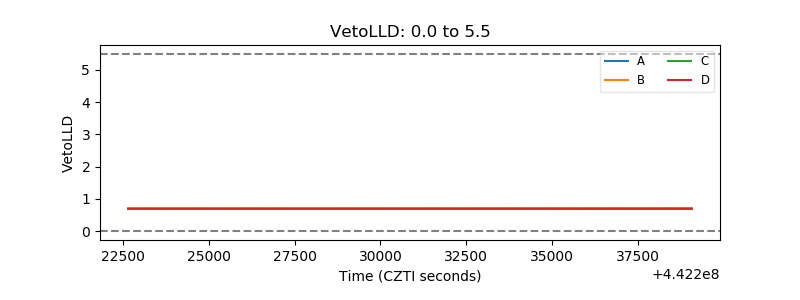 |
| Alpha Counter | 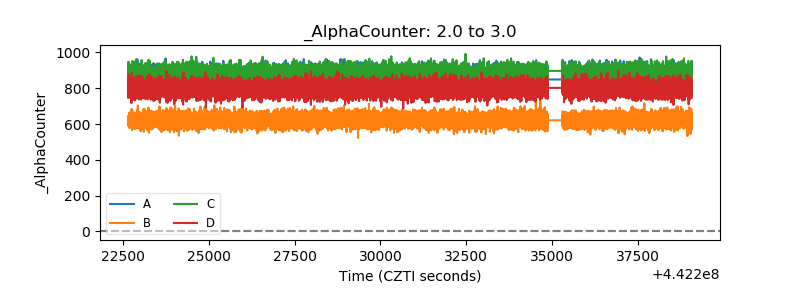 |
| _CPM_Rate | 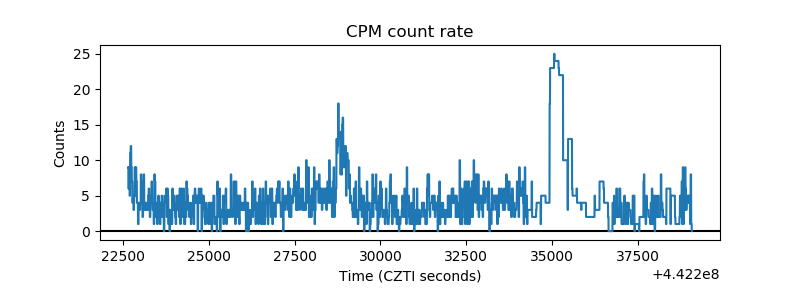 |
| CZT Counter | 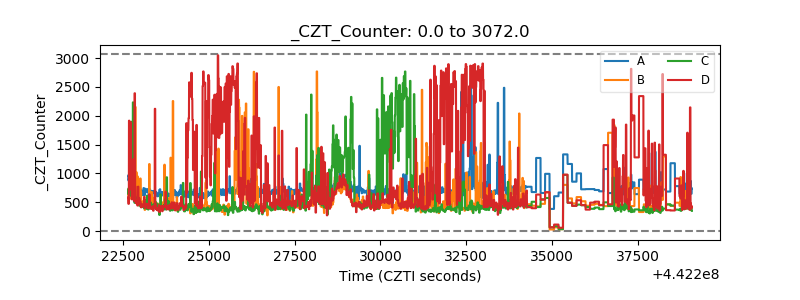 |
| +2.5 Volts monitor | 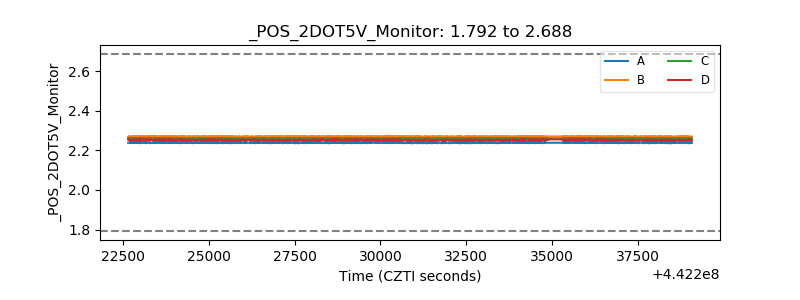 |
| +5 Volts monitor | 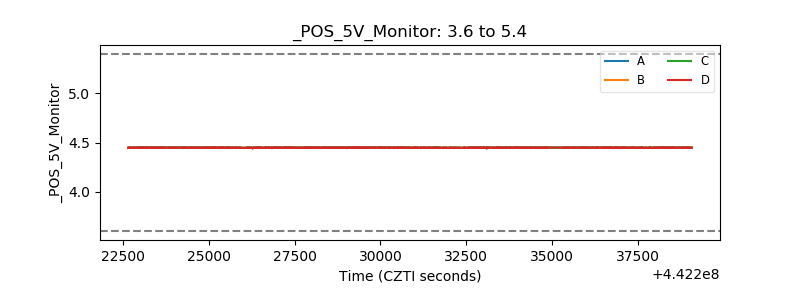 |
| _ROLL_ROT | 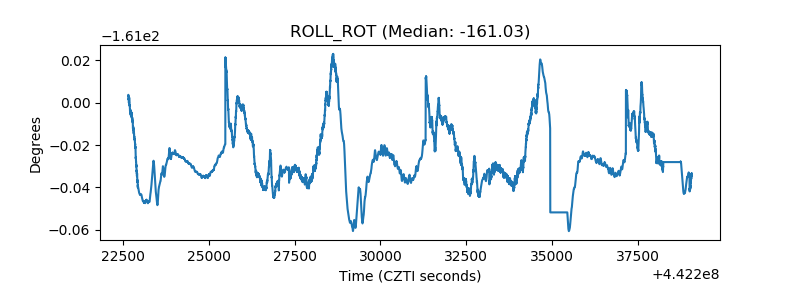 |
| _Roll_DEC | 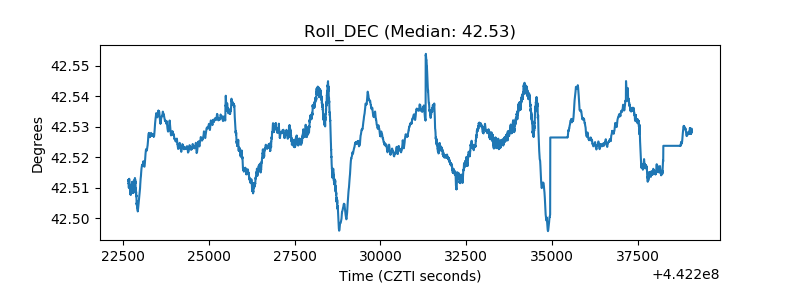 |
| _Roll_RA | 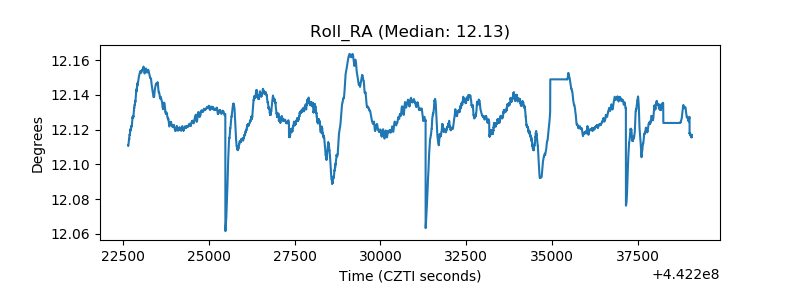 |
| Veto Counter | 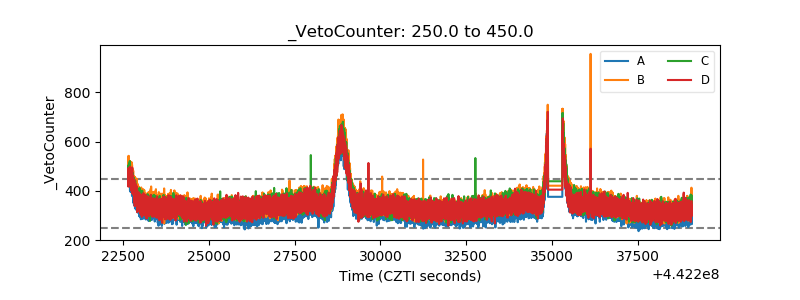 |