| Param | Original file | Final file |
|---|---|---|
| Filename | modeM0/AS1A13_004T11_9000006018_44744cztM0_level2.fits | modeM0/AS1A13_004T11_9000006018_44744cztM0_level2_quad_clean.evt |
| Size (bytes) | 738,074,880 | 142,824,960 |
| Size | 703.9 MB | 136.2 MB |
| Events in quadrant A | 9,267,999 | 923,196 |
| Events in quadrant B | 4,778,551 | 995,447 |
| Events in quadrant C | 4,120,292 | 966,963 |
| Events in quadrant D | 8,435,800 | 794,825 |
| Mode SS | |||
|---|---|---|---|
| Quadrant | BADHDUFLAG | Total packets | Discarded packets |
| A | 0 | 190 | 0 |
| B | 0 | 190 | 0 |
| C | 0 | 190 | 0 |
| D | 0 | 190 | 0 |
| Mode M0 | |||
|---|---|---|---|
| Quadrant | BADHDUFLAG | Total packets | Discarded packets |
| A | 0 | 34668 | 2 |
| B | 0 | 20561 | 2 |
| C | 0 | 19148 | 2 |
| D | 0 | 31641 | 2 |
| Mode M9 | |||
|---|---|---|---|
| Quadrant | BADHDUFLAG | Total packets | Discarded packets |
| A | 0 | 15 | 0 |
| B | 0 | 15 | 0 |
| C | 0 | 15 | 0 |
| D | 0 | 15 | 0 |
| Quadrant | Total seconds | Saturated seconds | Saturation percentage |
|---|---|---|---|
| A | 9274 | 979 | 10.556394% |
| B | 9275 | 184 | 1.983827% |
| C | 9275 | 69 | 0.743935% |
| D | 9275 | 1280 | 13.800539% |
Noise dominated data is calculated using 1-second bins in cleaned event files. If a bin has >2000 counts, and if more than 50% of those come from <1% of pixels, then it is considered to be noise-dominated and hence unusable.
| Quadrant | # 1 sec bins | Bins with >0 counts | Bins with >2000 counts | High rate bins dominated by noise | Noise dominated (total time) | Noise dominated (detector-on time) | Marked lightcurve |
|---|---|---|---|---|---|---|---|
| A | 10764 | 9276 | 587 | 587 | 5.45% | 6.33% | 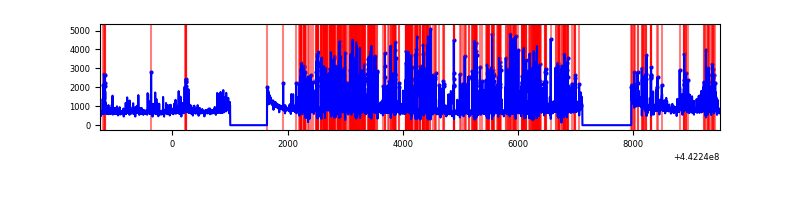 |
| B | 10765 | 9277 | 39 | 39 | 0.36% | 0.42% | 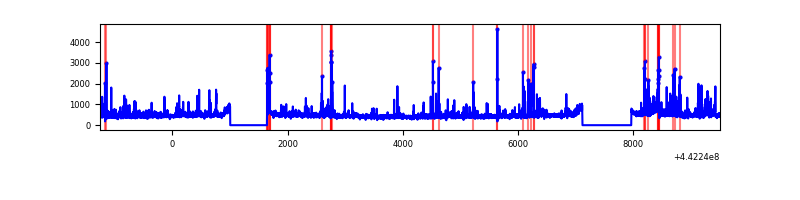 |
| C | 10765 | 9277 | 11 | 11 | 0.10% | 0.12% | 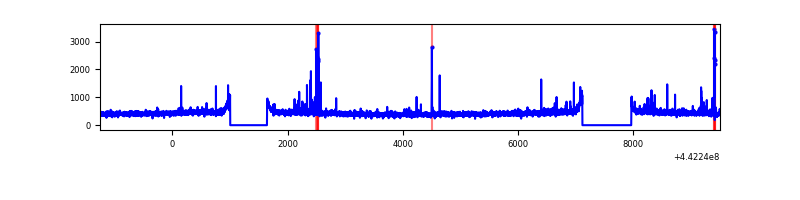 |
| D | 10765 | 9277 | 960 | 960 | 8.92% | 10.35% | 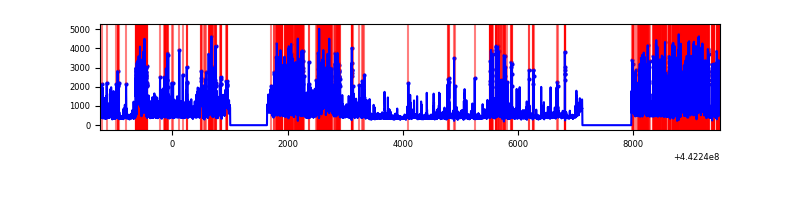 |
Top three noisy pixels from each quadrant. If the there are fewer than three noisy pixels in the level2.evt file, extra rows are filled as -1
| Pixel properties | Quadrant properties | ||||||
|---|---|---|---|---|---|---|---|
| Quadrant | DetID | PixID | Counts | Sigma | Mean | Median | Sigma |
| A | 15 | 223 | 2678439 | 12833.07 | 996 | 974 | 208.6 |
| A | 10 | 83 | 2674773 | 12815.5 | 996 | 974 | 208.6 |
| A | 13 | 248 | 65562 | 309.57 | 996 | 974 | 208.6 |
| B | 0 | 189 | 343078 | 1696.92 | 1024 | 991 | 201.6 |
| B | 5 | 255 | 131382 | 646.8 | 1024 | 991 | 201.6 |
| B | 15 | 36 | 63327 | 309.21 | 1024 | 991 | 201.6 |
| C | 14 | 254 | 110880 | 462.16 | 1015 | 1020 | 237.7 |
| C | 3 | 233 | 15304 | 60.09 | 1015 | 1020 | 237.7 |
| C | 1 | 3 | 13266 | 51.52 | 1015 | 1020 | 237.7 |
| D | 8 | 129 | 2133980 | 8873.05 | 958 | 929 | 240.4 |
| D | 1 | 47 | 1013389 | 4211.62 | 958 | 929 | 240.4 |
| D | 13 | 174 | 479588 | 1991.12 | 958 | 929 | 240.4 |
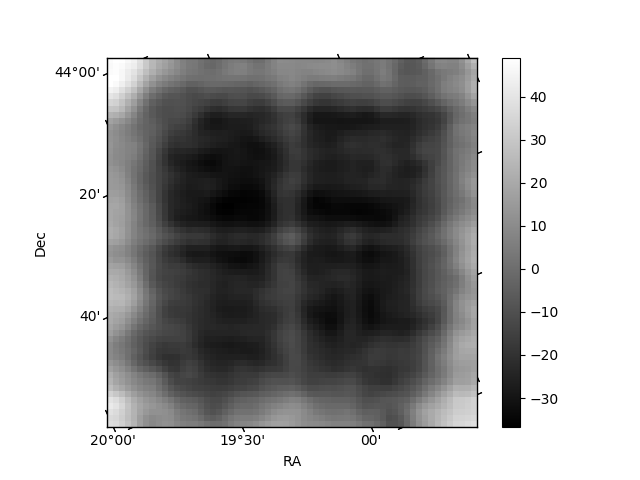
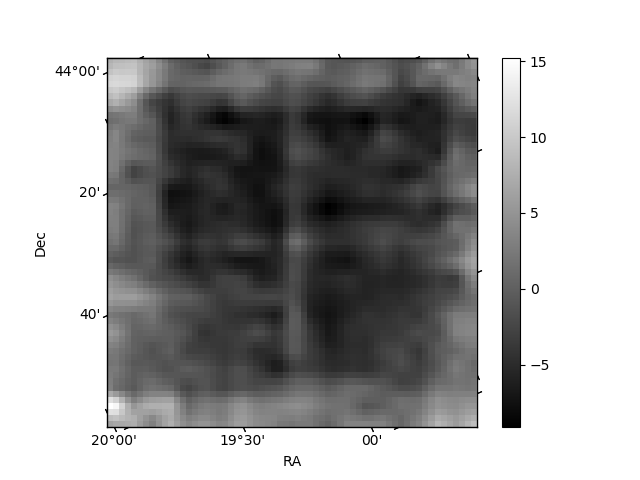
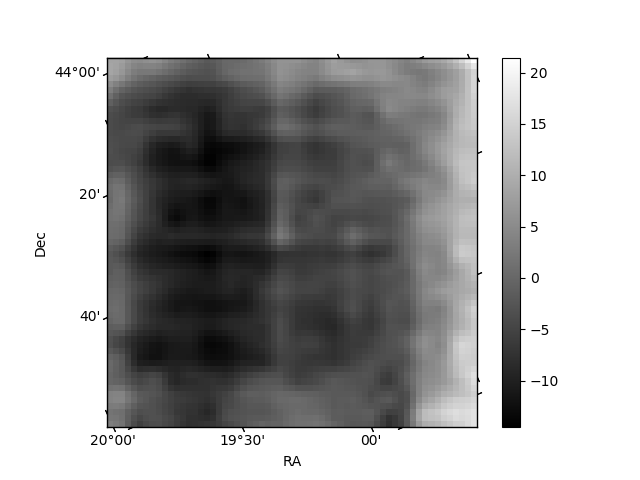
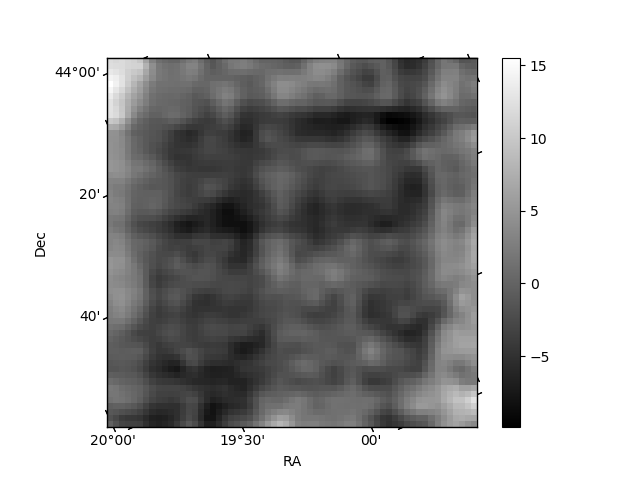
Histogram calculated using DETX and DETY for each event in the final _common_clean file
| Quadrant A | 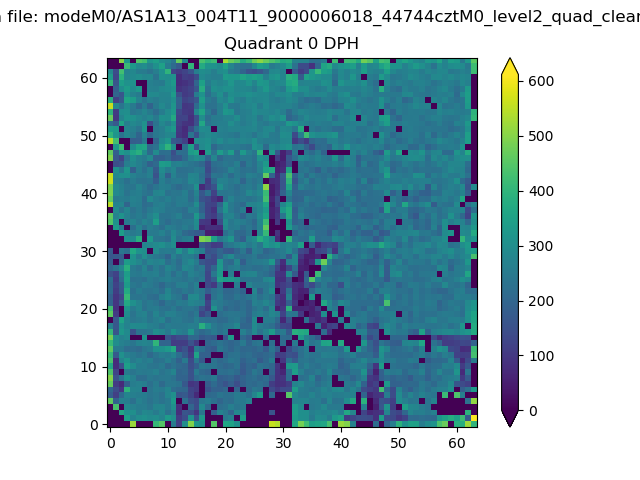 |
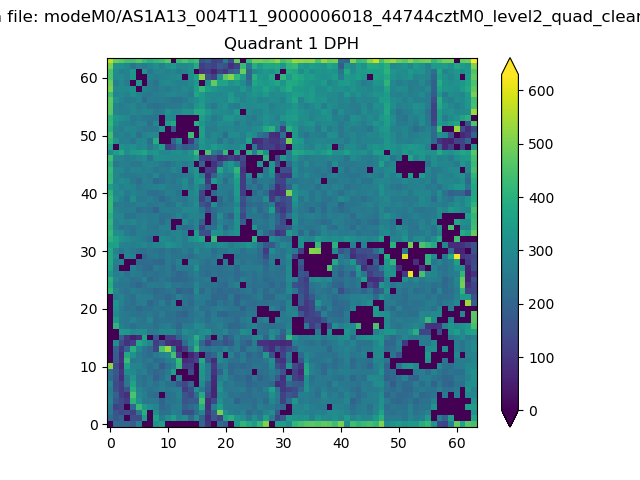 |
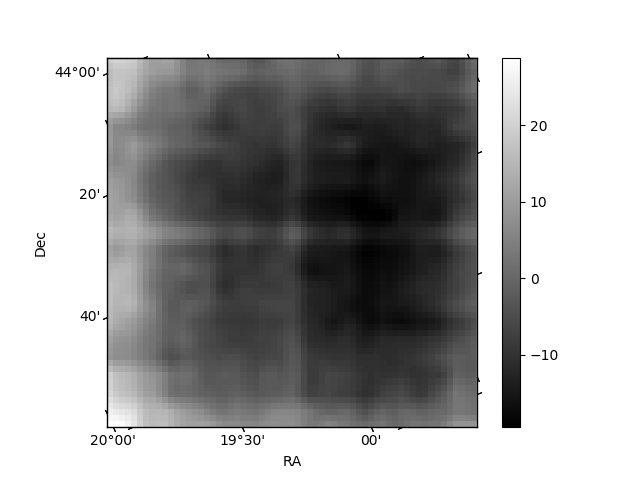
Quadrant B |
|---|---|---|---|
| Quadrant D | 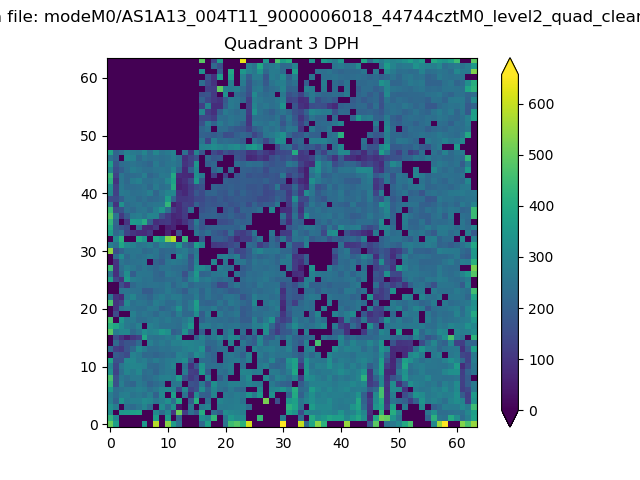 |
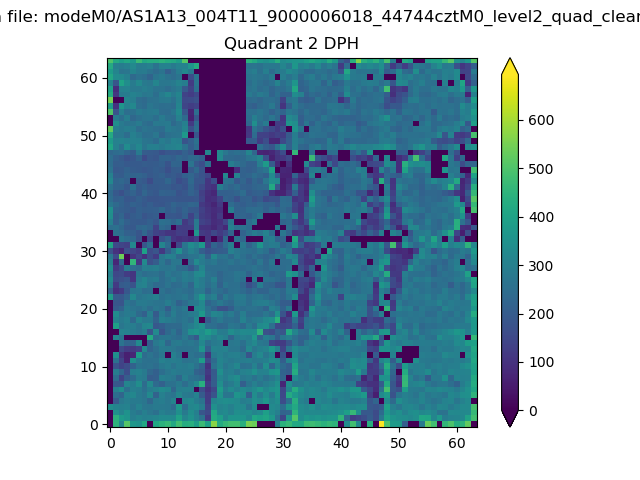 |
Quadrant C |
| Plot type | Count rate plots | Images |
|---|---|---|
| Comparison with Poisson distribution Blue bars denote a histogram of data divided into 1 sec bins. Red curve is a Poisson curve with rate = median count rate of data. |
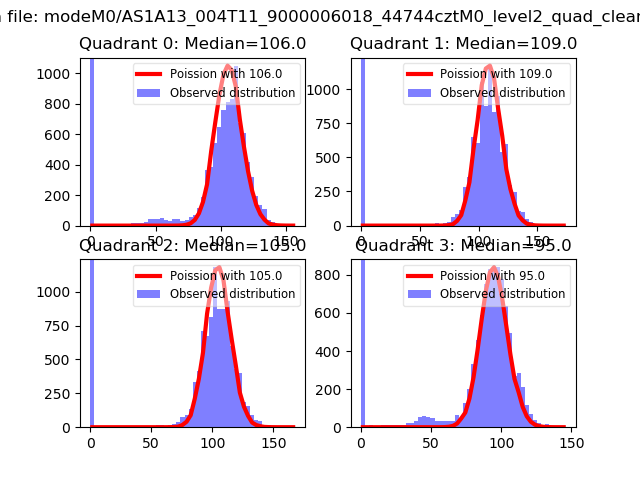 |
 |
| Quadrant-wise count rates Data is divided into 100 sec bins |
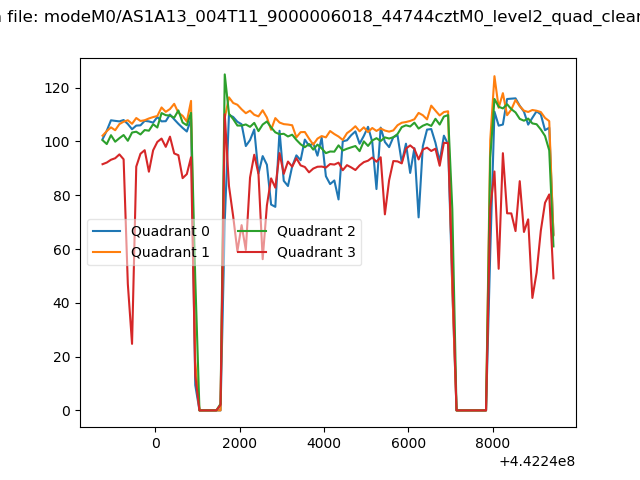 |
|
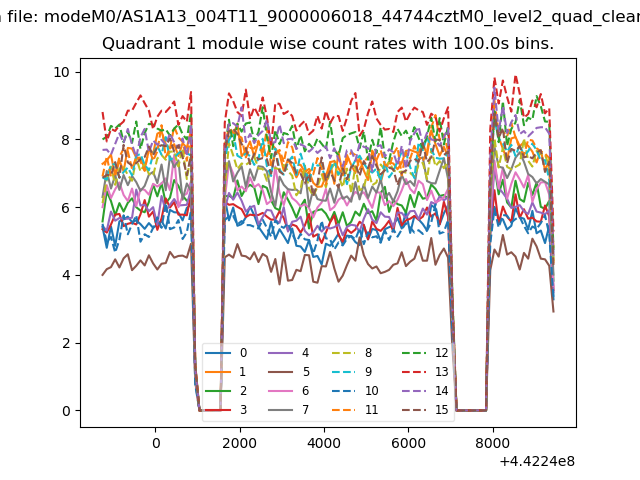
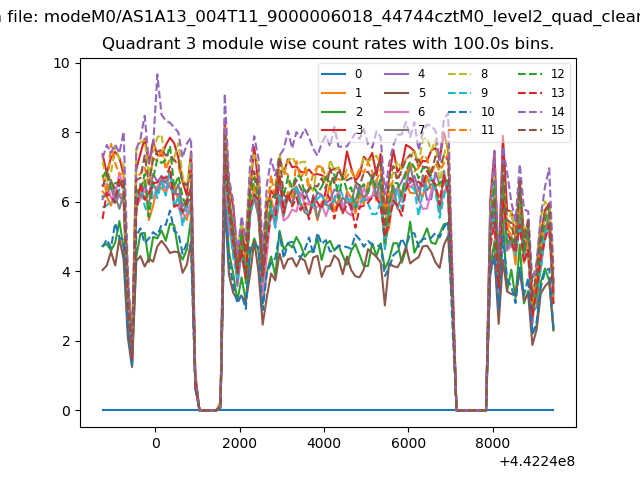
| Module-wise count rates for Quadrant A Data is divided into 100 sec bins |
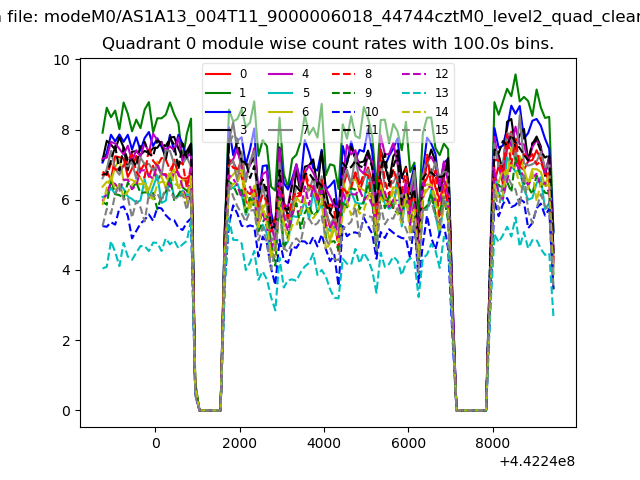 |
 |
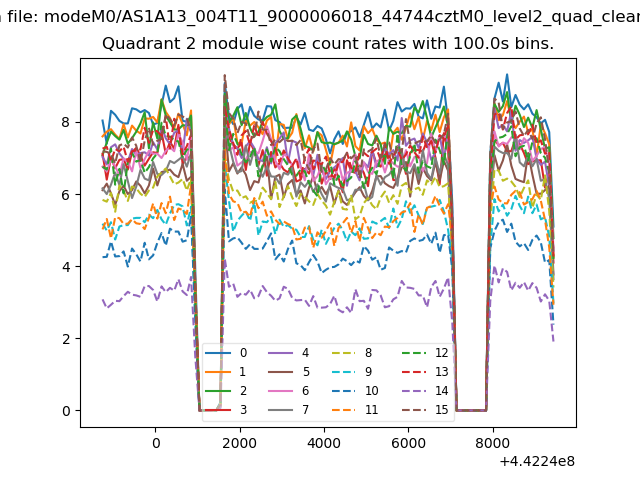
| Module-wise count rates for Quadrant B Data is divided into 100 sec bins |
 |
 |
| Module-wise count rates for Quadrant C Data is divided into 100 sec bins |
 |
 |
| Module-wise count rates for Quadrant D Data is divided into 100 sec bins |
 |
 |
| Parameter | Plot |
|---|---|
| CZT HV Monitor | 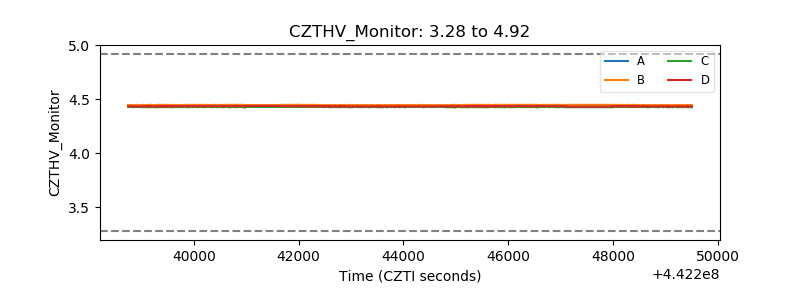 |
| D_VDD | 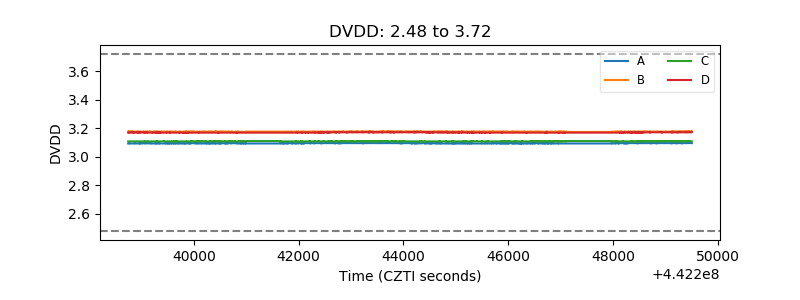 |
| Temperature 1 | 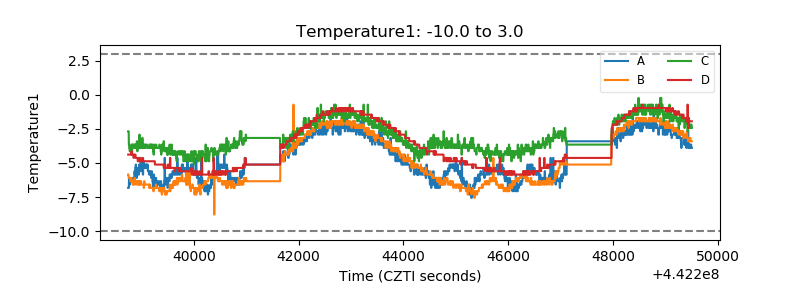 |
| Veto HV Monitor | 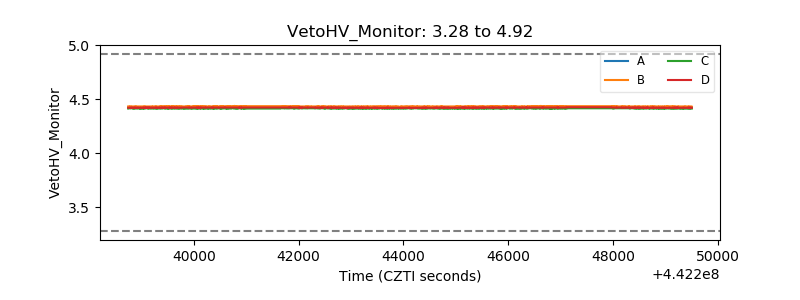 |
| Veto LLD | 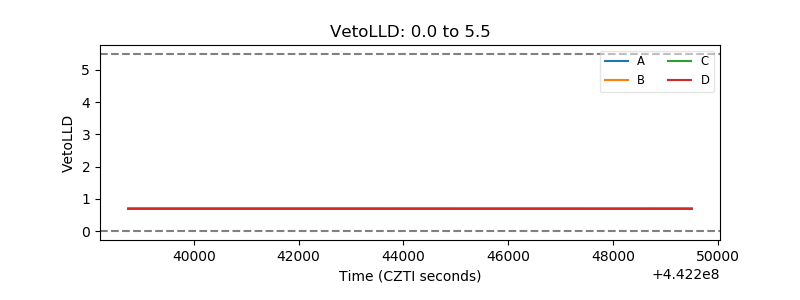 |
| Alpha Counter | 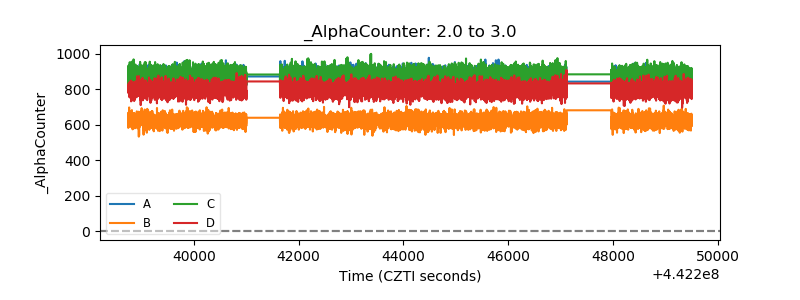 |
| _CPM_Rate | 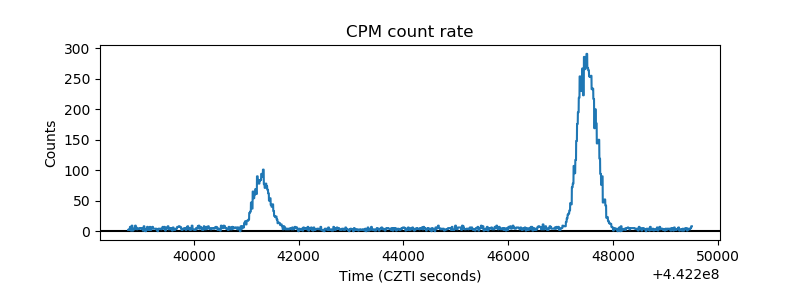 |
| CZT Counter | 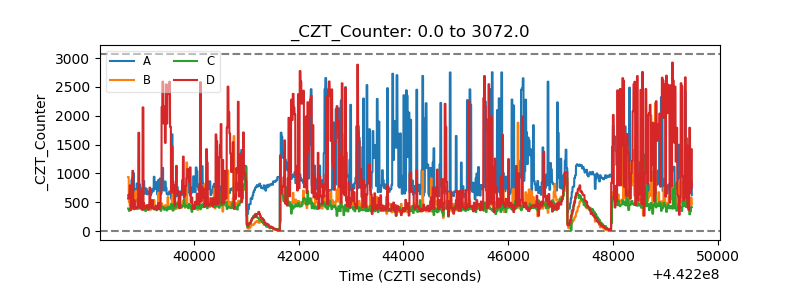 |
| +2.5 Volts monitor | 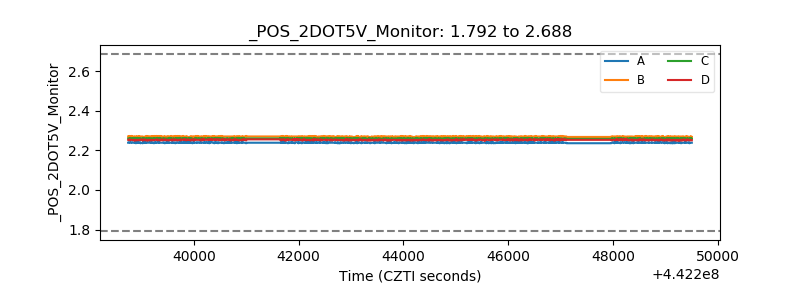 |
| +5 Volts monitor | 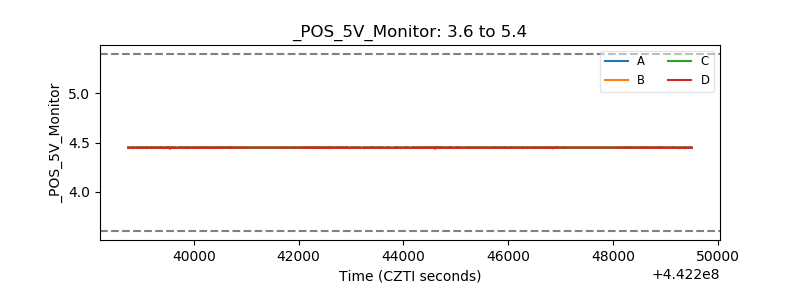 |
| _ROLL_ROT | 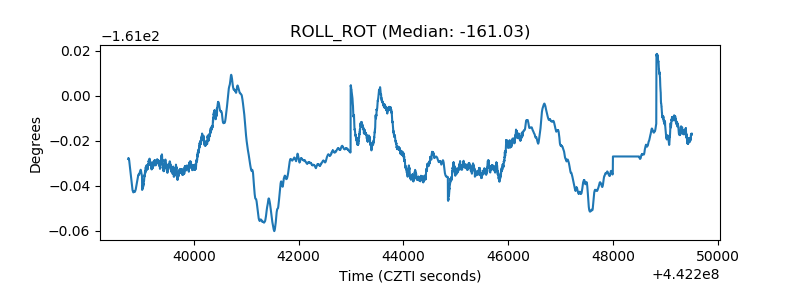 |
| _Roll_DEC | 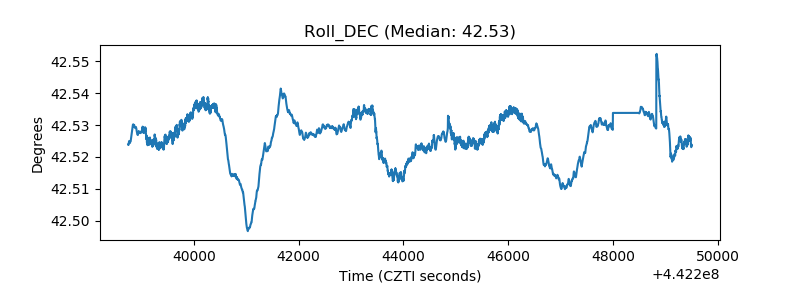 |
| _Roll_RA | 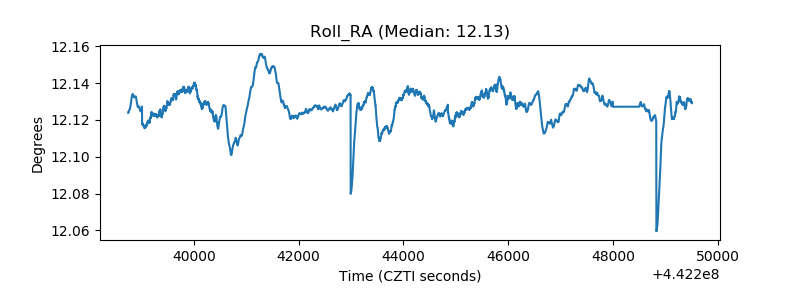 |
| Veto Counter | 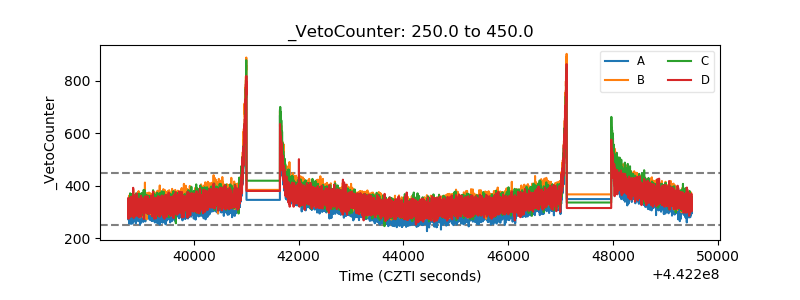 |