| Param | Original file | Final file |
|---|---|---|
| Filename | modeM0/AS1A13_004T11_9000006018_44745cztM0_level2.fits | modeM0/AS1A13_004T11_9000006018_44745cztM0_level2_quad_clean.evt |
| Size (bytes) | 525,841,920 | 96,220,800 |
| Size | 501.5 MB | 91.8 MB |
| Events in quadrant A | 6,113,764 | 640,512 |
| Events in quadrant B | 3,546,709 | 679,232 |
| Events in quadrant C | 2,870,628 | 655,352 |
| Events in quadrant D | 6,450,493 | 503,294 |
| Mode SS | |||
|---|---|---|---|
| Quadrant | BADHDUFLAG | Total packets | Discarded packets |
| A | 0 | 128 | 0 |
| B | 0 | 128 | 0 |
| C | 0 | 128 | 0 |
| D | 0 | 128 | 0 |
| Mode M0 | |||
|---|---|---|---|
| Quadrant | BADHDUFLAG | Total packets | Discarded packets |
| A | 0 | 22980 | 1 |
| B | 0 | 14797 | 1 |
| C | 0 | 13150 | 1 |
| D | 0 | 23661 | 3 |
| Mode M9 | |||
|---|---|---|---|
| Quadrant | BADHDUFLAG | Total packets | Discarded packets |
| A | 0 | 9 | 0 |
| B | 0 | 9 | 0 |
| C | 0 | 9 | 0 |
| D | 0 | 9 | 0 |
| Quadrant | Total seconds | Saturated seconds | Saturation percentage |
|---|---|---|---|
| A | 6224 | 544 | 8.740360% |
| B | 6224 | 148 | 2.377892% |
| C | 6224 | 72 | 1.156812% |
| D | 6223 | 1286 | 20.665274% |
Noise dominated data is calculated using 1-second bins in cleaned event files. If a bin has >2000 counts, and if more than 50% of those come from <1% of pixels, then it is considered to be noise-dominated and hence unusable.
| Quadrant | # 1 sec bins | Bins with >0 counts | Bins with >2000 counts | High rate bins dominated by noise | Noise dominated (total time) | Noise dominated (detector-on time) | Marked lightcurve |
|---|---|---|---|---|---|---|---|
| A | 7204 | 6224 | 358 | 358 | 4.97% | 5.75% | 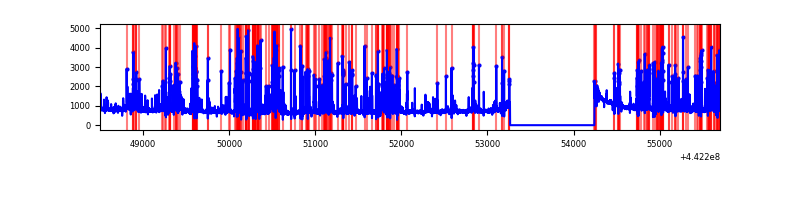 |
| B | 7204 | 6225 | 71 | 71 | 0.99% | 1.14% | 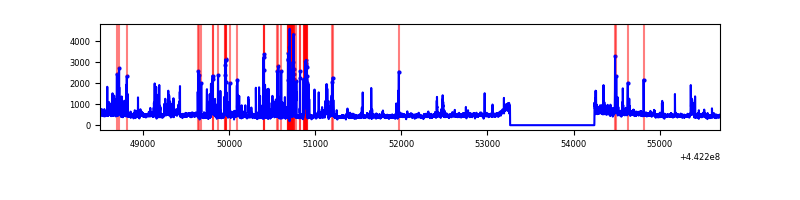 |
| C | 7204 | 6225 | 15 | 15 | 0.21% | 0.24% | 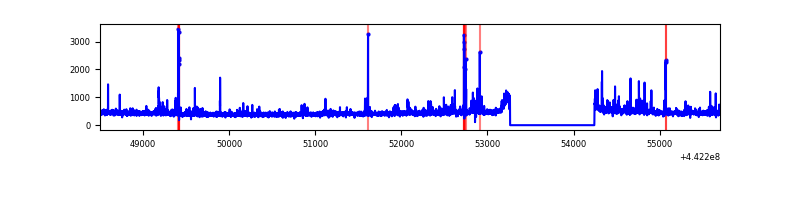 |
| D | 7203 | 6224 | 1016 | 1016 | 14.11% | 16.32% | 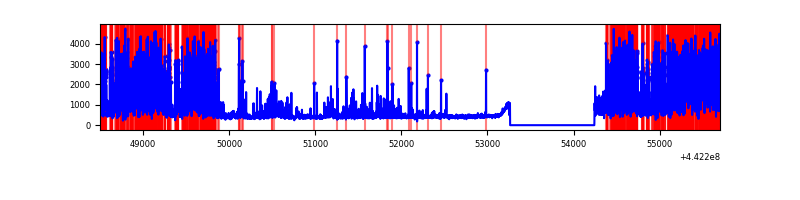 |
Top three noisy pixels from each quadrant. If the there are fewer than three noisy pixels in the level2.evt file, extra rows are filled as -1
| Pixel properties | Quadrant properties | ||||||
|---|---|---|---|---|---|---|---|
| Quadrant | DetID | PixID | Counts | Sigma | Mean | Median | Sigma |
| A | 10 | 83 | 1846438 | 13443.79 | 662 | 648 | 137.3 |
| A | 15 | 223 | 1665429 | 12125.41 | 662 | 648 | 137.3 |
| A | 13 | 248 | 37843 | 270.91 | 662 | 648 | 137.3 |
| B | 0 | 189 | 486423 | 3691.92 | 676 | 657 | 131.6 |
| B | 5 | 255 | 122787 | 928.21 | 676 | 657 | 131.6 |
| B | 0 | 219 | 100168 | 756.3 | 676 | 657 | 131.6 |
| C | 14 | 254 | 129434 | 812.0 | 672 | 675 | 158.6 |
| C | 3 | 233 | 36032 | 222.97 | 672 | 675 | 158.6 |
| C | 12 | 2 | 32181 | 198.69 | 672 | 675 | 158.6 |
| D | 8 | 129 | 2951221 | 19065.94 | 612 | 592 | 154.8 |
| D | 13 | 249 | 259037 | 1669.98 | 612 | 592 | 154.8 |
| D | 1 | 47 | 200011 | 1288.58 | 612 | 592 | 154.8 |
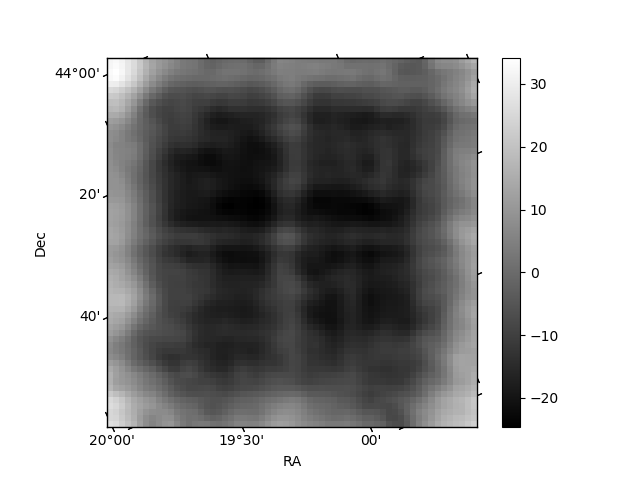
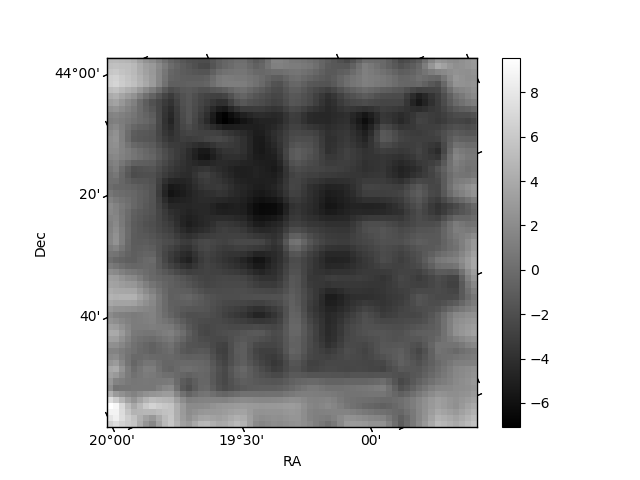
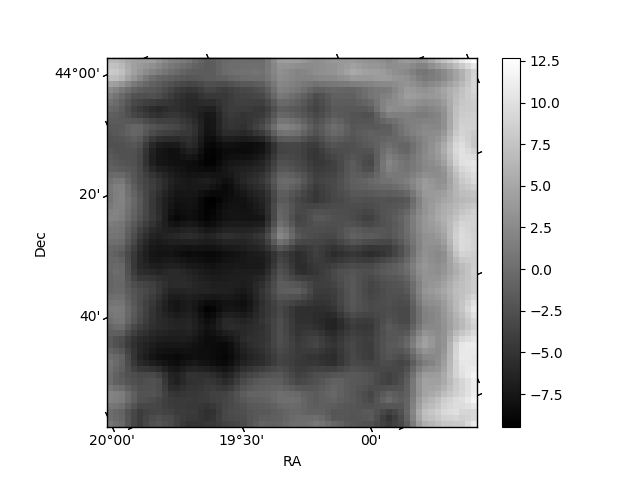
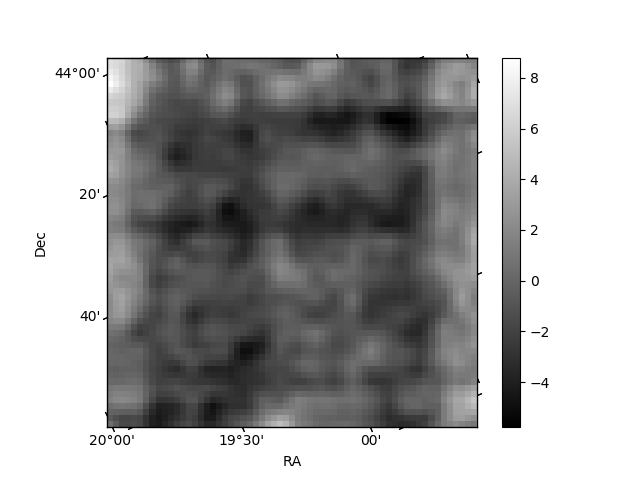
Histogram calculated using DETX and DETY for each event in the final _common_clean file
| Quadrant A | 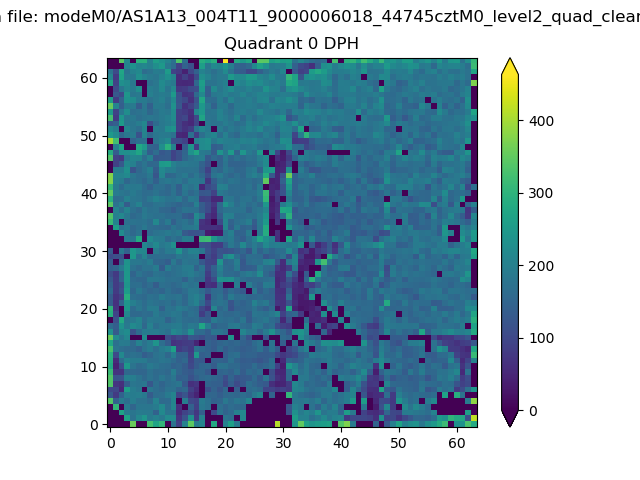 |
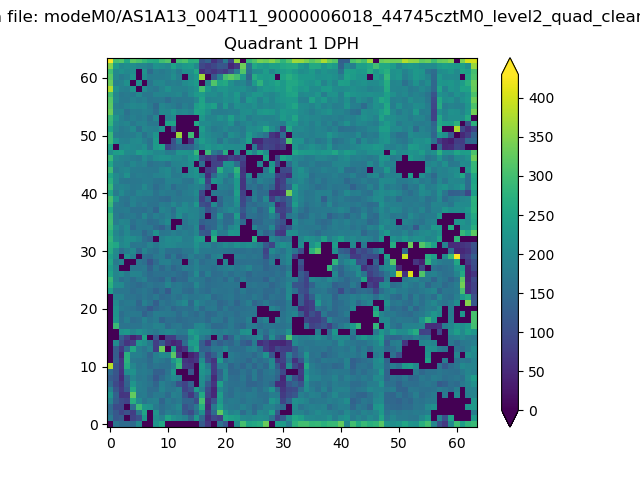 |
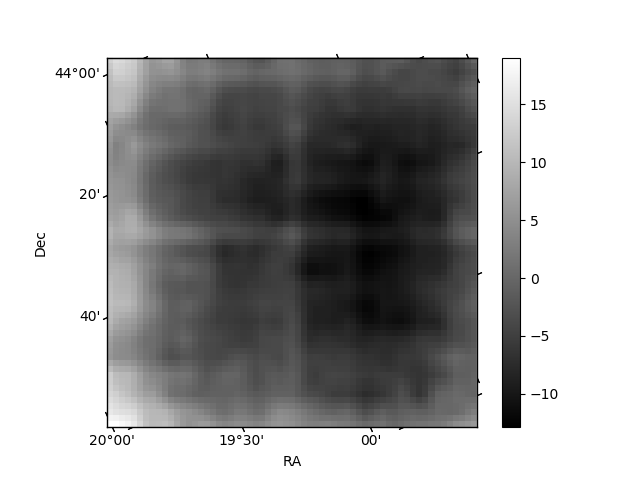
Quadrant B |
|---|---|---|---|
| Quadrant D | 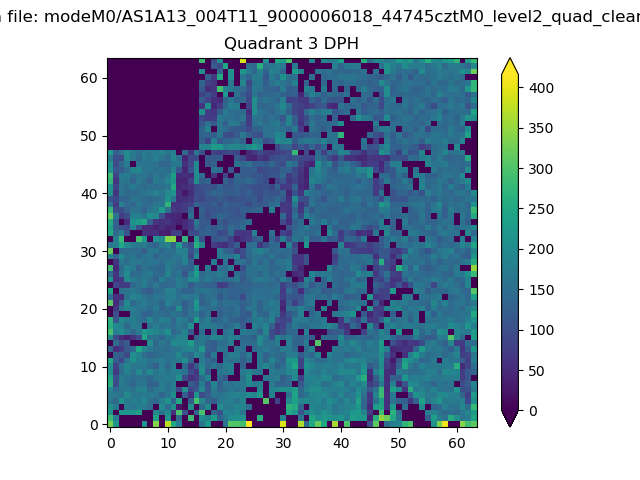 |
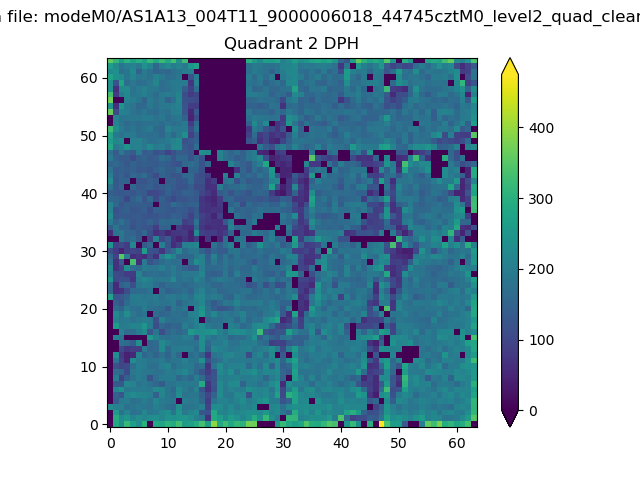 |
Quadrant C |
| Plot type | Count rate plots | Images |
|---|---|---|
| Comparison with Poisson distribution Blue bars denote a histogram of data divided into 1 sec bins. Red curve is a Poisson curve with rate = median count rate of data. |
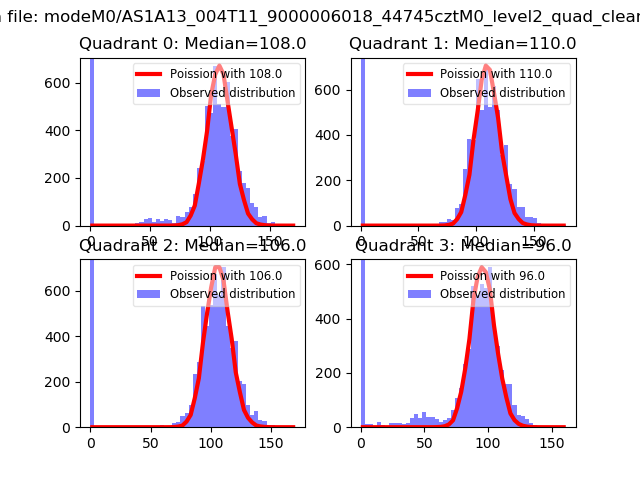 |
 |
| Quadrant-wise count rates Data is divided into 100 sec bins |
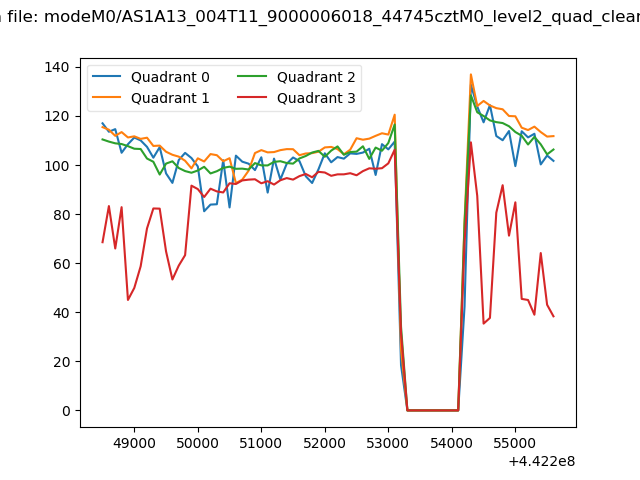 |
|
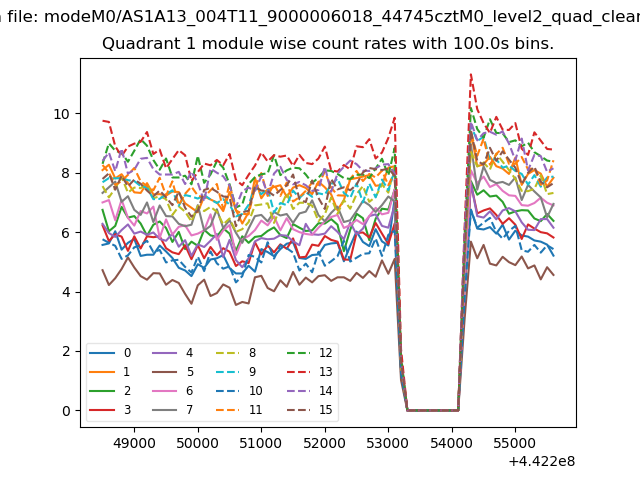
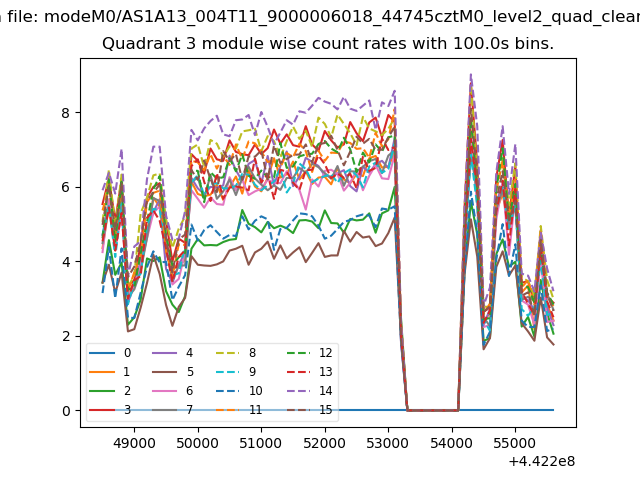
| Module-wise count rates for Quadrant A Data is divided into 100 sec bins |
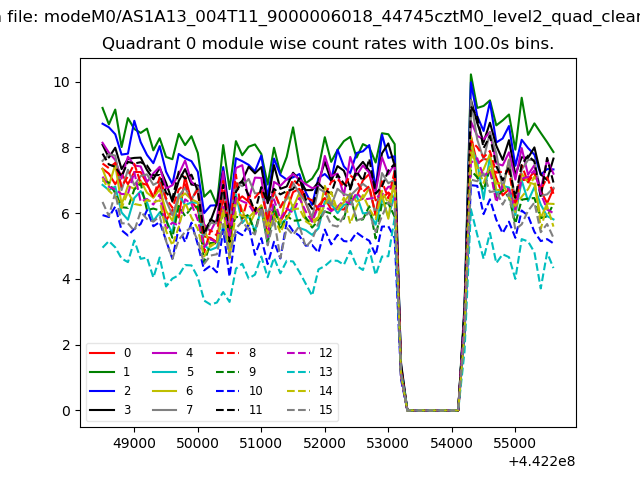 |
 |
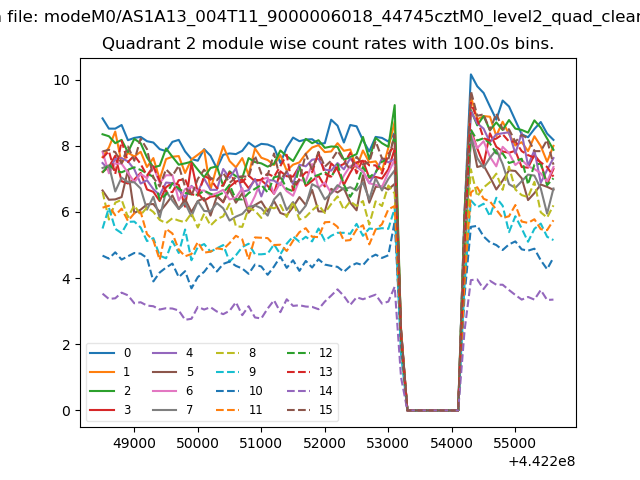
| Module-wise count rates for Quadrant B Data is divided into 100 sec bins |
 |
 |
| Module-wise count rates for Quadrant C Data is divided into 100 sec bins |
 |
 |
| Module-wise count rates for Quadrant D Data is divided into 100 sec bins |
 |
 |
| Parameter | Plot |
|---|---|
| CZT HV Monitor | 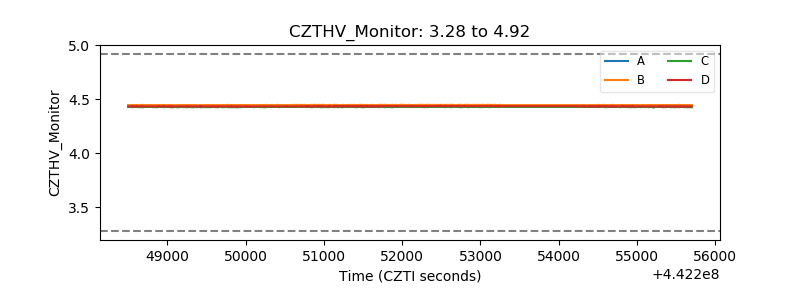 |
| D_VDD | 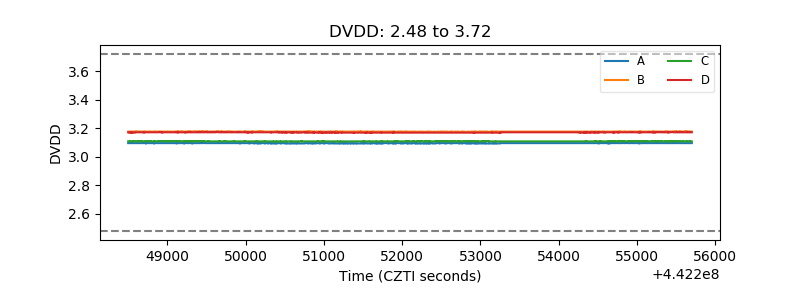 |
| Temperature 1 | 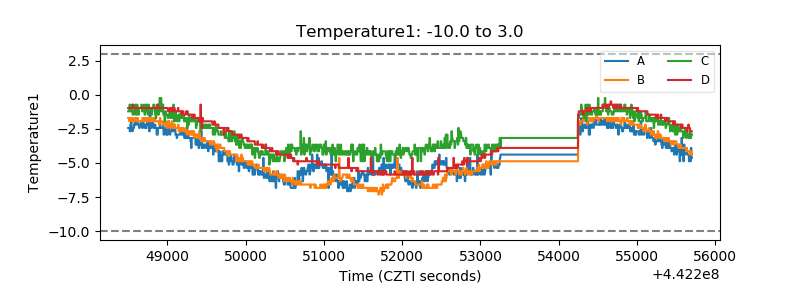 |
| Veto HV Monitor | 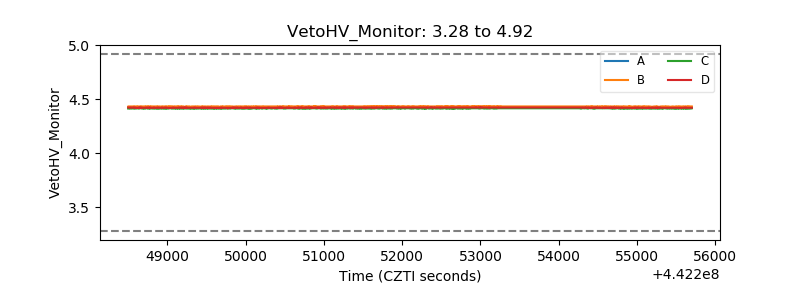 |
| Veto LLD | 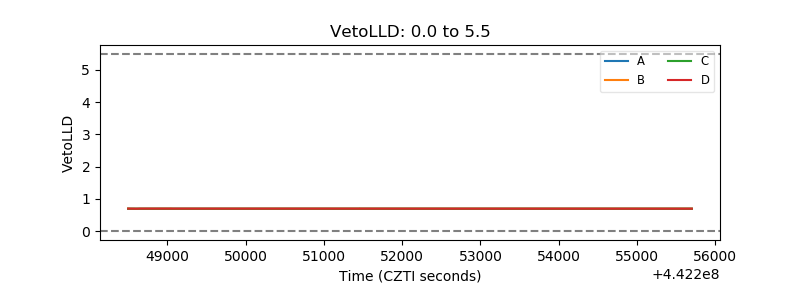 |
| Alpha Counter | 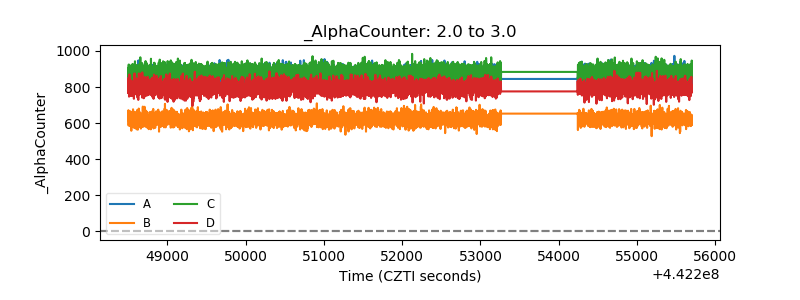 |
| _CPM_Rate | 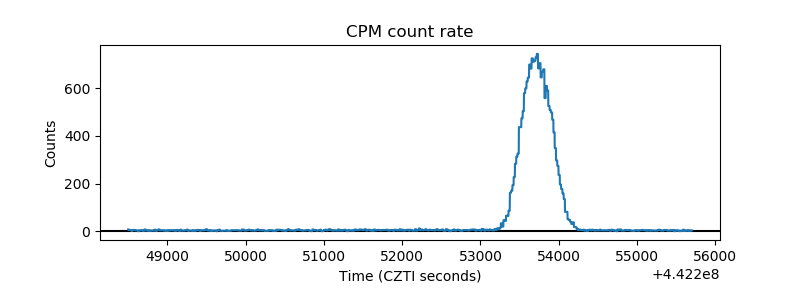 |
| CZT Counter | 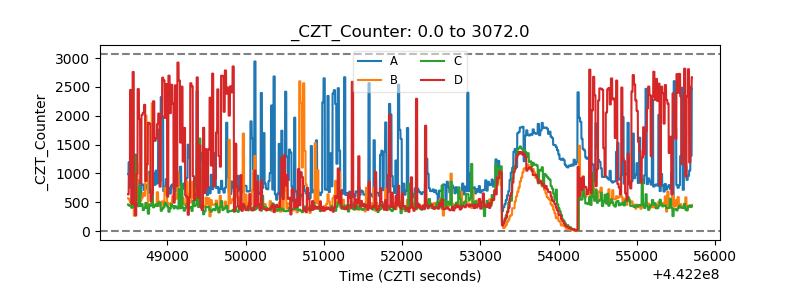 |
| +2.5 Volts monitor | 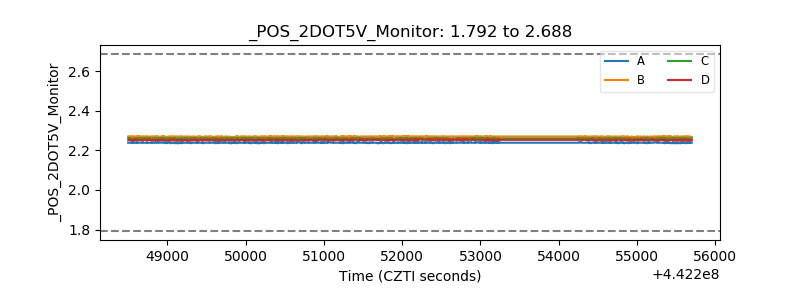 |
| +5 Volts monitor | 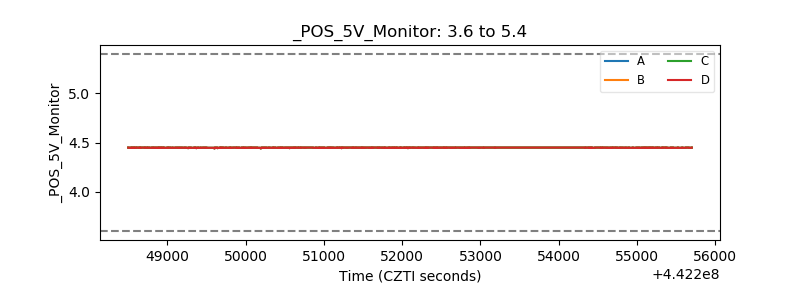 |
| _ROLL_ROT | 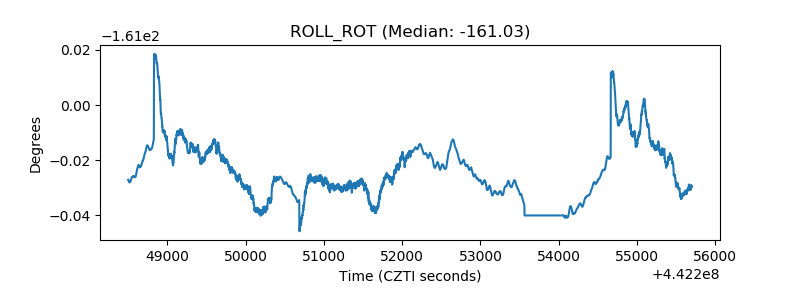 |
| _Roll_DEC | 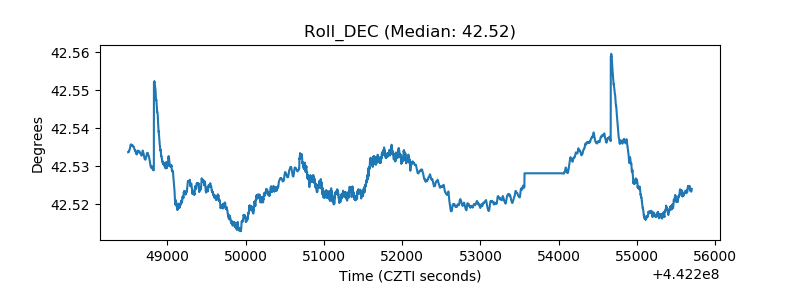 |
| _Roll_RA | 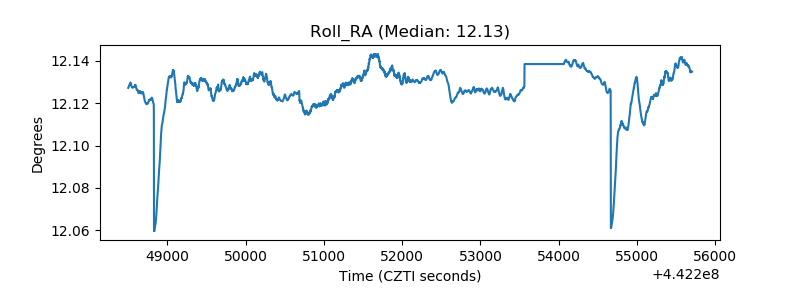 |
| Veto Counter | 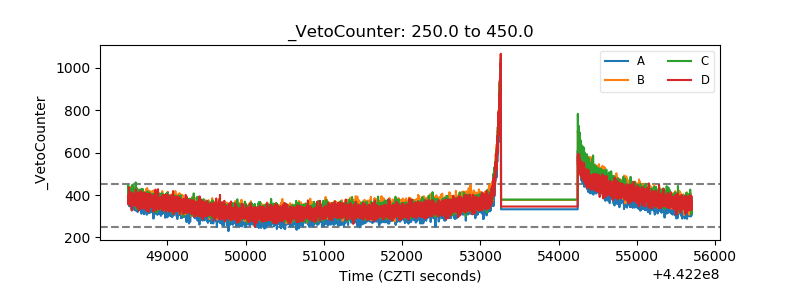 |