| Param | Original file | Final file |
|---|---|---|
| Filename | modeM0/AS1A13_004T11_9000006018_44747cztM0_level2.fits | modeM0/AS1A13_004T11_9000006018_44747cztM0_level2_quad_clean.evt |
| Size (bytes) | 617,391,360 | 101,583,360 |
| Size | 588.8 MB | 96.9 MB |
| Events in quadrant A | 6,526,864 | 710,758 |
| Events in quadrant B | 3,593,487 | 753,228 |
| Events in quadrant C | 3,297,045 | 725,472 |
| Events in quadrant D | 8,924,665 | 426,276 |
| Mode SS | |||
|---|---|---|---|
| Quadrant | BADHDUFLAG | Total packets | Discarded packets |
| A | 0 | 134 | 0 |
| B | 0 | 134 | 0 |
| C | 0 | 134 | 0 |
| D | 0 | 134 | 0 |
| Mode M0 | |||
|---|---|---|---|
| Quadrant | BADHDUFLAG | Total packets | Discarded packets |
| A | 0 | 24421 | 2 |
| B | 0 | 15198 | 2 |
| C | 0 | 14429 | 2 |
| D | 0 | 31202 | 4 |
| Mode M9 | |||
|---|---|---|---|
| Quadrant | BADHDUFLAG | Total packets | Discarded packets |
| A | 0 | 11 | 0 |
| B | 0 | 12 | 0 |
| C | 0 | 12 | 0 |
| D | 0 | 12 | 0 |
| Quadrant | Total seconds | Saturated seconds | Saturation percentage |
|---|---|---|---|
| A | 6595 | 520 | 7.884761% |
| B | 6595 | 159 | 2.410917% |
| C | 6595 | 89 | 1.349507% |
| D | 6594 | 2467 | 37.412800% |
Noise dominated data is calculated using 1-second bins in cleaned event files. If a bin has >2000 counts, and if more than 50% of those come from <1% of pixels, then it is considered to be noise-dominated and hence unusable.
| Quadrant | # 1 sec bins | Bins with >0 counts | Bins with >2000 counts | High rate bins dominated by noise | Noise dominated (total time) | Noise dominated (detector-on time) | Marked lightcurve |
|---|---|---|---|---|---|---|---|
| A | 7690 | 6596 | 318 | 318 | 4.14% | 4.82% | 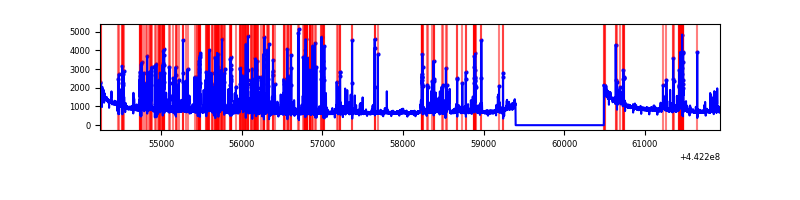 |
| B | 7690 | 6596 | 66 | 66 | 0.86% | 1.00% | 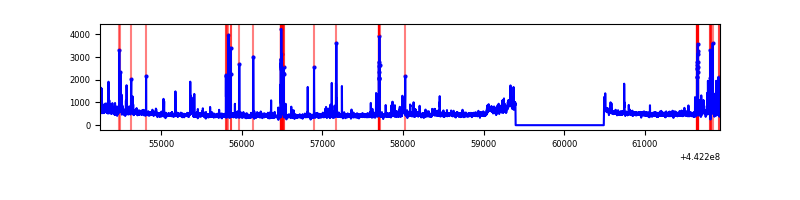 |
| C | 7690 | 6596 | 39 | 39 | 0.51% | 0.59% | 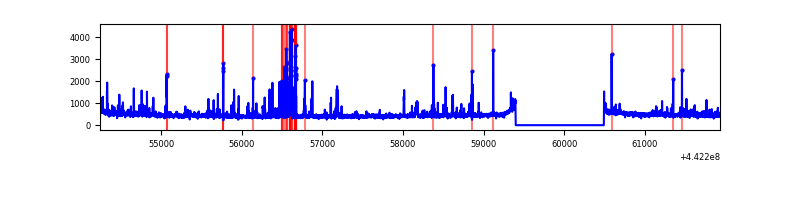 |
| D | 7689 | 6595 | 2063 | 2063 | 26.83% | 31.28% | 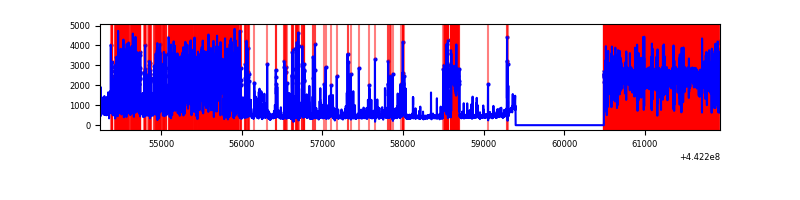 |
Top three noisy pixels from each quadrant. If the there are fewer than three noisy pixels in the level2.evt file, extra rows are filled as -1
| Pixel properties | Quadrant properties | ||||||
|---|---|---|---|---|---|---|---|
| Quadrant | DetID | PixID | Counts | Sigma | Mean | Median | Sigma |
| A | 10 | 83 | 2129786 | 14298.05 | 724 | 710 | 148.9 |
| A | 15 | 223 | 1465082 | 9834.16 | 724 | 710 | 148.9 |
| A | 13 | 248 | 117868 | 786.79 | 724 | 710 | 148.9 |
| B | 0 | 189 | 328101 | 2279.1 | 735 | 713 | 143.6 |
| B | 5 | 172 | 100689 | 695.98 | 735 | 713 | 143.6 |
| B | 0 | 219 | 56554 | 388.74 | 735 | 713 | 143.6 |
| C | 14 | 254 | 300272 | 1762.23 | 731 | 734 | 170.0 |
| C | 12 | 2 | 35968 | 207.29 | 731 | 734 | 170.0 |
| C | 3 | 233 | 33338 | 191.81 | 731 | 734 | 170.0 |
| D | 8 | 129 | 4883415 | 34281.78 | 558 | 538 | 142.4 |
| D | 13 | 249 | 723919 | 5078.73 | 558 | 538 | 142.4 |
| D | 1 | 52 | 455647 | 3195.24 | 558 | 538 | 142.4 |
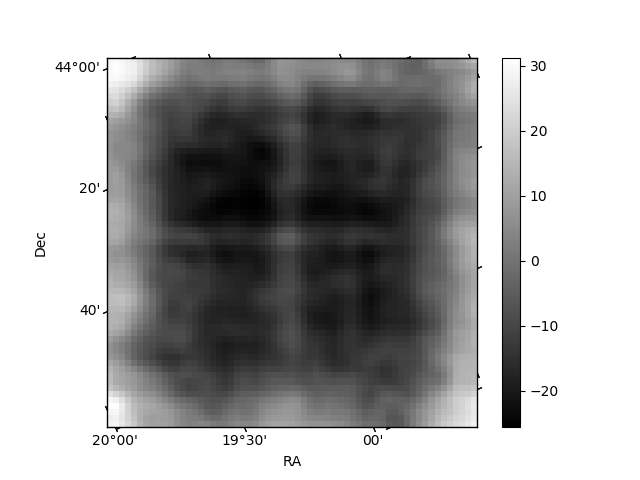
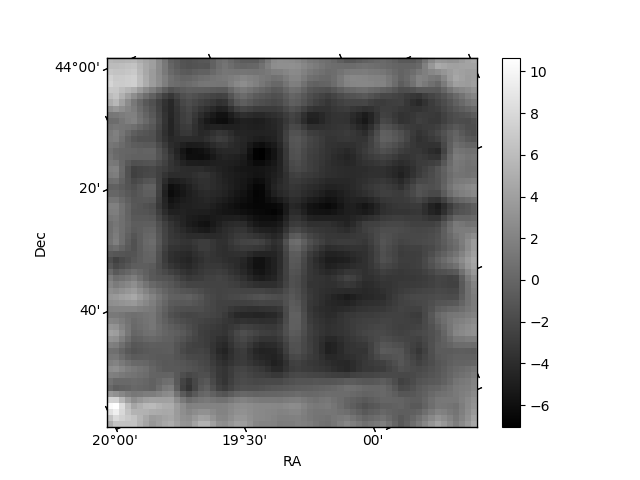
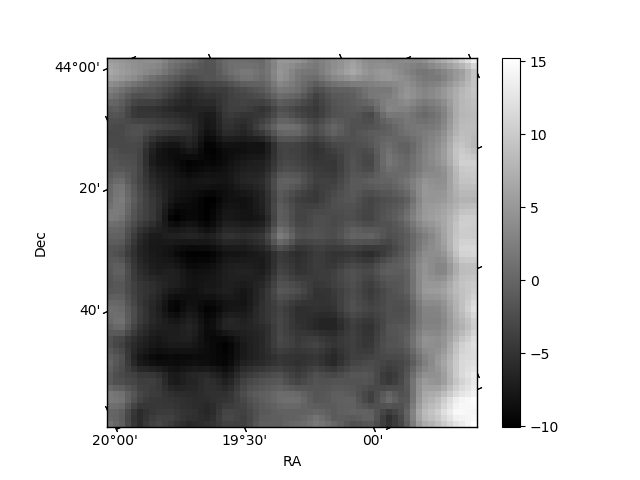
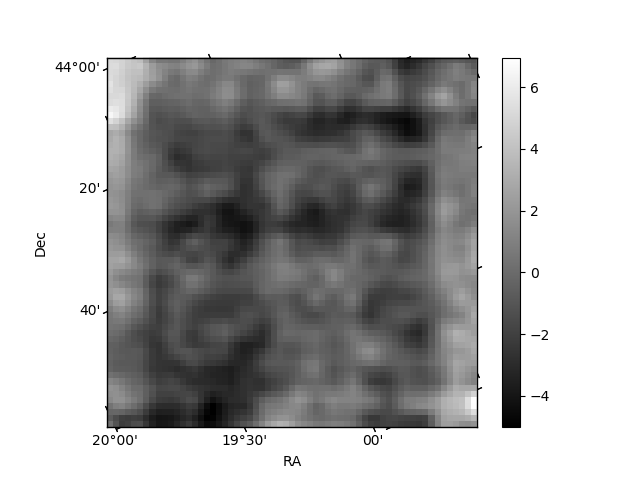
Histogram calculated using DETX and DETY for each event in the final _common_clean file
| Quadrant A | 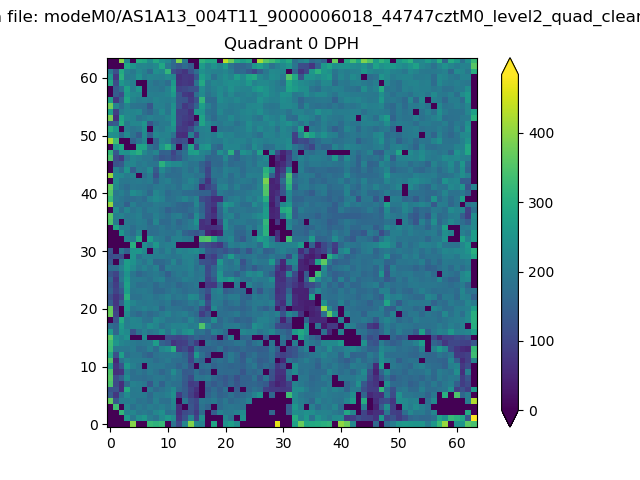 |
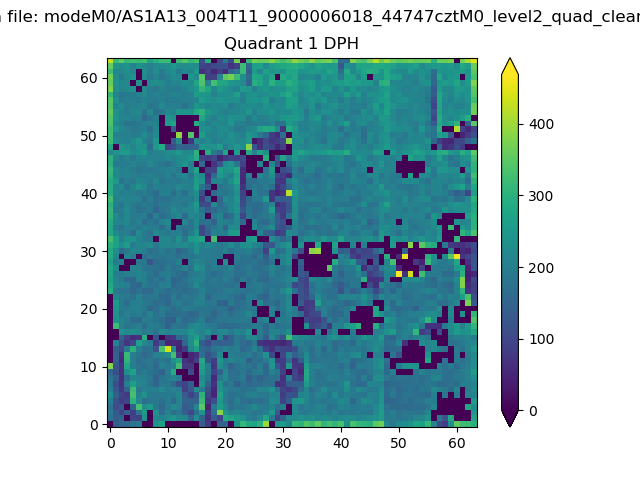 |
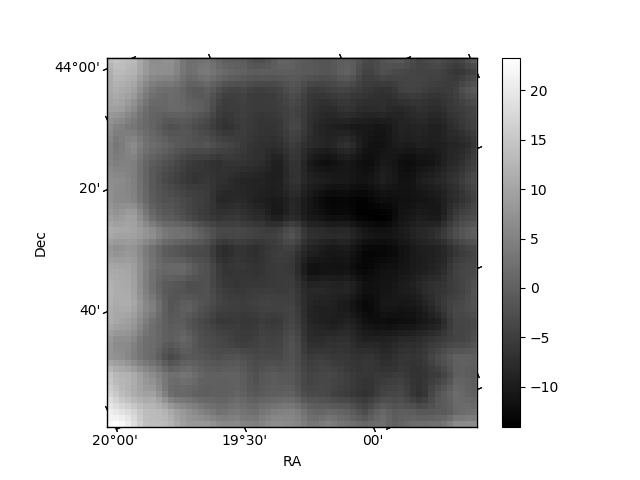
Quadrant B |
|---|---|---|---|
| Quadrant D | 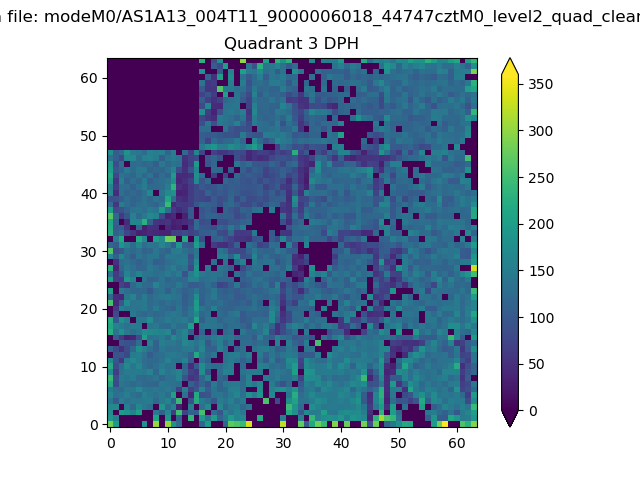 |
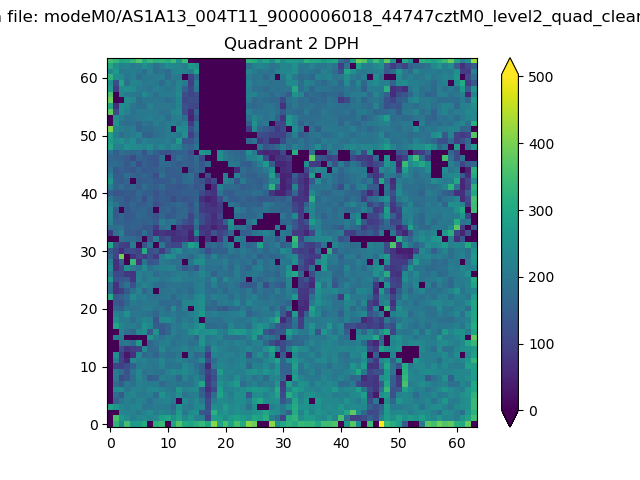 |
Quadrant C |
| Plot type | Count rate plots | Images |
|---|---|---|
| Comparison with Poisson distribution Blue bars denote a histogram of data divided into 1 sec bins. Red curve is a Poisson curve with rate = median count rate of data. |
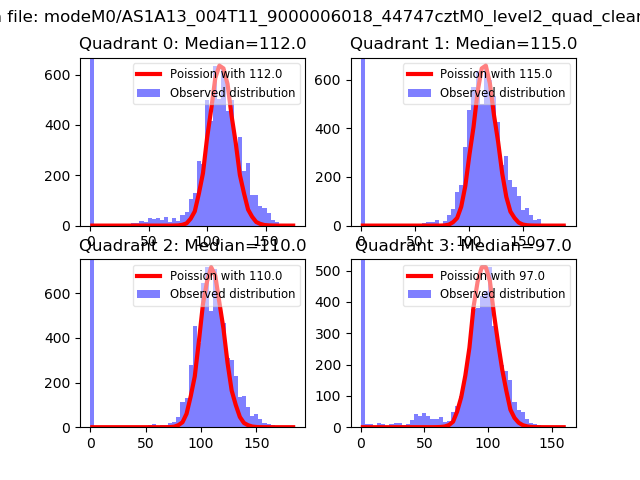 |
 |
| Quadrant-wise count rates Data is divided into 100 sec bins |
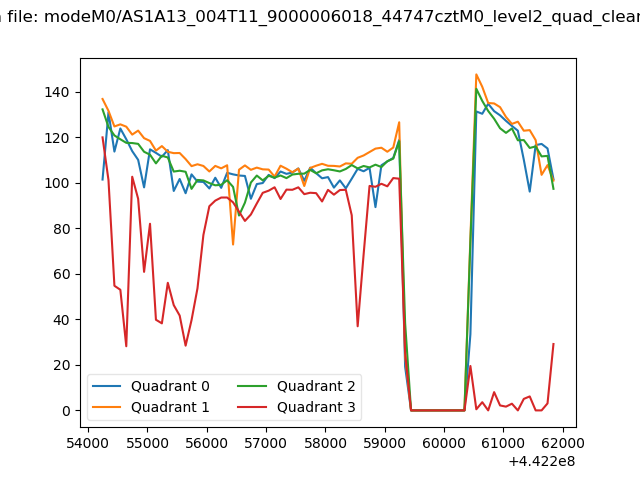 |
|
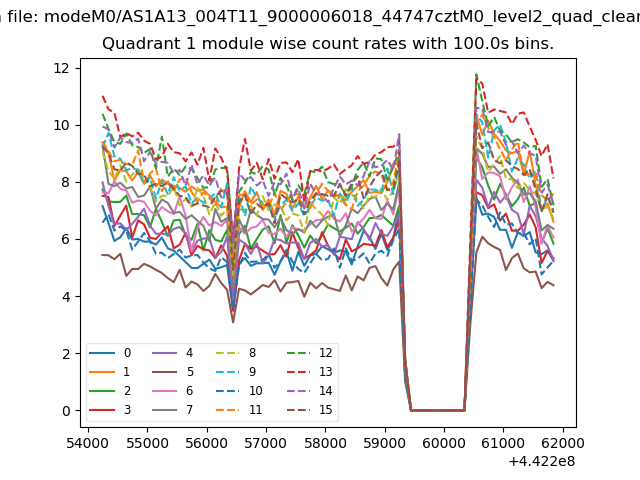
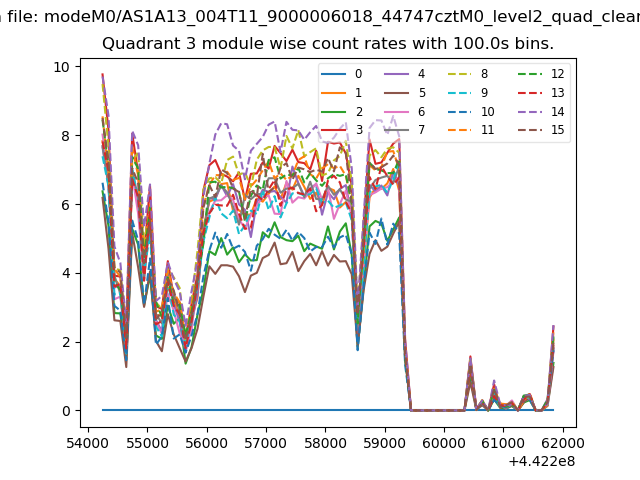
| Module-wise count rates for Quadrant A Data is divided into 100 sec bins |
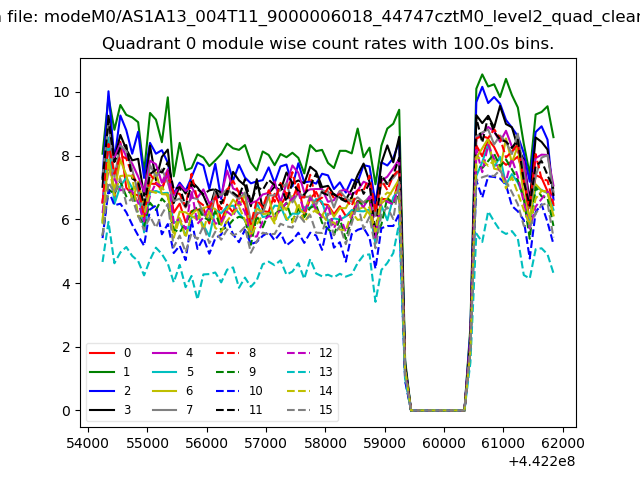 |
 |
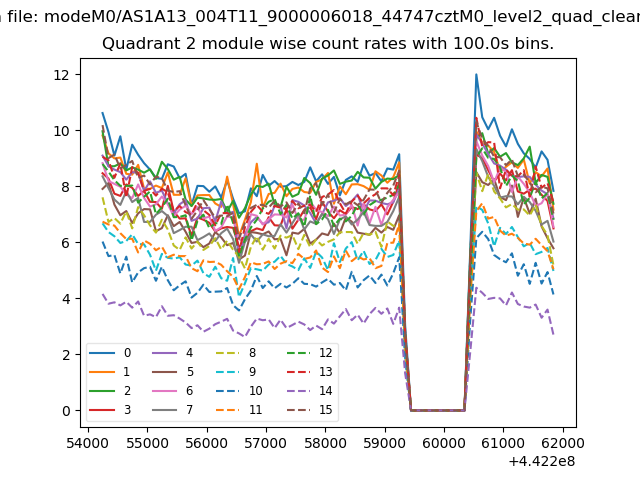
| Module-wise count rates for Quadrant B Data is divided into 100 sec bins |
 |
 |
| Module-wise count rates for Quadrant C Data is divided into 100 sec bins |
 |
 |
| Module-wise count rates for Quadrant D Data is divided into 100 sec bins |
 |
 |
| Parameter | Plot |
|---|---|
| CZT HV Monitor | 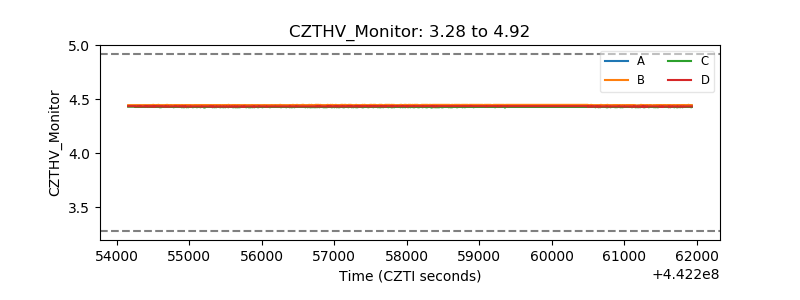 |
| D_VDD | 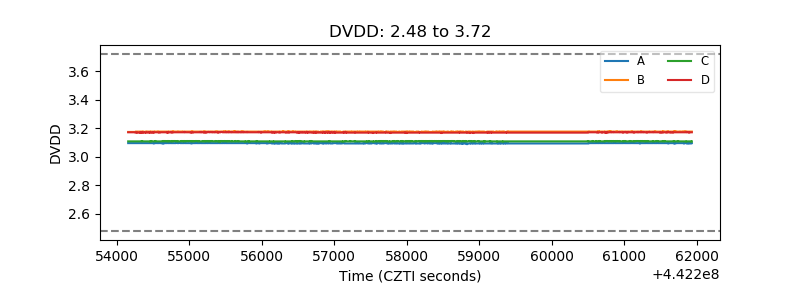 |
| Temperature 1 | 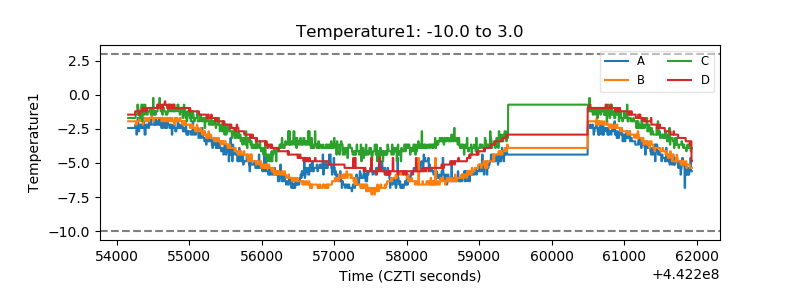 |
| Veto HV Monitor | 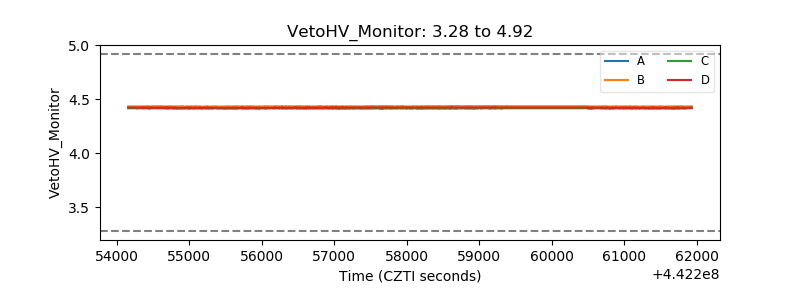 |
| Veto LLD | 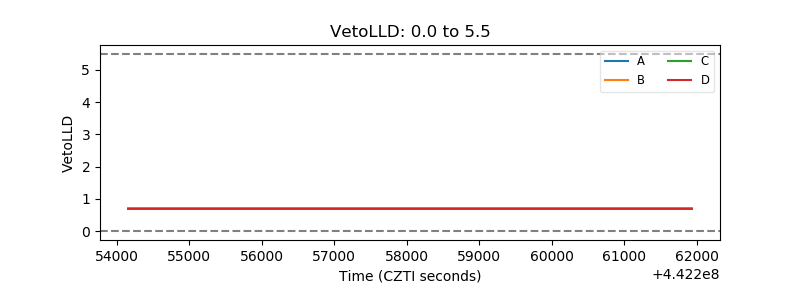 |
| Alpha Counter | 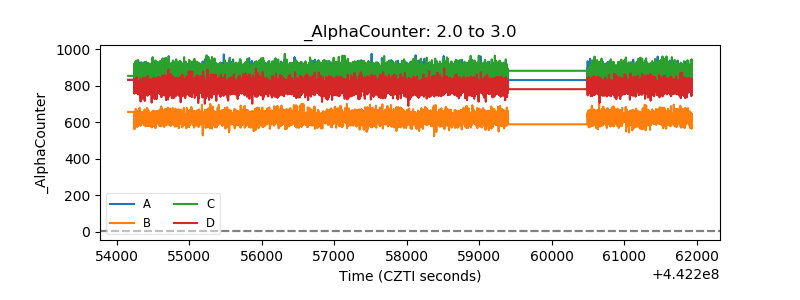 |
| _CPM_Rate | 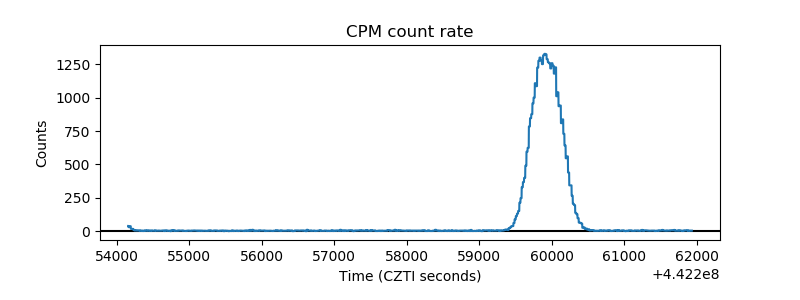 |
| CZT Counter | 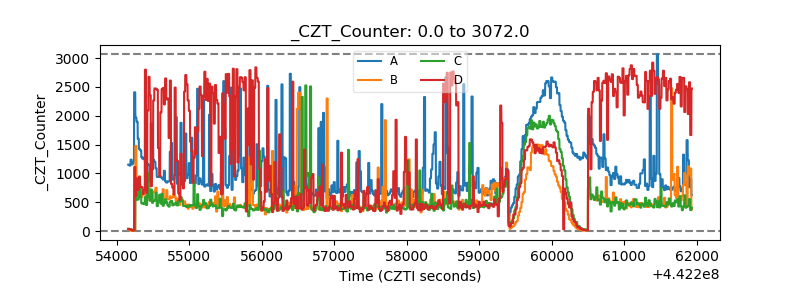 |
| +2.5 Volts monitor | 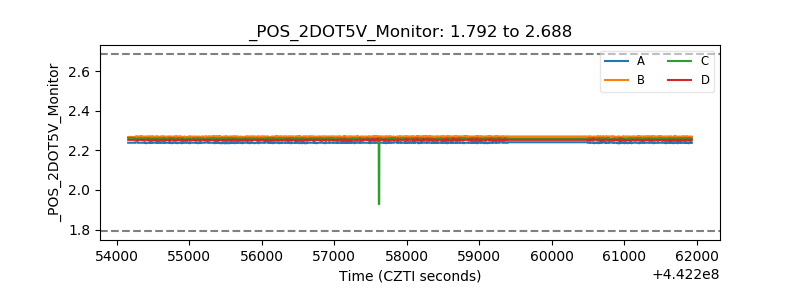 |
| +5 Volts monitor | 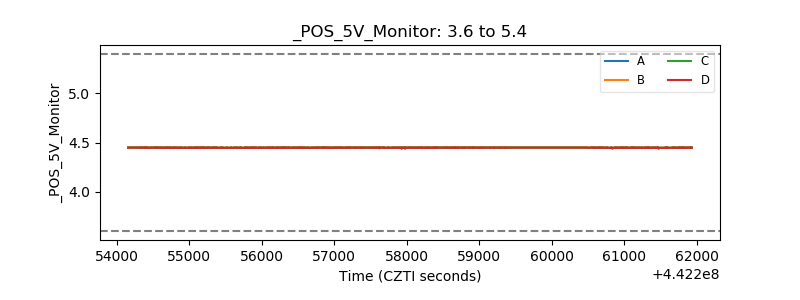 |
| _ROLL_ROT | 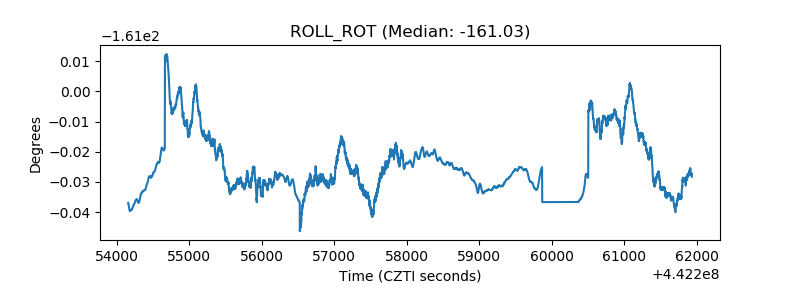 |
| _Roll_DEC | 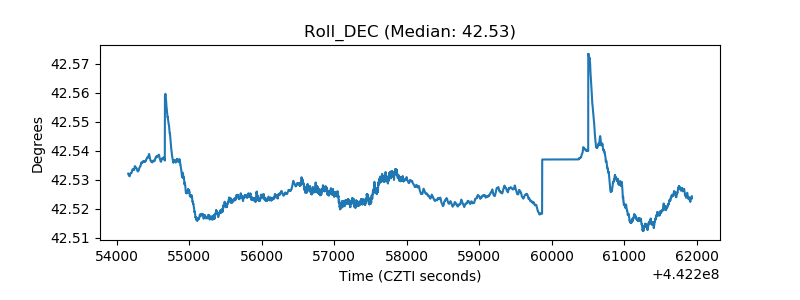 |
| _Roll_RA | 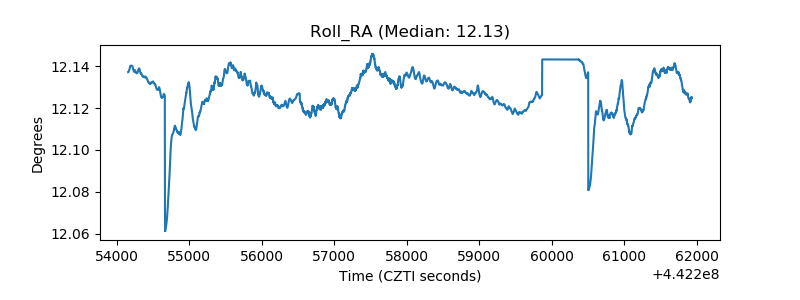 |
| Veto Counter | 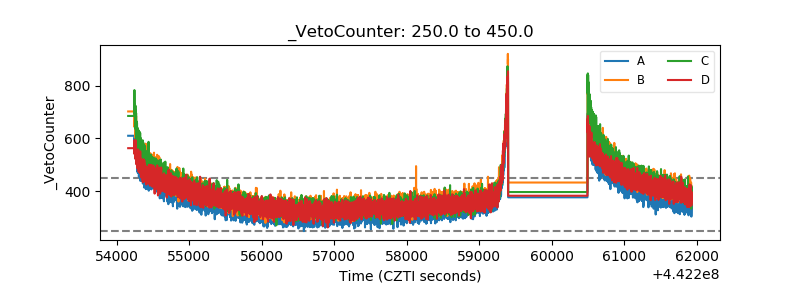 |