| Param | Original file | Final file |
|---|---|---|
| Filename | modeM0/AS1A13_004T11_9000006018_44748cztM0_level2.fits | modeM0/AS1A13_004T11_9000006018_44748cztM0_level2_quad_clean.evt |
| Size (bytes) | 627,180,480 | 98,127,360 |
| Size | 598.1 MB | 93.6 MB |
| Events in quadrant A | 5,637,644 | 709,276 |
| Events in quadrant B | 3,918,594 | 740,110 |
| Events in quadrant C | 3,091,694 | 725,818 |
| Events in quadrant D | 10,078,054 | 355,182 |
| Mode SS | |||
|---|---|---|---|
| Quadrant | BADHDUFLAG | Total packets | Discarded packets |
| A | 0 | 128 | 0 |
| B | 0 | 128 | 0 |
| C | 0 | 128 | 0 |
| D | 0 | 128 | 0 |
| Mode M0 | |||
|---|---|---|---|
| Quadrant | BADHDUFLAG | Total packets | Discarded packets |
| A | 0 | 21758 | 2 |
| B | 0 | 15799 | 2 |
| C | 0 | 13521 | 2 |
| D | 0 | 34315 | 2 |
| Mode M9 | |||
|---|---|---|---|
| Quadrant | BADHDUFLAG | Total packets | Discarded packets |
| A | 0 | 12 | 0 |
| B | 0 | 13 | 0 |
| C | 0 | 13 | 0 |
| D | 0 | 13 | 0 |
| Quadrant | Total seconds | Saturated seconds | Saturation percentage |
|---|---|---|---|
| A | 6317 | 333 | 5.271490% |
| B | 6317 | 222 | 3.514326% |
| C | 6317 | 49 | 0.775685% |
| D | 6317 | 2982 | 47.205952% |
Noise dominated data is calculated using 1-second bins in cleaned event files. If a bin has >2000 counts, and if more than 50% of those come from <1% of pixels, then it is considered to be noise-dominated and hence unusable.
| Quadrant | # 1 sec bins | Bins with >0 counts | Bins with >2000 counts | High rate bins dominated by noise | Noise dominated (total time) | Noise dominated (detector-on time) | Marked lightcurve |
|---|---|---|---|---|---|---|---|
| A | 7502 | 6318 | 158 | 158 | 2.11% | 2.50% | 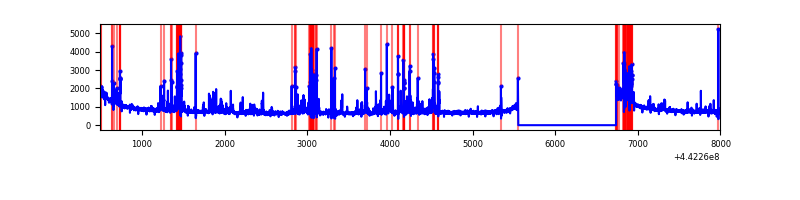 |
| B | 7502 | 6318 | 121 | 121 | 1.61% | 1.92% | 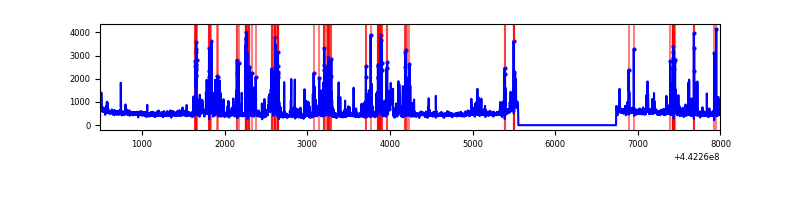 |
| C | 7502 | 6318 | 17 | 17 | 0.23% | 0.27% | 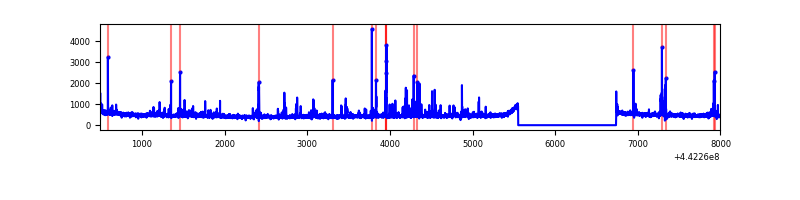 |
| D | 7502 | 6318 | 2530 | 2530 | 33.72% | 40.04% | 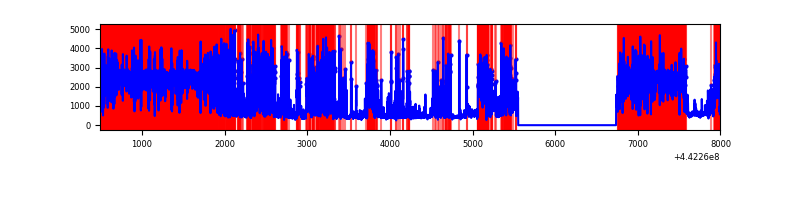 |
Top three noisy pixels from each quadrant. If the there are fewer than three noisy pixels in the level2.evt file, extra rows are filled as -1
| Pixel properties | Quadrant properties | ||||||
|---|---|---|---|---|---|---|---|
| Quadrant | DetID | PixID | Counts | Sigma | Mean | Median | Sigma |
| A | 10 | 83 | 2037780 | 14011.34 | 707 | 692 | 145.4 |
| A | 15 | 223 | 654756 | 4498.73 | 707 | 692 | 145.4 |
| A | 13 | 248 | 210858 | 1445.54 | 707 | 692 | 145.4 |
| B | 0 | 189 | 519053 | 3711.66 | 716 | 694 | 139.7 |
| B | 5 | 255 | 146929 | 1047.1 | 716 | 694 | 139.7 |
| B | 5 | 172 | 144224 | 1027.73 | 716 | 694 | 139.7 |
| C | 14 | 254 | 180988 | 1073.42 | 719 | 722 | 167.9 |
| C | 12 | 2 | 39216 | 229.22 | 719 | 722 | 167.9 |
| C | 1 | 3 | 25744 | 149.0 | 719 | 722 | 167.9 |
| D | 8 | 129 | 4465322 | 36268.89 | 484 | 468 | 123.1 |
| D | 1 | 52 | 2521188 | 20476.31 | 484 | 468 | 123.1 |
| D | 1 | 47 | 513630 | 4168.52 | 484 | 468 | 123.1 |
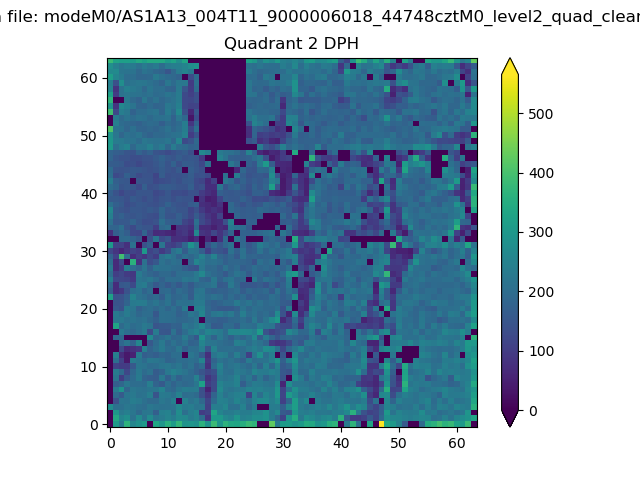
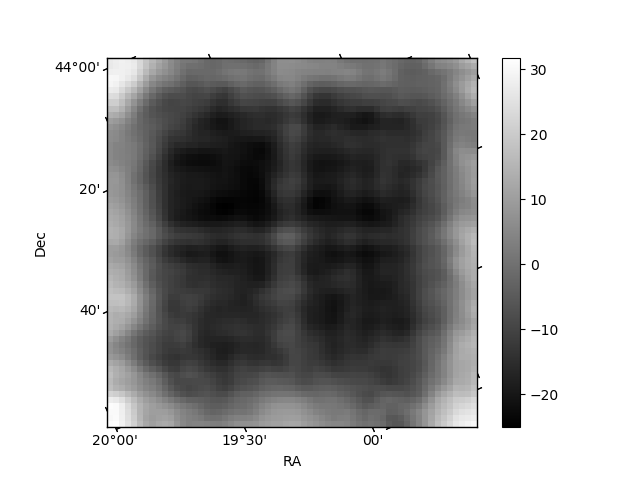
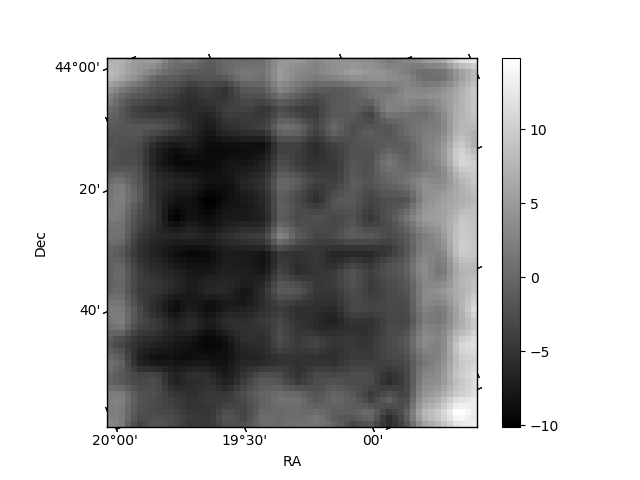
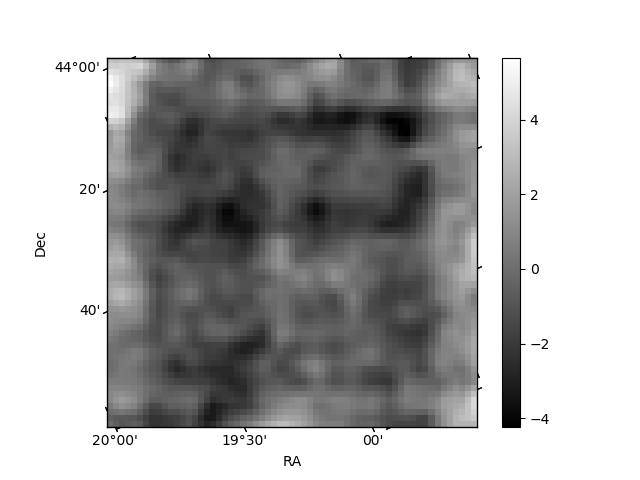
Histogram calculated using DETX and DETY for each event in the final _common_clean file
| Quadrant A | 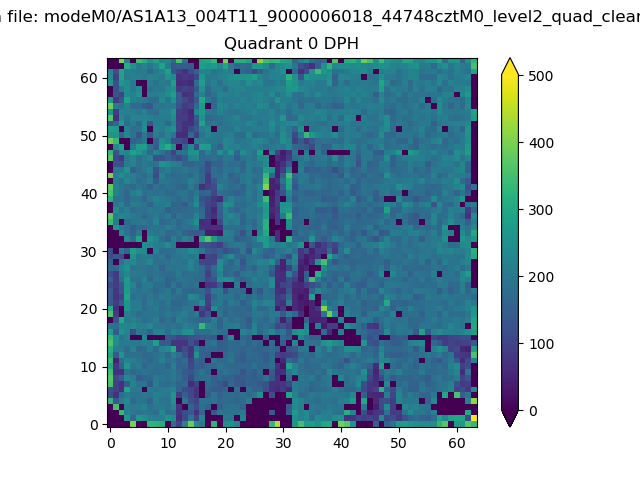 |
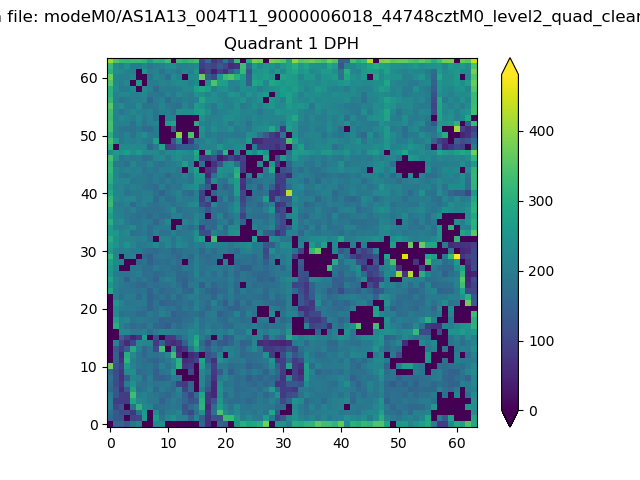 |
Quadrant B |
|---|---|---|---|
| Quadrant D | 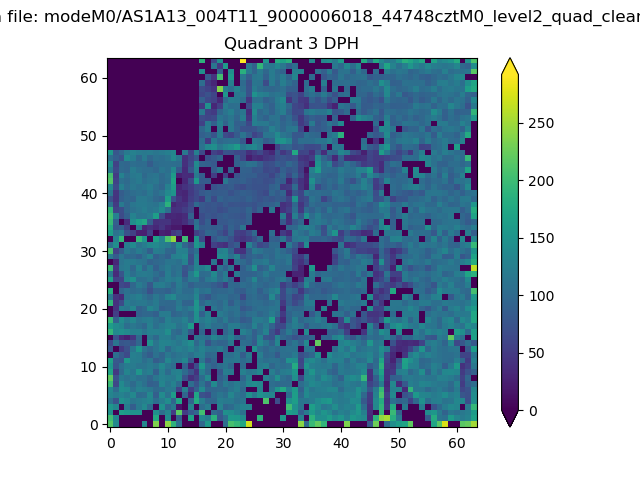 |
 |
Quadrant C |
| Plot type | Count rate plots | Images |
|---|---|---|
| Comparison with Poisson distribution Blue bars denote a histogram of data divided into 1 sec bins. Red curve is a Poisson curve with rate = median count rate of data. |
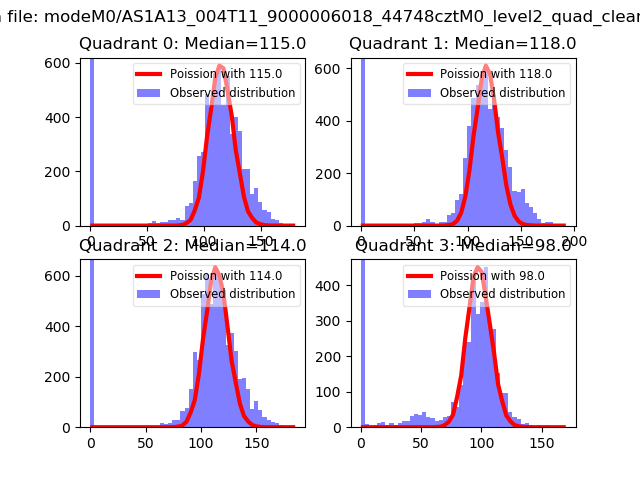 |
 |
| Quadrant-wise count rates Data is divided into 100 sec bins |
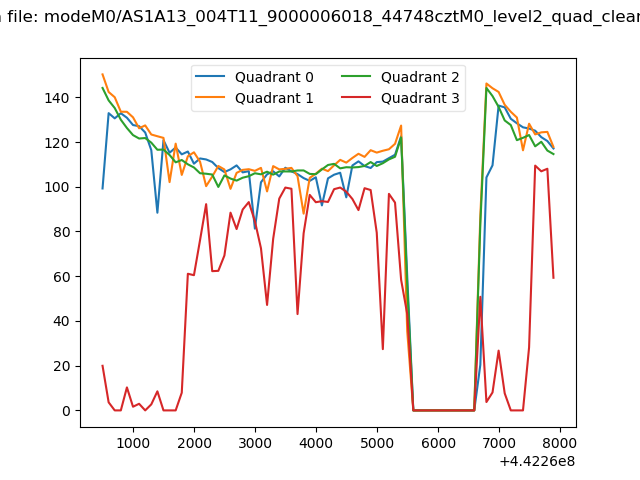 |
|
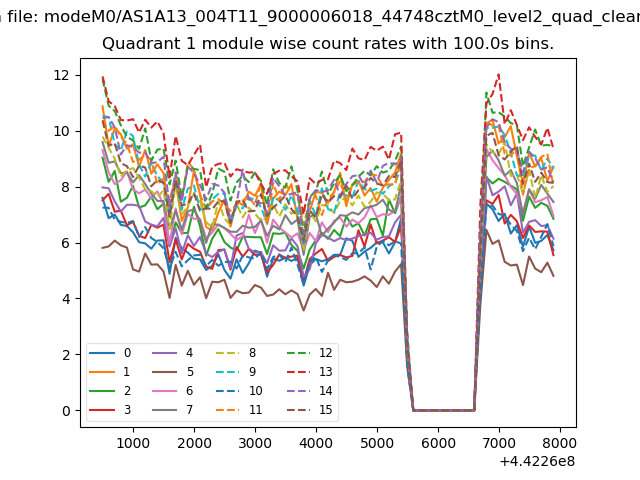
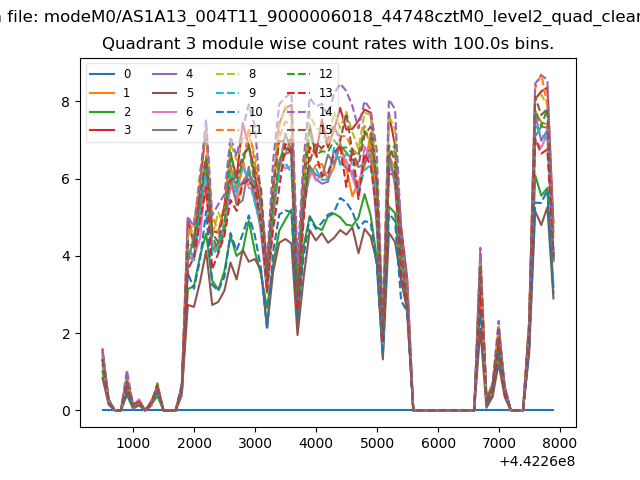
| Module-wise count rates for Quadrant A Data is divided into 100 sec bins |
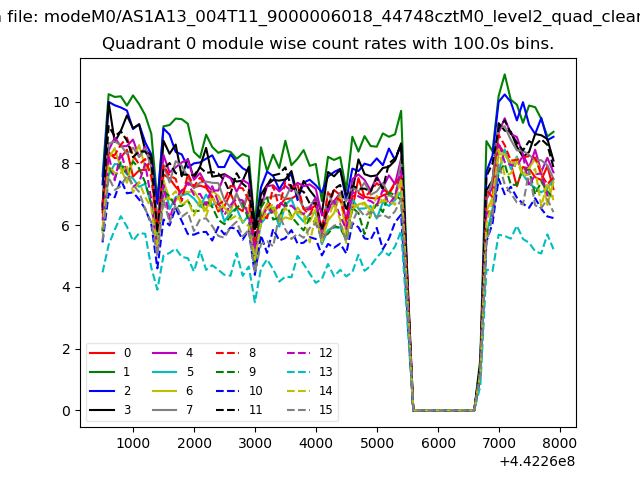 |
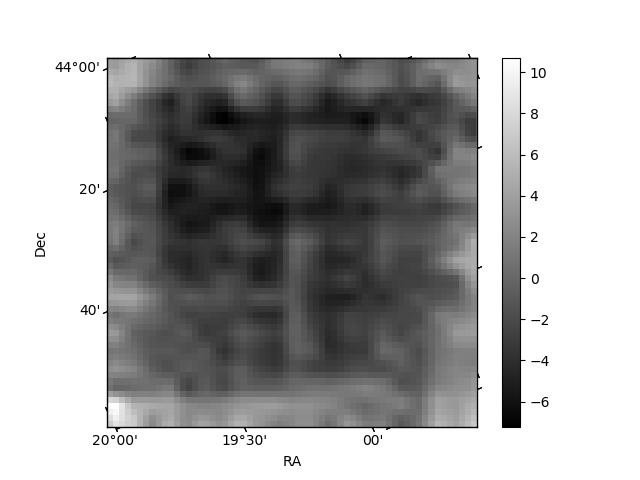 |
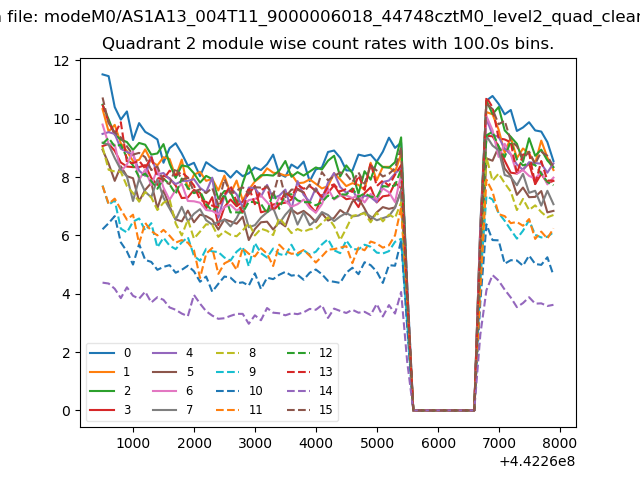
| Module-wise count rates for Quadrant B Data is divided into 100 sec bins |
 |
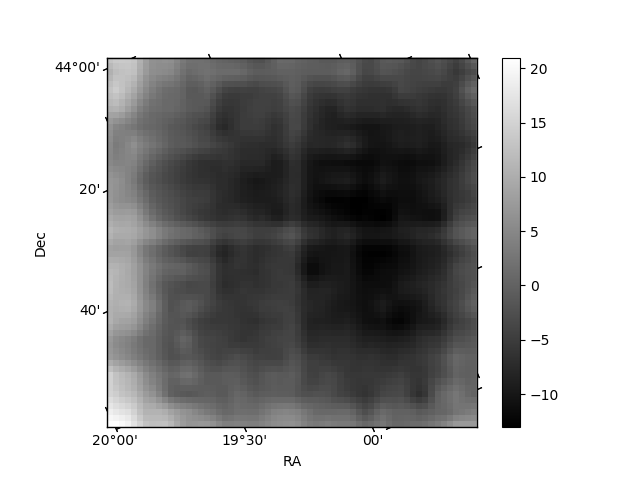 |
| Module-wise count rates for Quadrant C Data is divided into 100 sec bins |
 |
 |
| Module-wise count rates for Quadrant D Data is divided into 100 sec bins |
 |
 |
| Parameter | Plot |
|---|---|
| CZT HV Monitor |  |
| D_VDD | 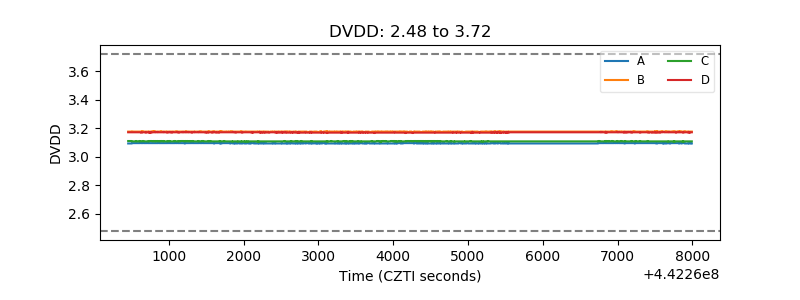 |
| Temperature 1 | 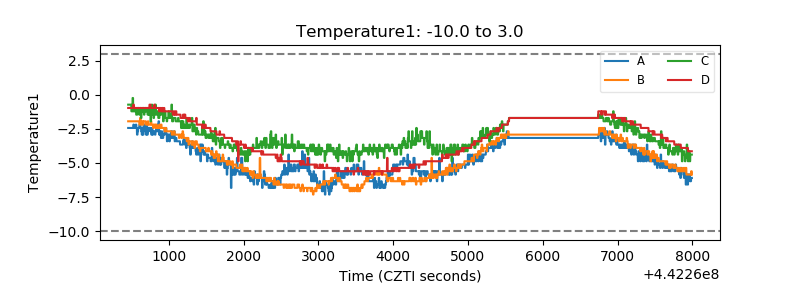 |
| Veto HV Monitor | 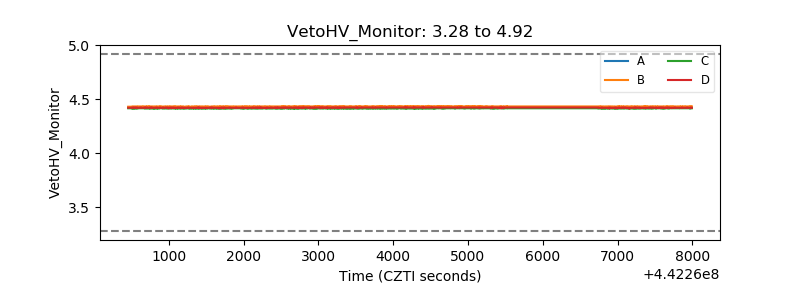 |
| Veto LLD | 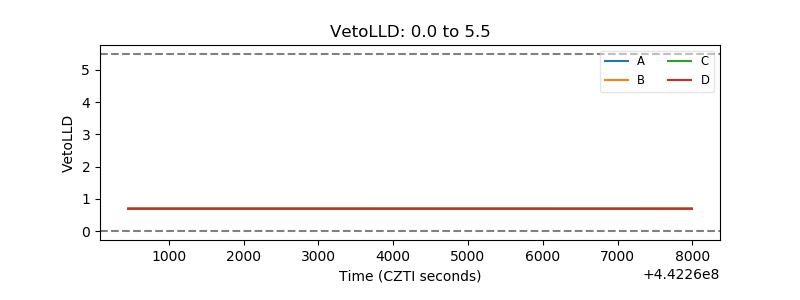 |
| Alpha Counter | 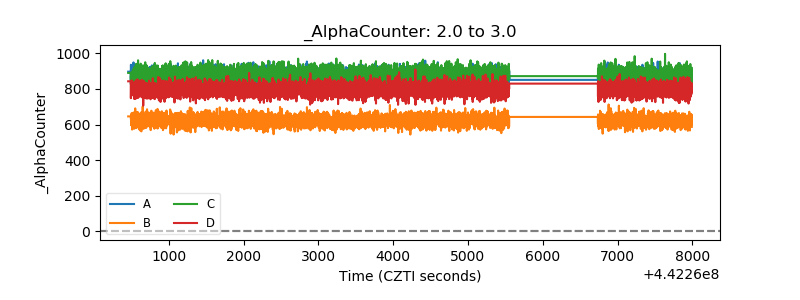 |
| _CPM_Rate | 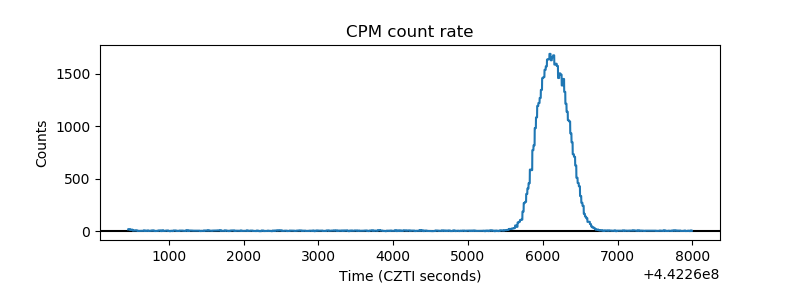 |
| CZT Counter | 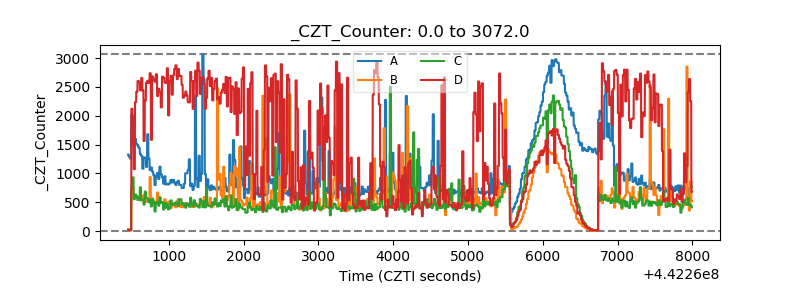 |
| +2.5 Volts monitor | 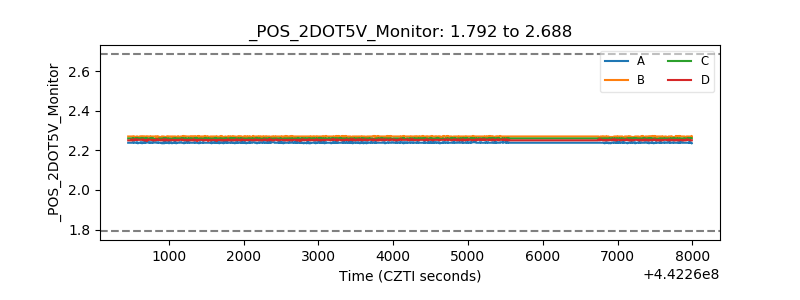 |
| +5 Volts monitor | 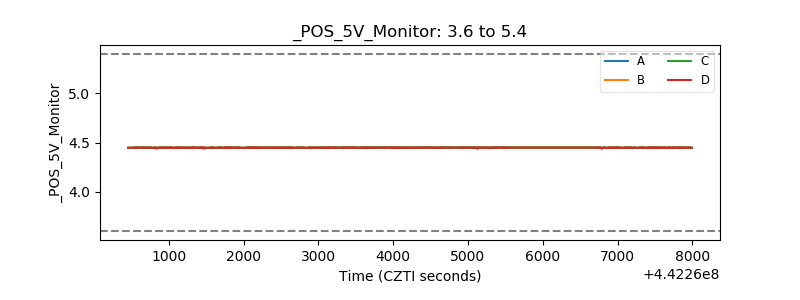 |
| _ROLL_ROT | 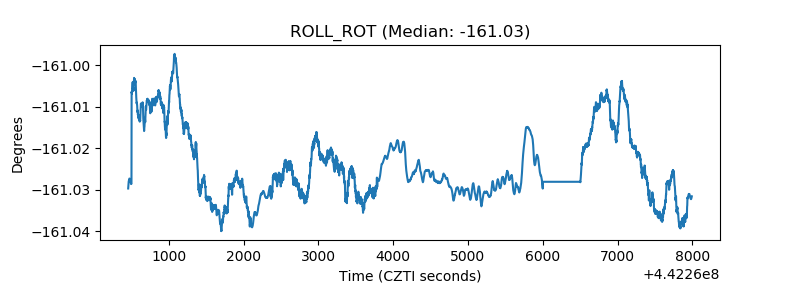 |
| _Roll_DEC | 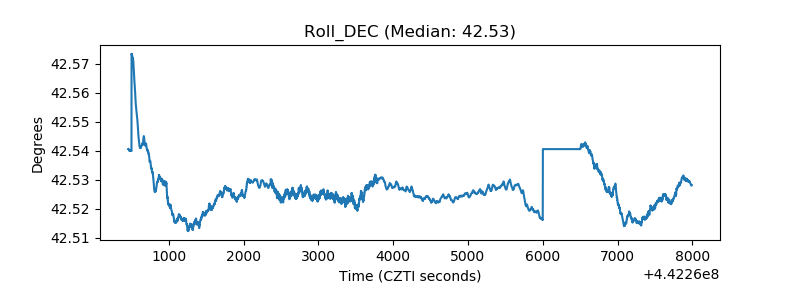 |
| _Roll_RA | 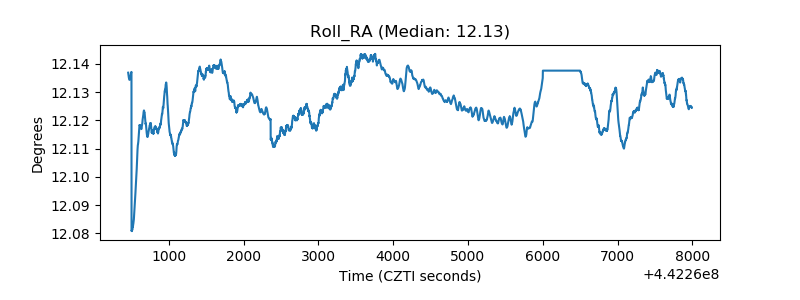 |
| Veto Counter | 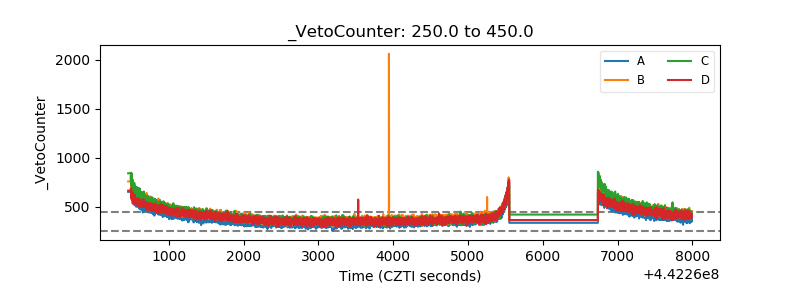 |