| Param | Original file | Final file |
|---|---|---|
| Filename | modeM0/AS1A13_004T11_9000006018_44749cztM0_level2.fits | modeM0/AS1A13_004T11_9000006018_44749cztM0_level2_quad_clean.evt |
| Size (bytes) | 573,782,400 | 101,868,480 |
| Size | 547.2 MB | 97.1 MB |
| Events in quadrant A | 6,045,224 | 691,695 |
| Events in quadrant B | 3,609,960 | 760,874 |
| Events in quadrant C | 3,032,838 | 735,095 |
| Events in quadrant D | 8,061,880 | 456,546 |
| Mode SS | |||
|---|---|---|---|
| Quadrant | BADHDUFLAG | Total packets | Discarded packets |
| A | 0 | 128 | 0 |
| B | 0 | 128 | 0 |
| C | 0 | 128 | 0 |
| D | 0 | 128 | 0 |
| Mode M0 | |||
|---|---|---|---|
| Quadrant | BADHDUFLAG | Total packets | Discarded packets |
| A | 0 | 23095 | 2 |
| B | 0 | 15035 | 2 |
| C | 0 | 13350 | 2 |
| D | 0 | 28299 | 2 |
| Mode M9 | |||
|---|---|---|---|
| Quadrant | BADHDUFLAG | Total packets | Discarded packets |
| A | 0 | 14 | 0 |
| B | 0 | 15 | 0 |
| C | 0 | 15 | 0 |
| D | 0 | 15 | 0 |
| Quadrant | Total seconds | Saturated seconds | Saturation percentage |
|---|---|---|---|
| A | 6310 | 580 | 9.191759% |
| B | 6309 | 130 | 2.060548% |
| C | 6309 | 35 | 0.554763% |
| D | 6309 | 1969 | 31.209383% |
Noise dominated data is calculated using 1-second bins in cleaned event files. If a bin has >2000 counts, and if more than 50% of those come from <1% of pixels, then it is considered to be noise-dominated and hence unusable.
| Quadrant | # 1 sec bins | Bins with >0 counts | Bins with >2000 counts | High rate bins dominated by noise | Noise dominated (total time) | Noise dominated (detector-on time) | Marked lightcurve |
|---|---|---|---|---|---|---|---|
| A | 7555 | 6311 | 402 | 402 | 5.32% | 6.37% | 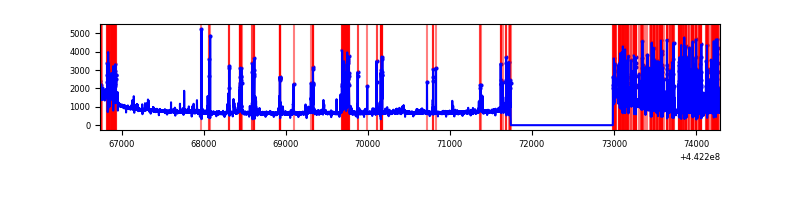 |
| B | 7554 | 6310 | 76 | 76 | 1.01% | 1.20% | 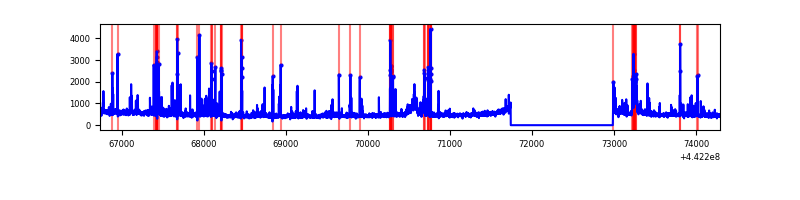 |
| C | 7554 | 6310 | 21 | 21 | 0.28% | 0.33% | 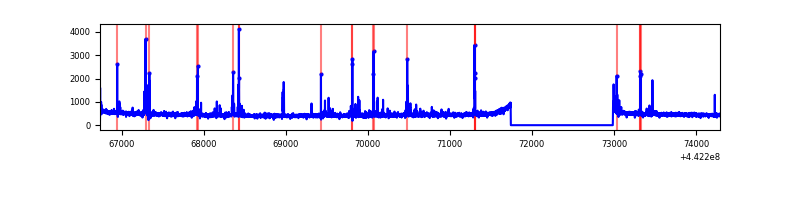 |
| D | 7554 | 6310 | 1700 | 1700 | 22.50% | 26.94% | 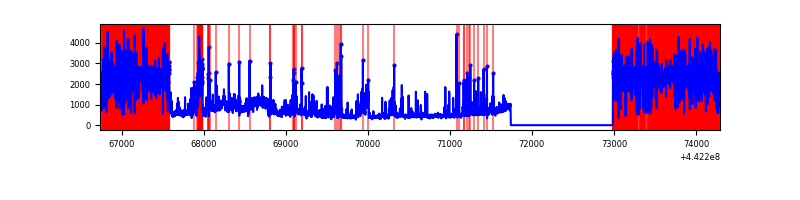 |
Top three noisy pixels from each quadrant. If the there are fewer than three noisy pixels in the level2.evt file, extra rows are filled as -1
| Pixel properties | Quadrant properties | ||||||
|---|---|---|---|---|---|---|---|
| Quadrant | DetID | PixID | Counts | Sigma | Mean | Median | Sigma |
| A | 10 | 83 | 1969260 | 13701.68 | 697 | 682 | 143.7 |
| A | 15 | 223 | 1223949 | 8514.17 | 697 | 682 | 143.7 |
| A | 13 | 248 | 155545 | 1077.88 | 697 | 682 | 143.7 |
| B | 5 | 255 | 307470 | 2181.29 | 723 | 702 | 140.6 |
| B | 0 | 189 | 202662 | 1436.05 | 723 | 702 | 140.6 |
| B | 0 | 155 | 63083 | 443.56 | 723 | 702 | 140.6 |
| C | 14 | 254 | 88435 | 516.24 | 723 | 728 | 169.9 |
| C | 12 | 2 | 67579 | 393.49 | 723 | 728 | 169.9 |
| C | 1 | 3 | 45079 | 261.05 | 723 | 728 | 169.9 |
| D | 8 | 129 | 4018020 | 28230.99 | 557 | 539 | 142.3 |
| D | 9 | 49 | 1031711 | 7246.08 | 557 | 539 | 142.3 |
| D | 5 | 222 | 230422 | 1615.4 | 557 | 539 | 142.3 |
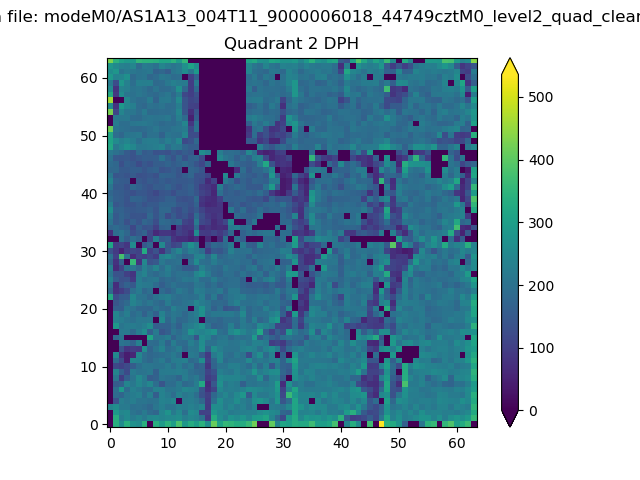
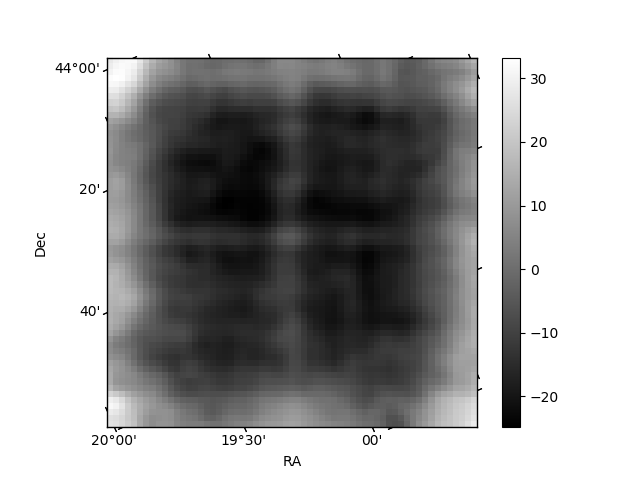
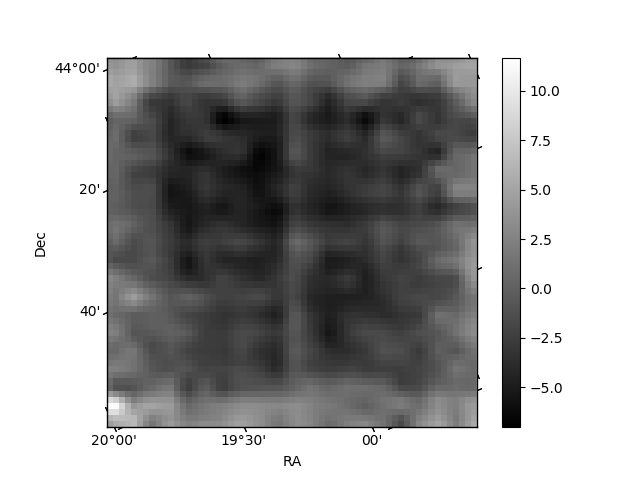
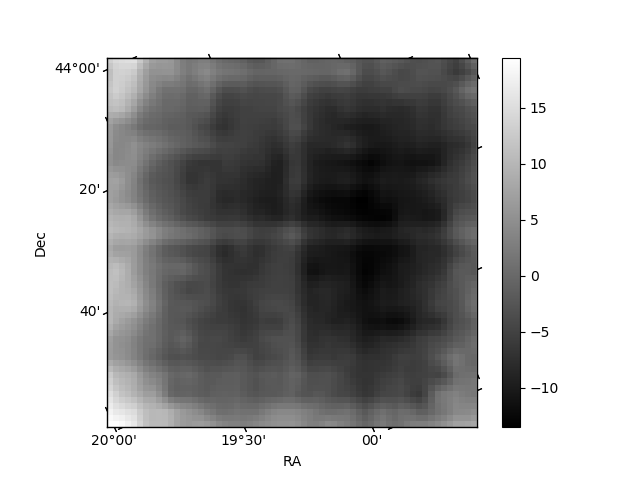
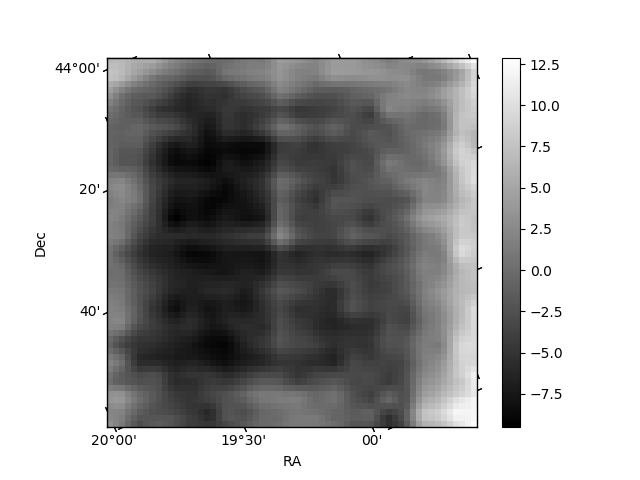
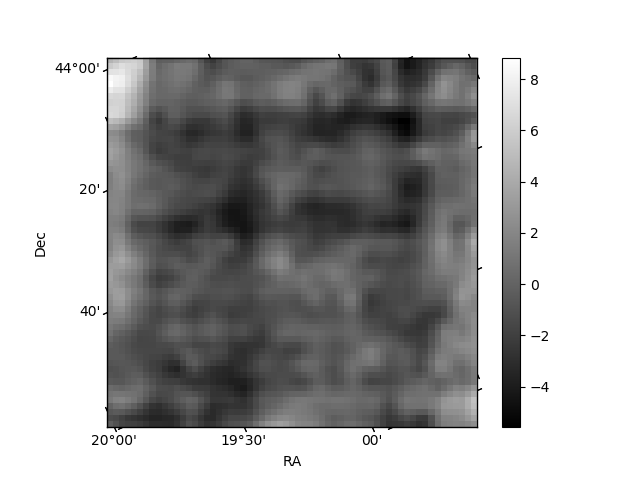
Histogram calculated using DETX and DETY for each event in the final _common_clean file
| Quadrant A | 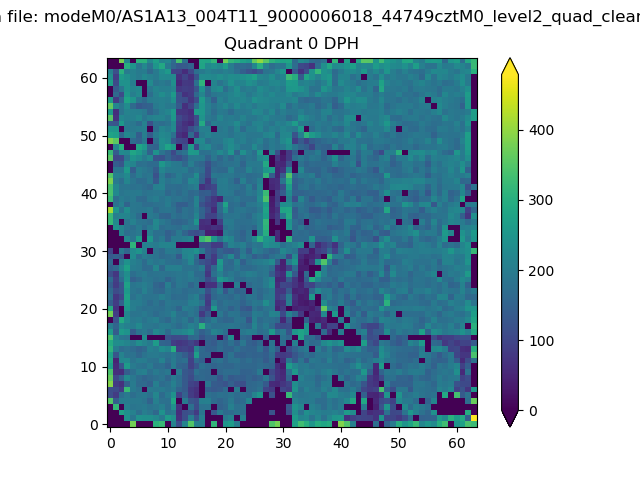 |
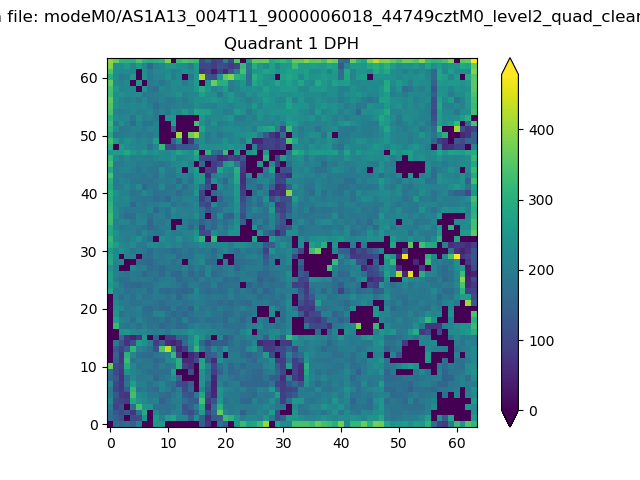 |
Quadrant B |
|---|---|---|---|
| Quadrant D | 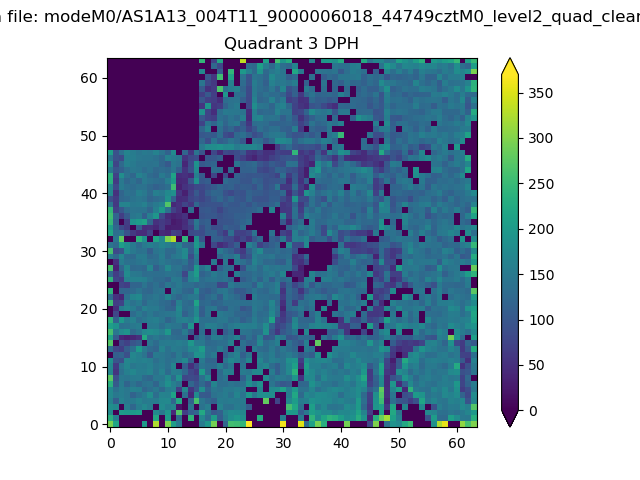 |
 |
Quadrant C |
| Plot type | Count rate plots | Images |
|---|---|---|
| Comparison with Poisson distribution Blue bars denote a histogram of data divided into 1 sec bins. Red curve is a Poisson curve with rate = median count rate of data. |
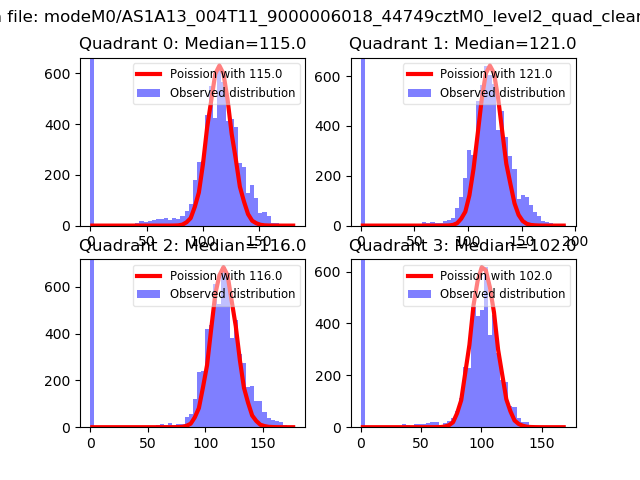 |
 |
| Quadrant-wise count rates Data is divided into 100 sec bins |
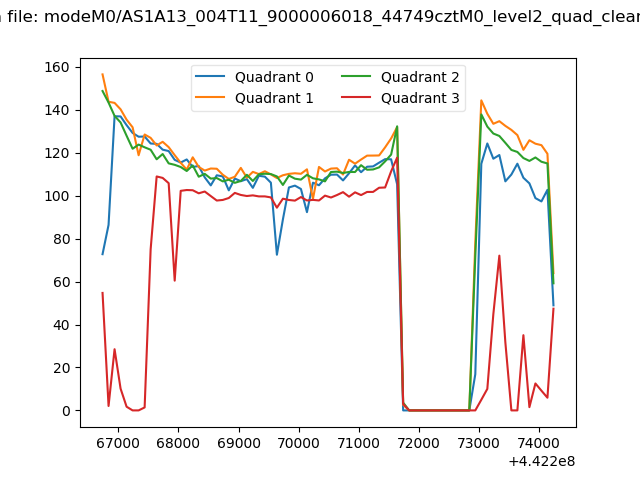 |
|
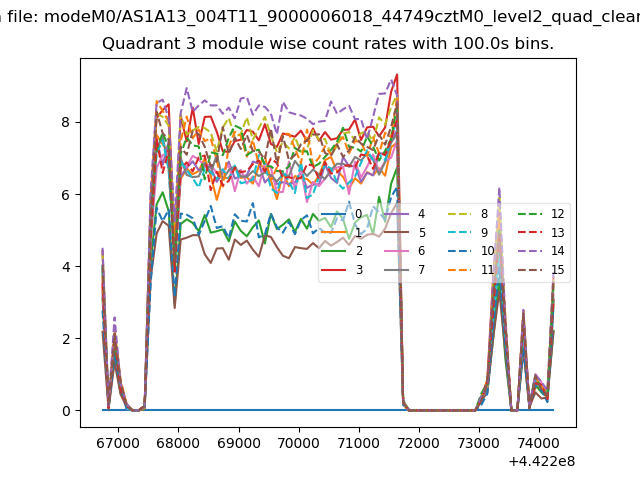
| Module-wise count rates for Quadrant A Data is divided into 100 sec bins |
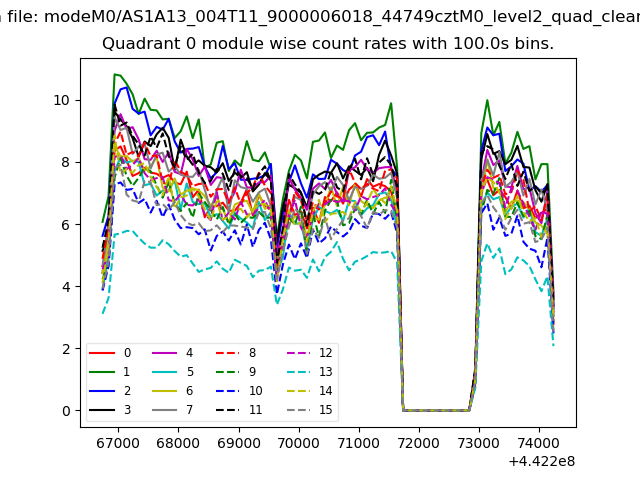 |
 |
| Module-wise count rates for Quadrant B Data is divided into 100 sec bins |
 |
 |
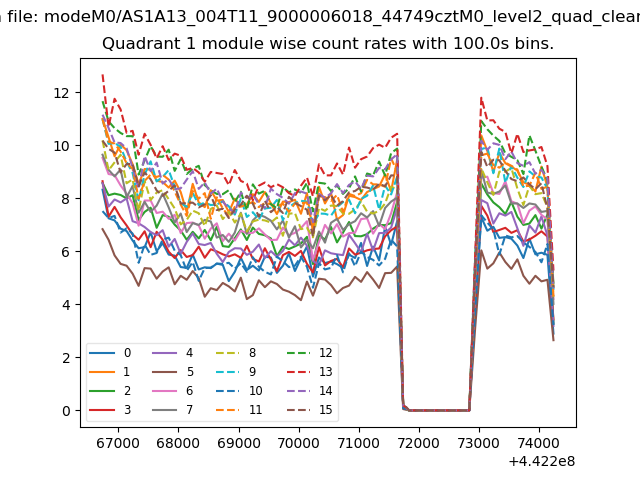
| Module-wise count rates for Quadrant C Data is divided into 100 sec bins |
 |
 |
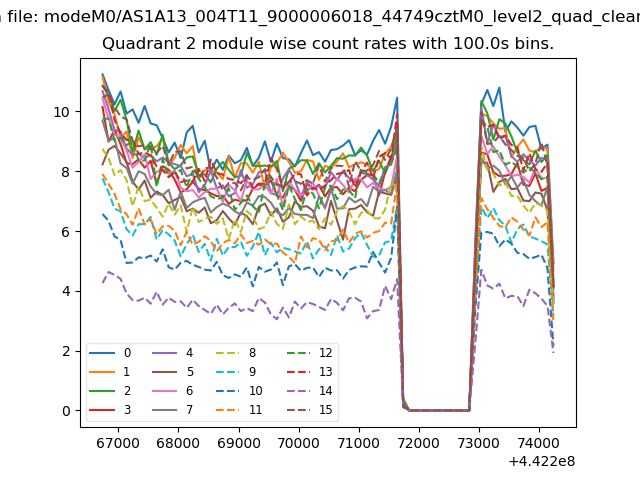
| Module-wise count rates for Quadrant D Data is divided into 100 sec bins |
 |
 |
| Parameter | Plot |
|---|---|
| CZT HV Monitor | 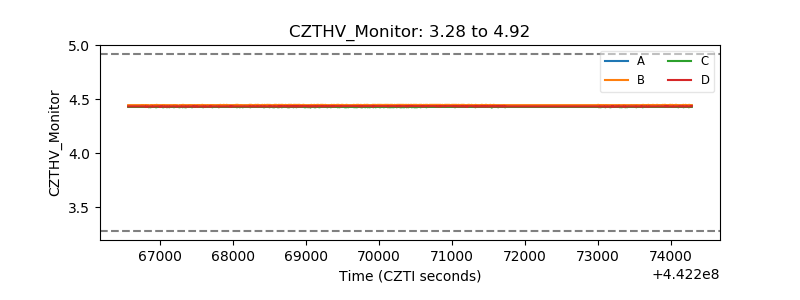 |
| D_VDD | 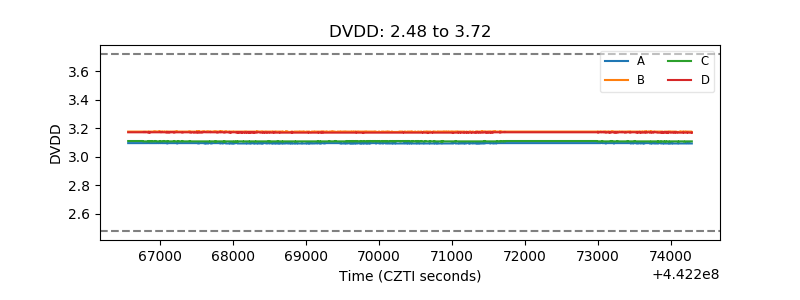 |
| Temperature 1 | 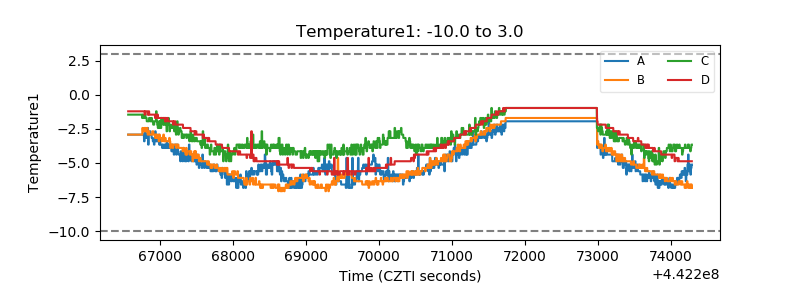 |
| Veto HV Monitor | 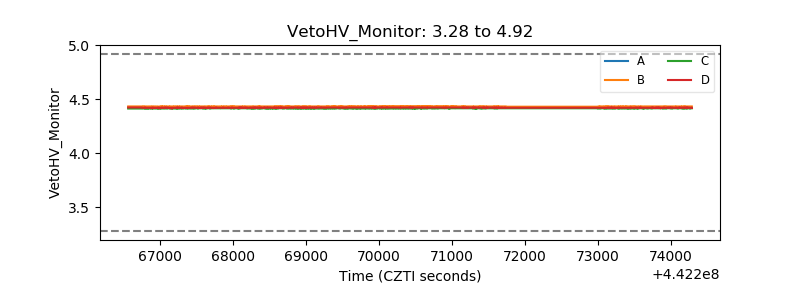 |
| Veto LLD | 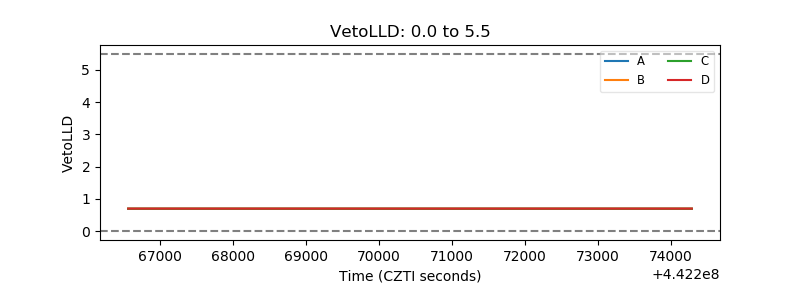 |
| Alpha Counter | 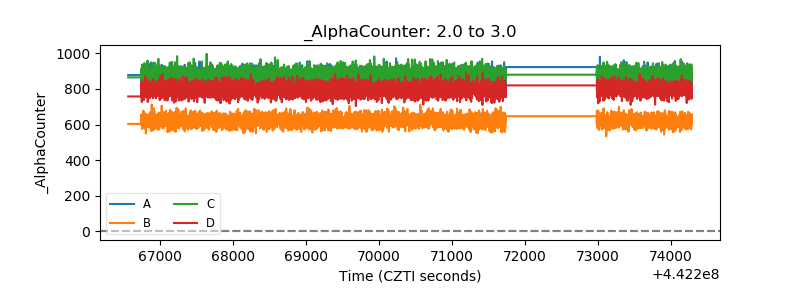 |
| _CPM_Rate | 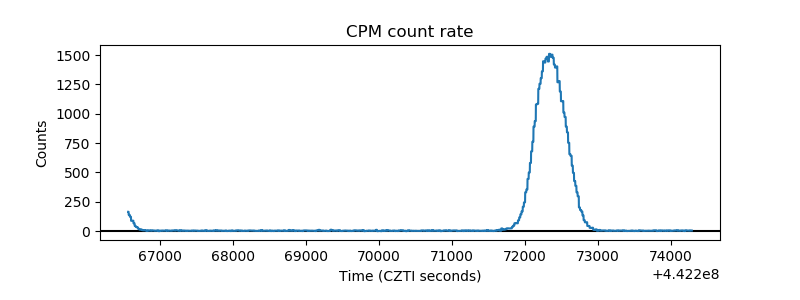 |
| CZT Counter | 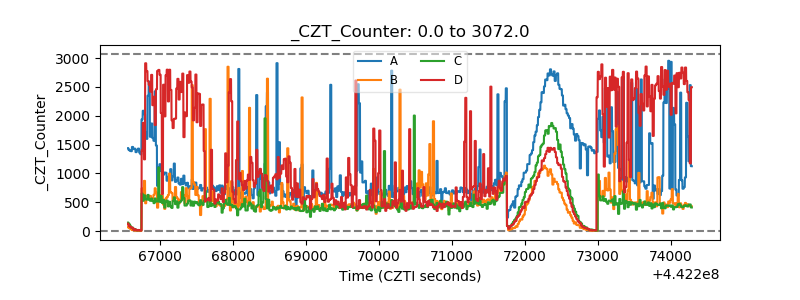 |
| +2.5 Volts monitor | 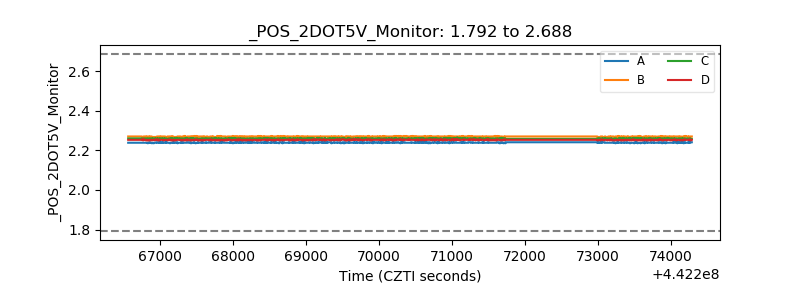 |
| +5 Volts monitor | 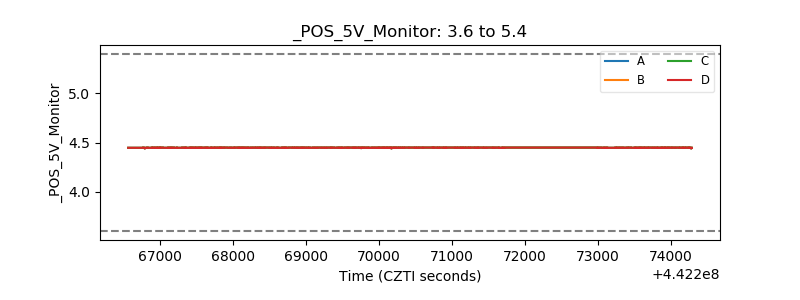 |
| _ROLL_ROT | 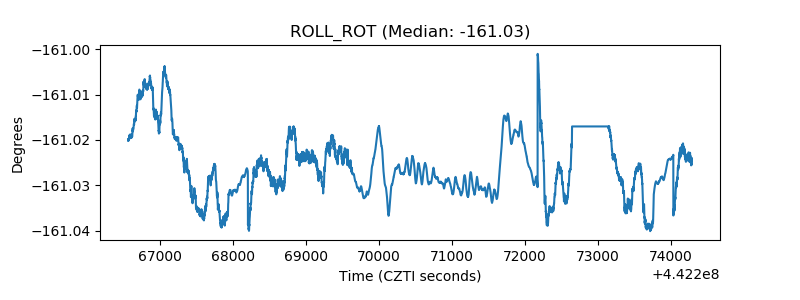 |
| _Roll_DEC | 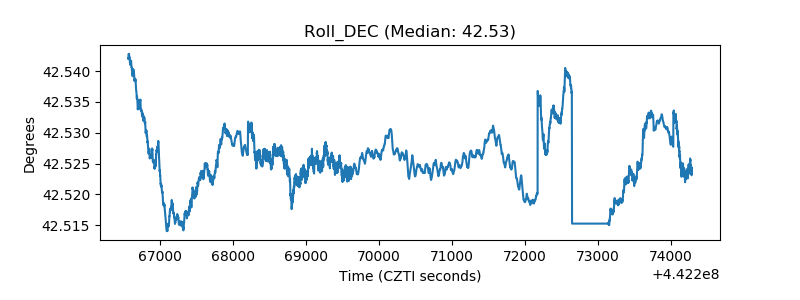 |
| _Roll_RA | 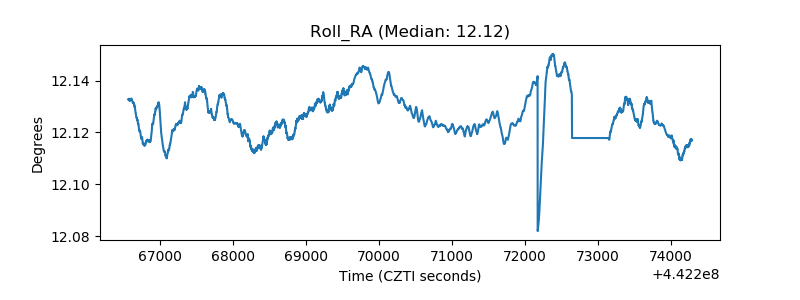 |
| Veto Counter | 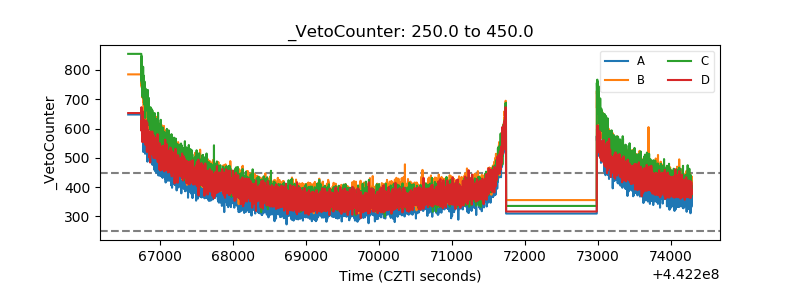 |