| Param | Original file | Final file |
|---|---|---|
| Filename | modeM0/AS1A13_004T11_9000006018_44752cztM0_level2.fits | modeM0/AS1A13_004T11_9000006018_44752cztM0_level2_quad_clean.evt |
| Size (bytes) | 827,948,160 | 171,613,440 |
| Size | 789.6 MB | 163.7 MB |
| Events in quadrant A | 10,196,185 | 1,102,254 |
| Events in quadrant B | 5,919,164 | 1,179,252 |
| Events in quadrant C | 5,603,731 | 1,161,773 |
| Events in quadrant D | 8,086,501 | 999,561 |
| Mode SS | |||
|---|---|---|---|
| Quadrant | BADHDUFLAG | Total packets | Discarded packets |
| A | 0 | 222 | 0 |
| B | 0 | 222 | 0 |
| C | 0 | 222 | 0 |
| D | 0 | 222 | 0 |
| Mode M0 | |||
|---|---|---|---|
| Quadrant | BADHDUFLAG | Total packets | Discarded packets |
| A | 0 | 38945 | 2 |
| B | 0 | 25130 | 2 |
| C | 0 | 24611 | 3 |
| D | 0 | 31753 | 2 |
| Mode M9 | |||
|---|---|---|---|
| Quadrant | BADHDUFLAG | Total packets | Discarded packets |
| A | 0 | 19 | 0 |
| B | 0 | 19 | 0 |
| C | 0 | 19 | 0 |
| D | 0 | 19 | 0 |
| Quadrant | Total seconds | Saturated seconds | Saturation percentage |
|---|---|---|---|
| A | 10880 | 871 | 8.005515% |
| B | 10881 | 307 | 2.821432% |
| C | 10880 | 174 | 1.599265% |
| D | 10880 | 851 | 7.821691% |
Noise dominated data is calculated using 1-second bins in cleaned event files. If a bin has >2000 counts, and if more than 50% of those come from <1% of pixels, then it is considered to be noise-dominated and hence unusable.
| Quadrant | # 1 sec bins | Bins with >0 counts | Bins with >2000 counts | High rate bins dominated by noise | Noise dominated (total time) | Noise dominated (detector-on time) | Marked lightcurve |
|---|---|---|---|---|---|---|---|
| A | 12780 | 10882 | 490 | 490 | 3.83% | 4.50% | 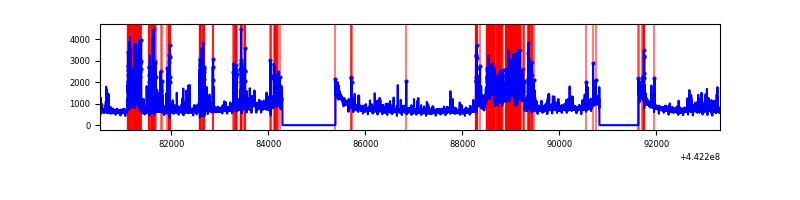 |
| B | 12781 | 10882 | 108 | 108 | 0.85% | 0.99% | 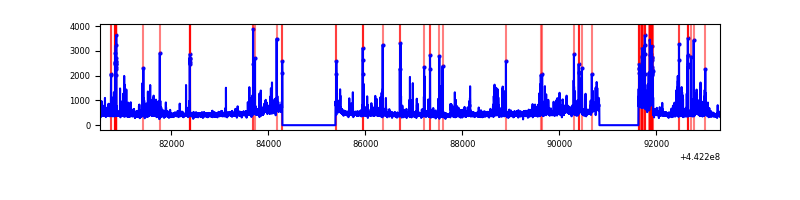 |
| C | 12780 | 10882 | 130 | 130 | 1.02% | 1.19% | 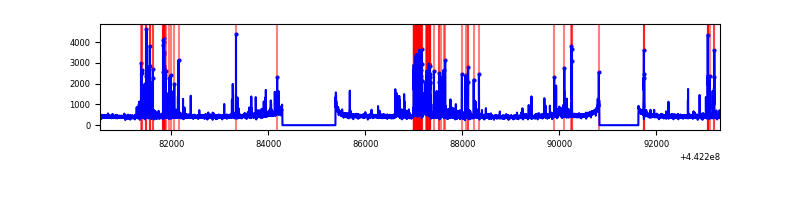 |
| D | 12780 | 10882 | 721 | 721 | 5.64% | 6.63% | 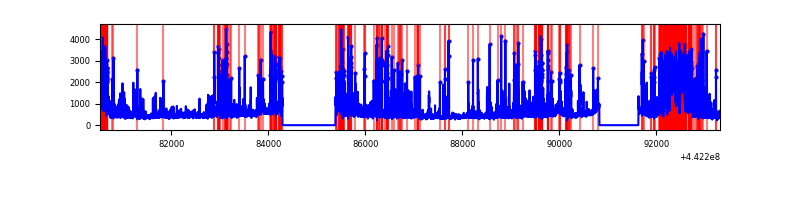 |
Top three noisy pixels from each quadrant. If the there are fewer than three noisy pixels in the level2.evt file, extra rows are filled as -1
| Pixel properties | Quadrant properties | ||||||
|---|---|---|---|---|---|---|---|
| Quadrant | DetID | PixID | Counts | Sigma | Mean | Median | Sigma |
| A | 10 | 83 | 3115247 | 12724.48 | 1182 | 1153 | 244.7 |
| A | 15 | 223 | 2174727 | 8881.43 | 1182 | 1153 | 244.7 |
| A | 13 | 248 | 233689 | 950.16 | 1182 | 1153 | 244.7 |
| B | 0 | 189 | 738826 | 3158.84 | 1198 | 1162 | 233.5 |
| B | 5 | 255 | 166908 | 709.76 | 1198 | 1162 | 233.5 |
| B | 0 | 219 | 47471 | 198.31 | 1198 | 1162 | 233.5 |
| C | 1 | 3 | 472143 | 1699.01 | 1182 | 1187 | 277.2 |
| C | 14 | 254 | 460318 | 1656.35 | 1182 | 1187 | 277.2 |
| C | 12 | 2 | 42748 | 149.93 | 1182 | 1187 | 277.2 |
| D | 5 | 235 | 1106416 | 3952.12 | 1140 | 1107 | 279.7 |
| D | 13 | 249 | 1021723 | 3649.29 | 1140 | 1107 | 279.7 |
| D | 2 | 249 | 370523 | 1320.88 | 1140 | 1107 | 279.7 |
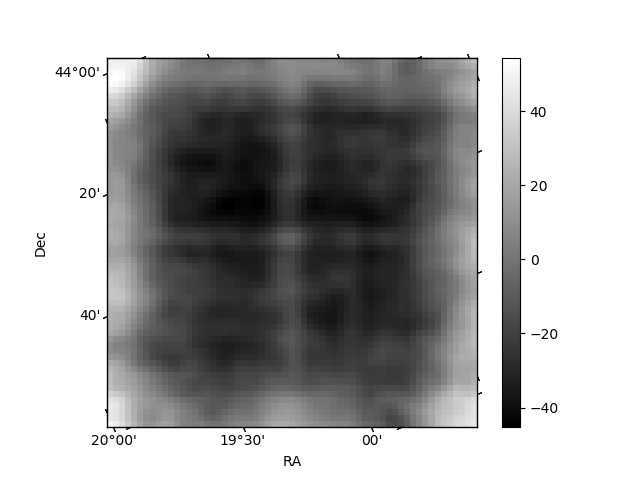
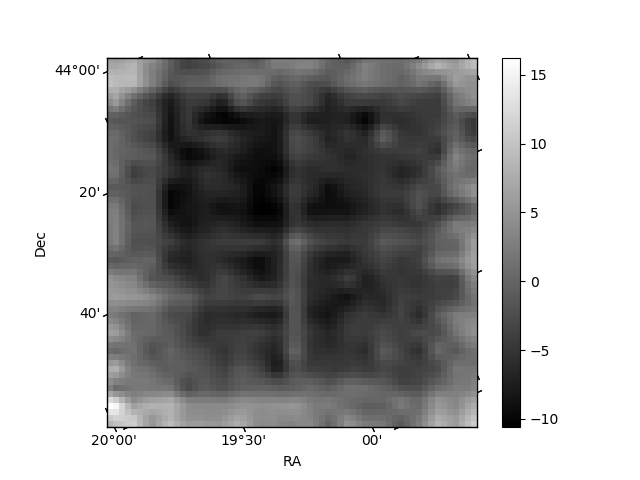
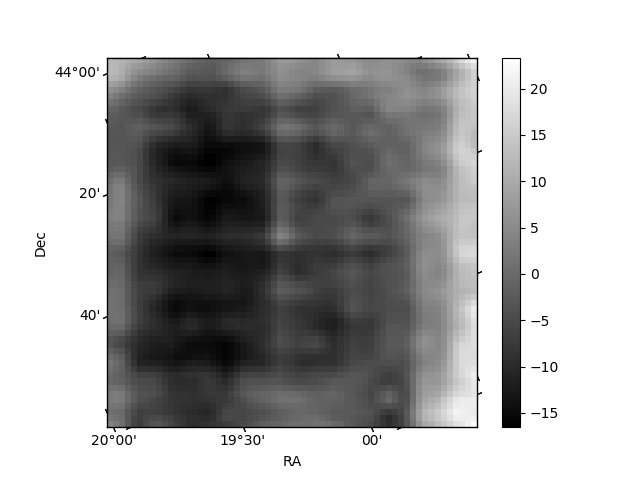
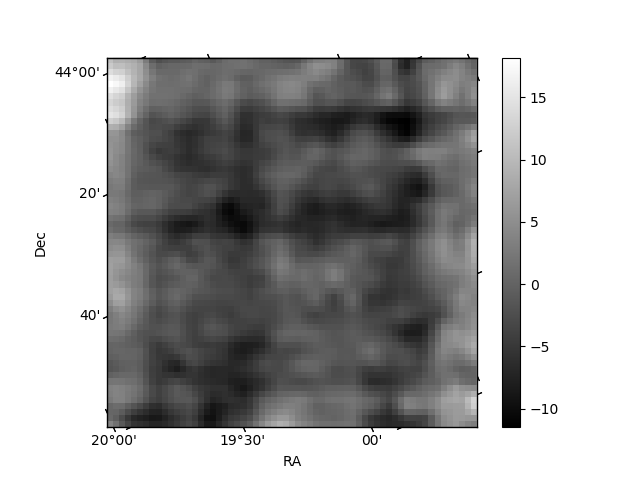
Histogram calculated using DETX and DETY for each event in the final _common_clean file
| Quadrant A | 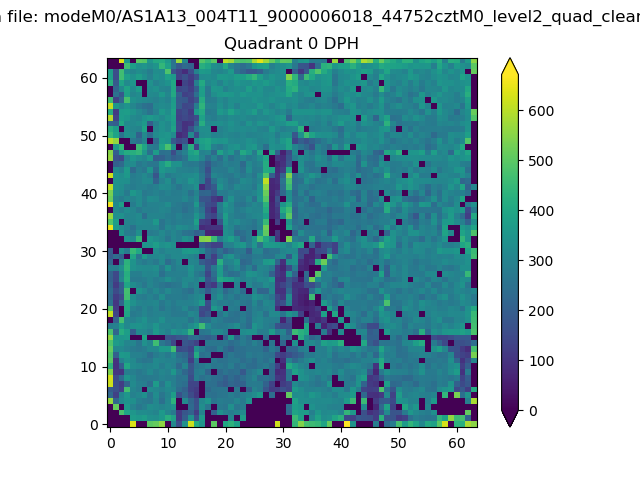 |
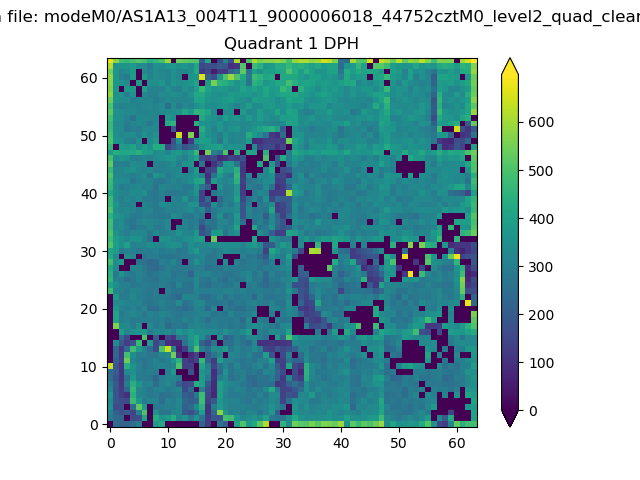 |
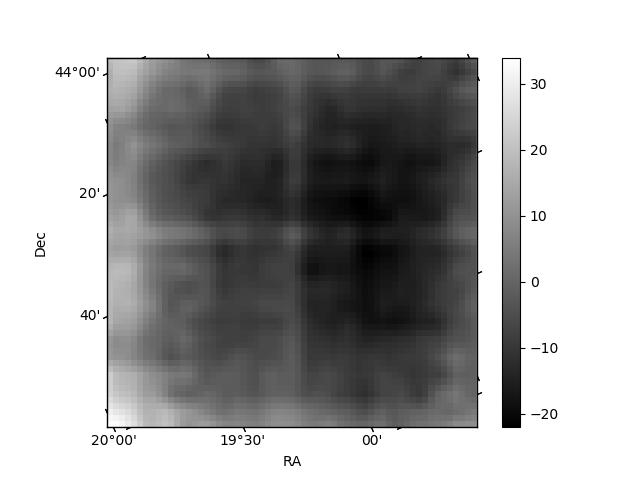
Quadrant B |
|---|---|---|---|
| Quadrant D | 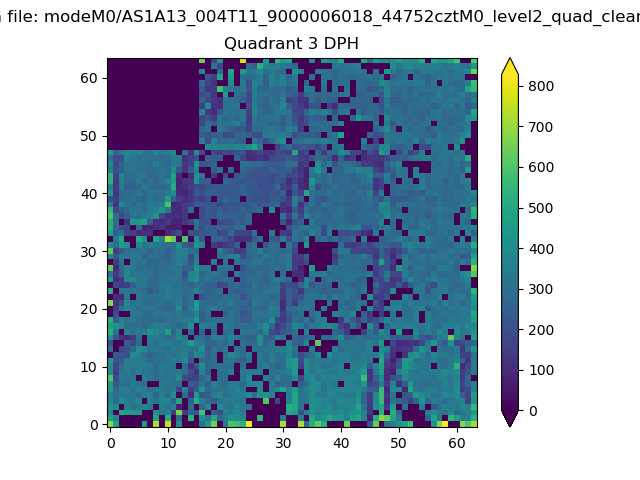 |
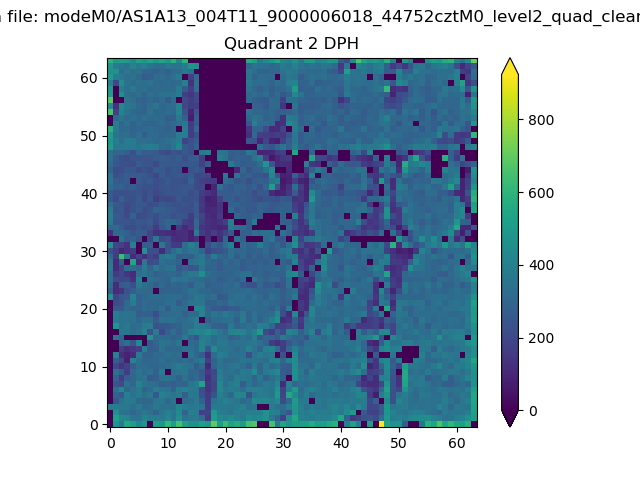 |
Quadrant C |
| Plot type | Count rate plots | Images |
|---|---|---|
| Comparison with Poisson distribution Blue bars denote a histogram of data divided into 1 sec bins. Red curve is a Poisson curve with rate = median count rate of data. |
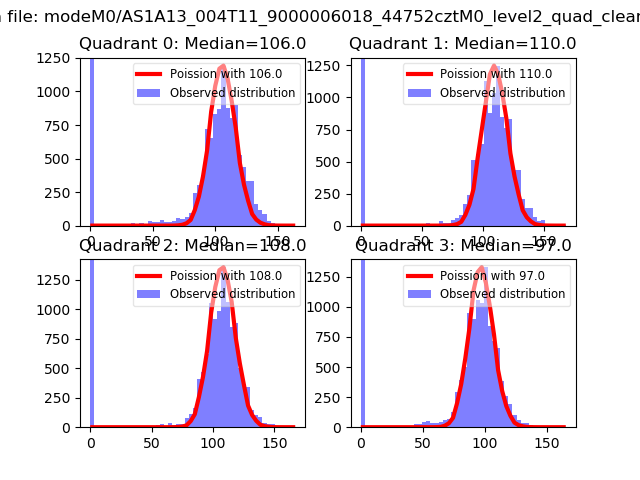 |
 |
| Quadrant-wise count rates Data is divided into 100 sec bins |
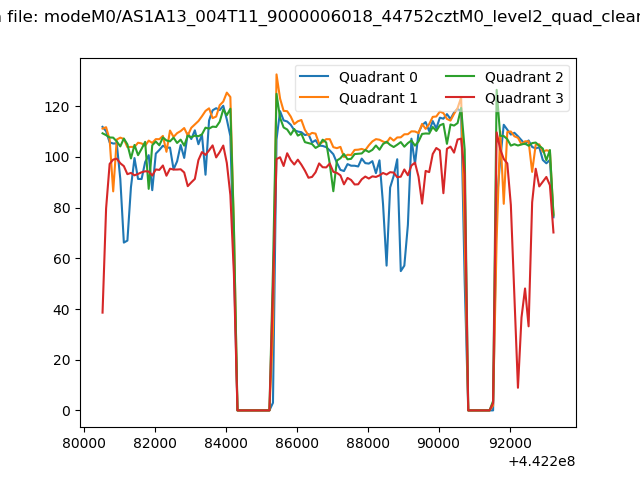 |
|
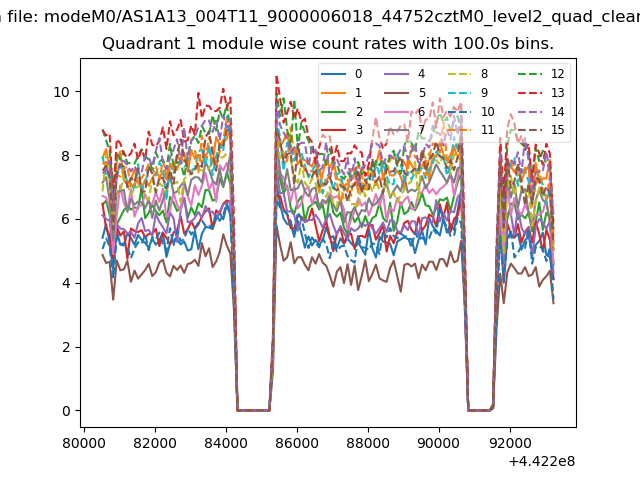
| Module-wise count rates for Quadrant A Data is divided into 100 sec bins |
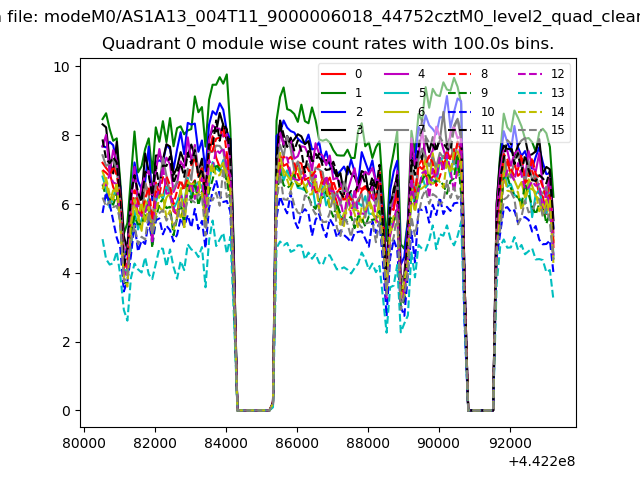 |
 |
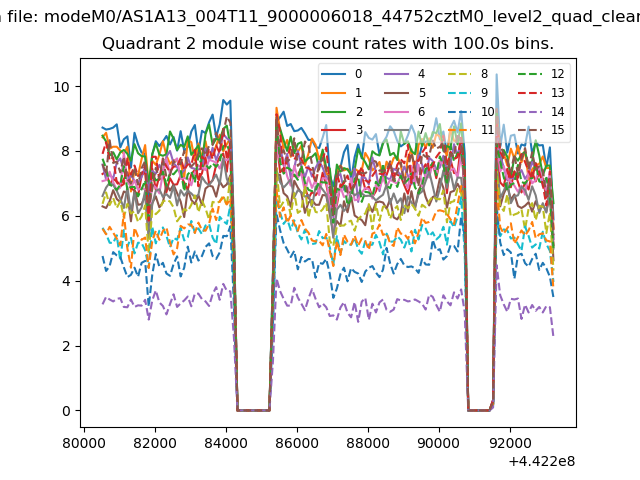
| Module-wise count rates for Quadrant B Data is divided into 100 sec bins |
 |
 |
| Module-wise count rates for Quadrant C Data is divided into 100 sec bins |
 |
 |
| Module-wise count rates for Quadrant D Data is divided into 100 sec bins |
 |
 |
| Parameter | Plot |
|---|---|
| CZT HV Monitor | 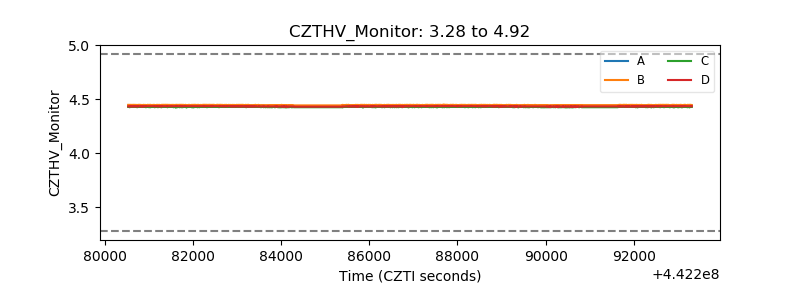 |
| D_VDD | 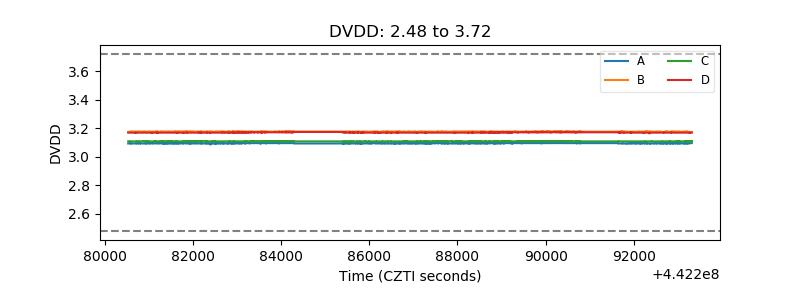 |
| Temperature 1 | 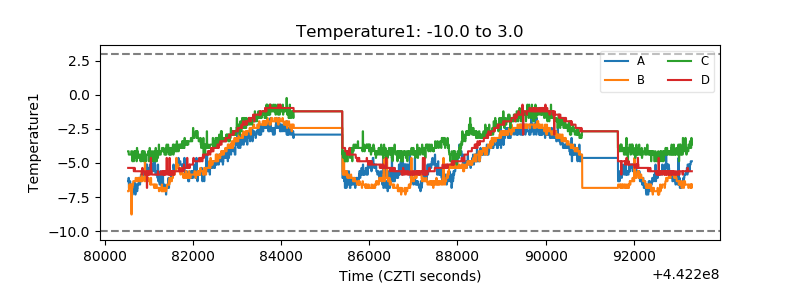 |
| Veto HV Monitor | 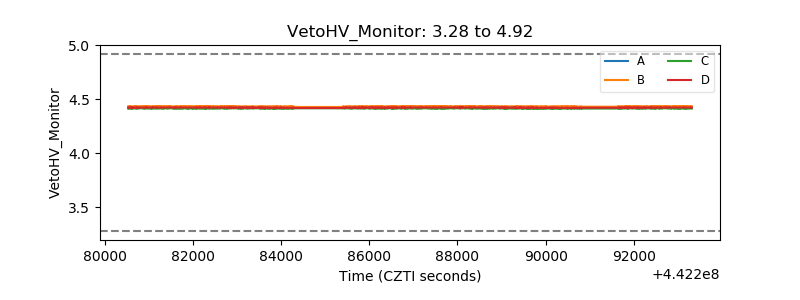 |
| Veto LLD | 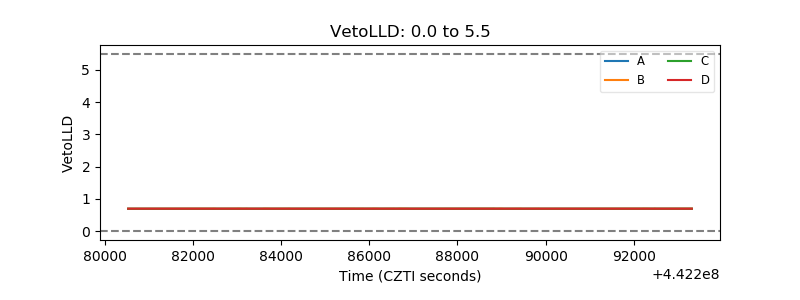 |
| Alpha Counter | 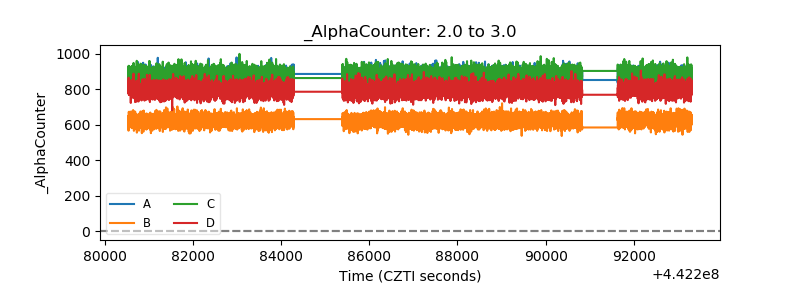 |
| _CPM_Rate | 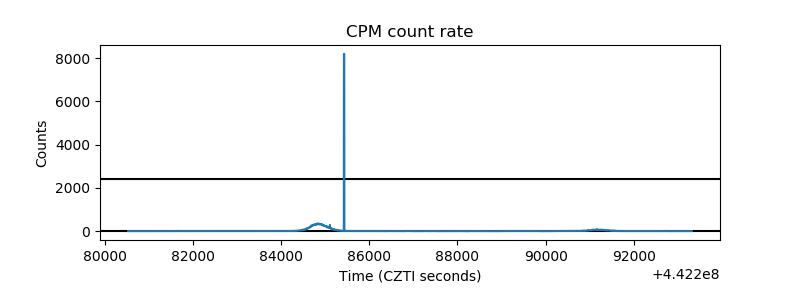 |
| CZT Counter | 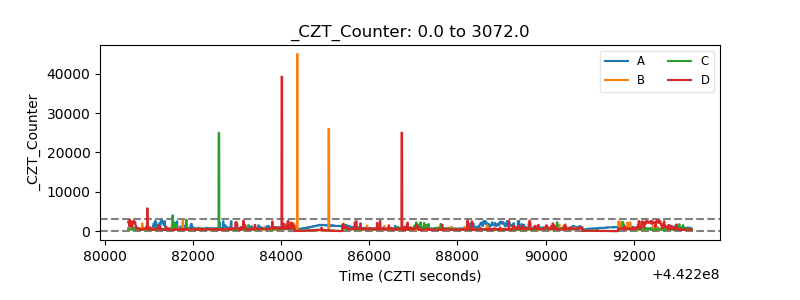 |
| +2.5 Volts monitor | 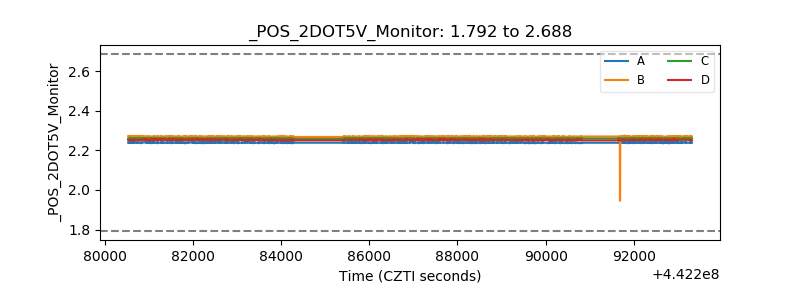 |
| +5 Volts monitor | 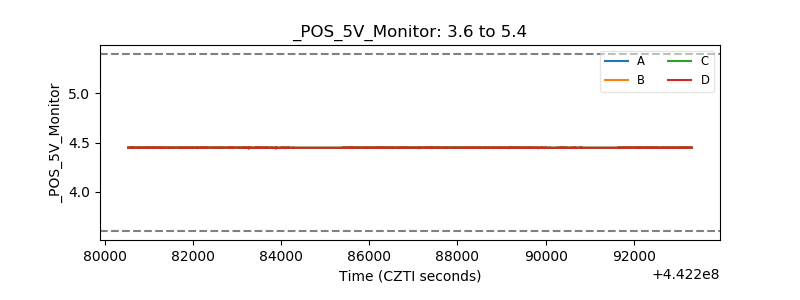 |
| _ROLL_ROT | 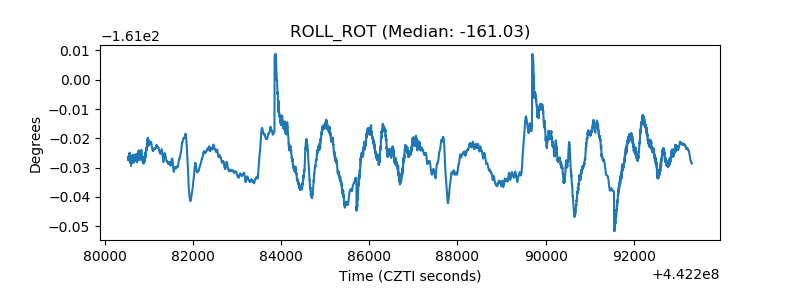 |
| _Roll_DEC | 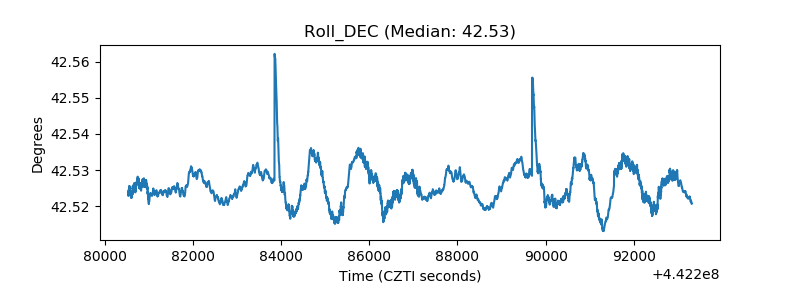 |
| _Roll_RA | 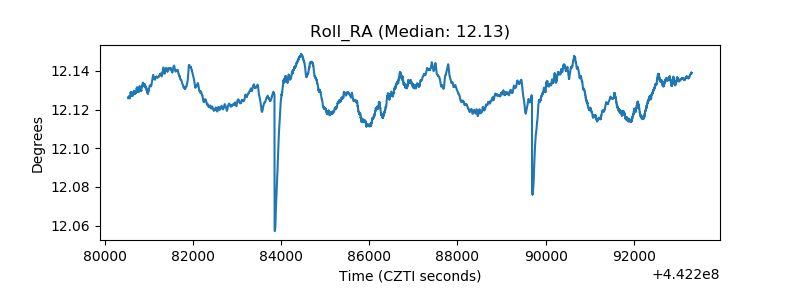 |
| Veto Counter |  |