| Param | Original file | Final file |
|---|---|---|
| Filename | modeM0/AS1A13_004T11_9000006018_44753cztM0_level2.fits | modeM0/AS1A13_004T11_9000006018_44753cztM0_level2_quad_clean.evt |
| Size (bytes) | 589,150,080 | 117,815,040 |
| Size | 561.9 MB | 112.4 MB |
| Events in quadrant A | 5,929,708 | 788,087 |
| Events in quadrant B | 4,862,227 | 774,622 |
| Events in quadrant C | 3,562,837 | 802,475 |
| Events in quadrant D | 6,858,846 | 668,670 |
| Mode SS | |||
|---|---|---|---|
| Quadrant | BADHDUFLAG | Total packets | Discarded packets |
| A | 0 | 158 | 0 |
| B | 0 | 158 | 0 |
| C | 0 | 158 | 0 |
| D | 0 | 158 | 0 |
| Mode M0 | |||
|---|---|---|---|
| Quadrant | BADHDUFLAG | Total packets | Discarded packets |
| A | 0 | 24053 | 3 |
| B | 0 | 19807 | 3 |
| C | 0 | 16322 | 3 |
| D | 0 | 25773 | 3 |
| Mode M9 | |||
|---|---|---|---|
| Quadrant | BADHDUFLAG | Total packets | Discarded packets |
| A | 0 | 6 | 0 |
| B | 0 | 7 | 0 |
| C | 0 | 7 | 0 |
| D | 0 | 7 | 0 |
| Quadrant | Total seconds | Saturated seconds | Saturation percentage |
|---|---|---|---|
| A | 7664 | 329 | 4.292797% |
| B | 7663 | 631 | 8.234373% |
| C | 7663 | 145 | 1.892209% |
| D | 7663 | 953 | 12.436383% |
Noise dominated data is calculated using 1-second bins in cleaned event files. If a bin has >2000 counts, and if more than 50% of those come from <1% of pixels, then it is considered to be noise-dominated and hence unusable.
| Quadrant | # 1 sec bins | Bins with >0 counts | Bins with >2000 counts | High rate bins dominated by noise | Noise dominated (total time) | Noise dominated (detector-on time) | Marked lightcurve |
|---|---|---|---|---|---|---|---|
| A | 7854 | 7668 | 16 | 16 | 0.20% | 0.21% | 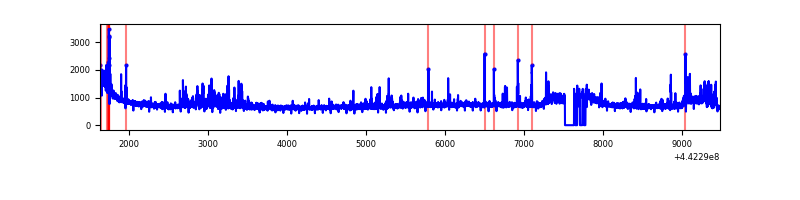 |
| B | 7853 | 7667 | 238 | 238 | 3.03% | 3.10% |  |
| C | 7853 | 7667 | 21 | 21 | 0.27% | 0.27% | 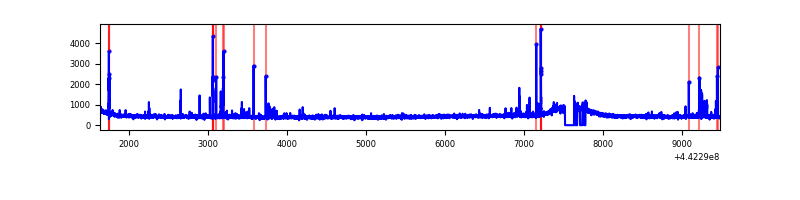 |
| D | 7853 | 7666 | 775 | 775 | 9.87% | 10.11% | 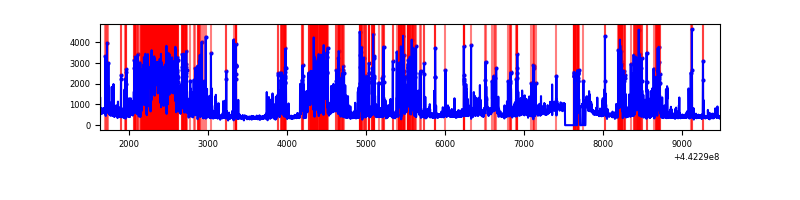 |
Top three noisy pixels from each quadrant. If the there are fewer than three noisy pixels in the level2.evt file, extra rows are filled as -1
| Pixel properties | Quadrant properties | ||||||
|---|---|---|---|---|---|---|---|
| Quadrant | DetID | PixID | Counts | Sigma | Mean | Median | Sigma |
| A | 10 | 83 | 2144562 | 11977.3 | 859 | 838 | 179.0 |
| A | 15 | 223 | 311528 | 1735.87 | 859 | 838 | 179.0 |
| A | 12 | 227 | 131800 | 731.7 | 859 | 838 | 179.0 |
| B | 0 | 189 | 907778 | 5363.98 | 843 | 814 | 169.1 |
| B | 5 | 255 | 572404 | 3380.51 | 843 | 814 | 169.1 |
| B | 12 | 111 | 21564 | 122.72 | 843 | 814 | 169.1 |
| C | 14 | 254 | 138210 | 680.83 | 856 | 860 | 201.7 |
| C | 1 | 3 | 43007 | 208.92 | 856 | 860 | 201.7 |
| C | 12 | 2 | 22188 | 105.72 | 856 | 860 | 201.7 |
| D | 5 | 235 | 1822796 | 8894.24 | 811 | 783 | 204.9 |
| D | 1 | 52 | 1073555 | 5236.79 | 811 | 783 | 204.9 |
| D | 13 | 249 | 440450 | 2146.26 | 811 | 783 | 204.9 |
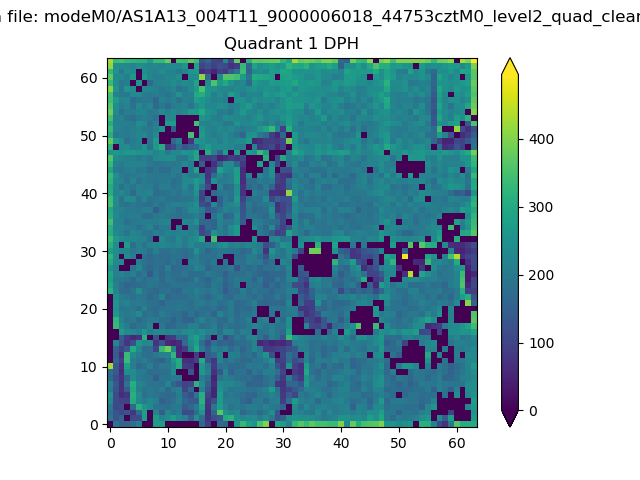
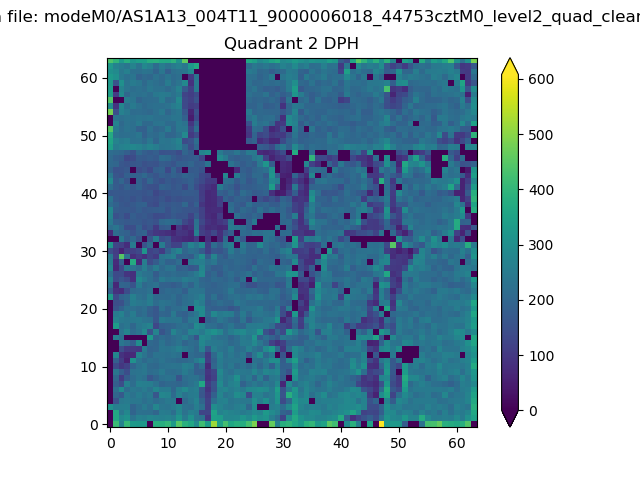
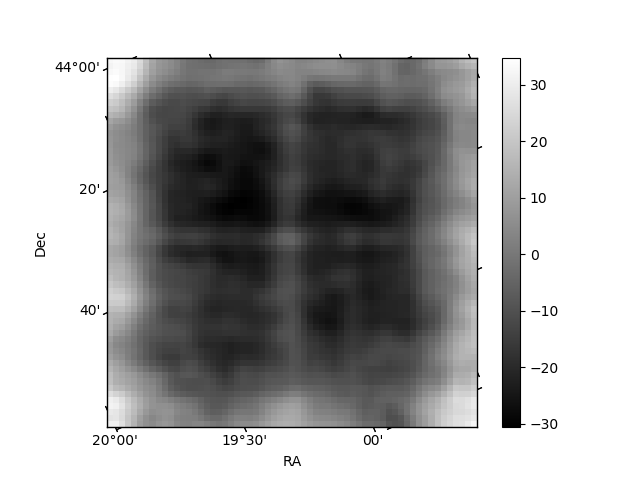
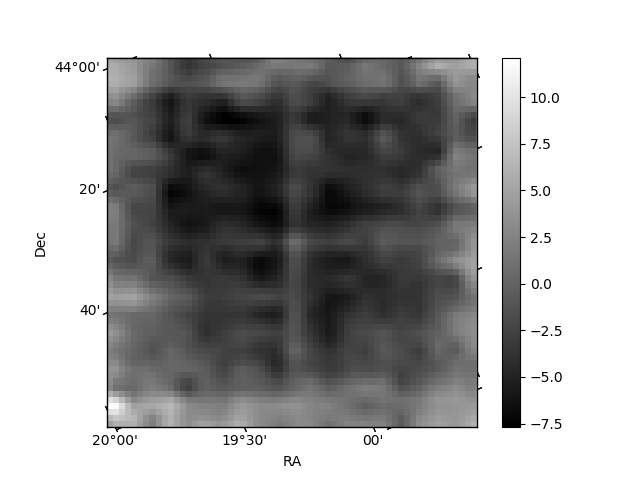
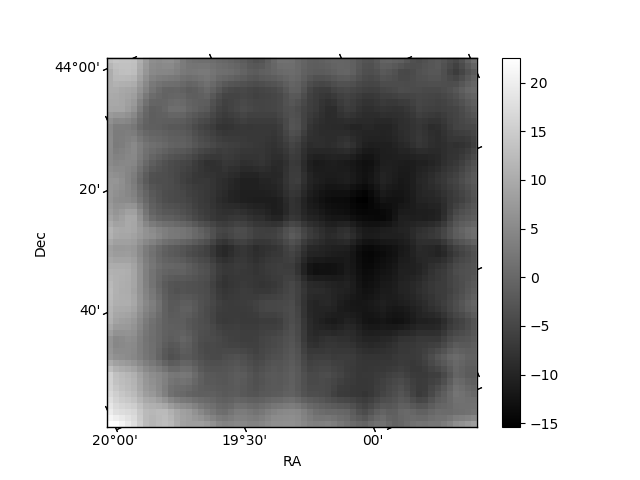
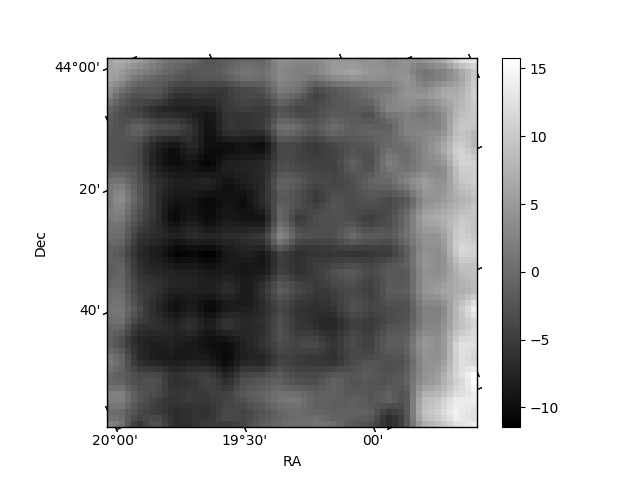
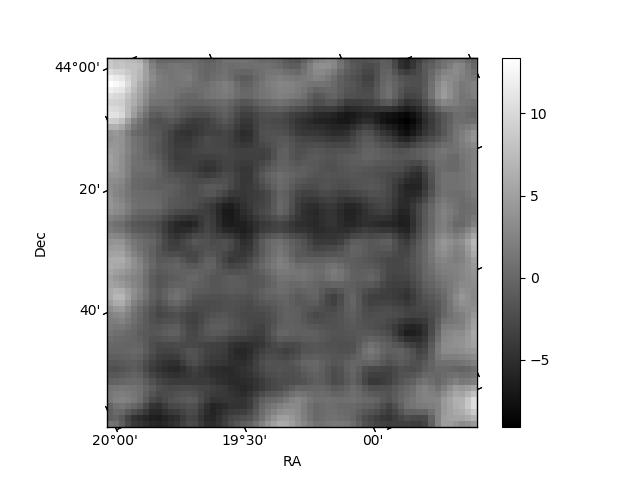
Histogram calculated using DETX and DETY for each event in the final _common_clean file
| Quadrant A | 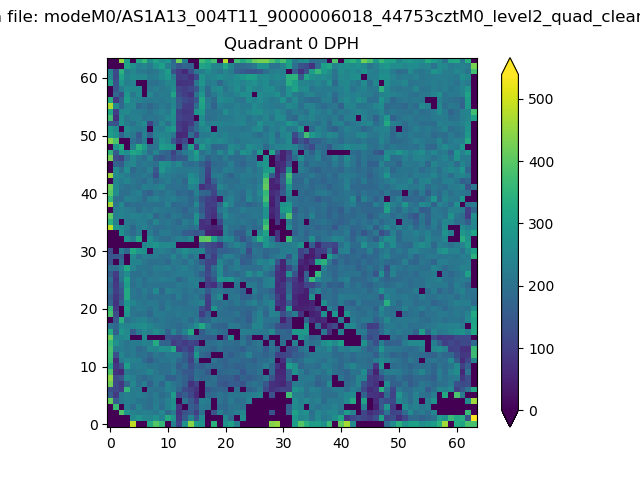 |
 |
Quadrant B |
|---|---|---|---|
| Quadrant D | 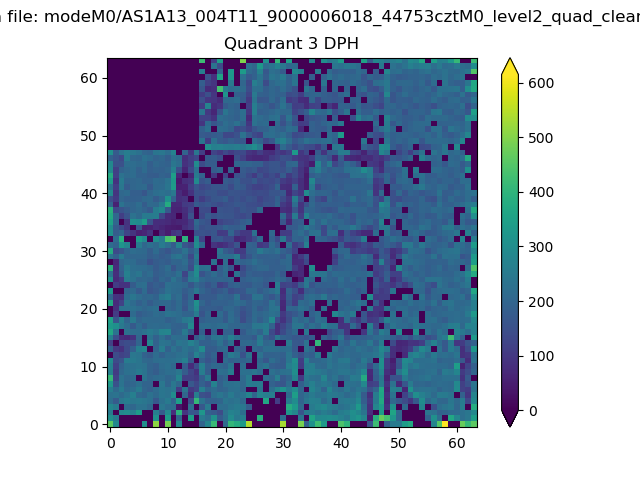 |
 |
Quadrant C |
| Plot type | Count rate plots | Images |
|---|---|---|
| Comparison with Poisson distribution Blue bars denote a histogram of data divided into 1 sec bins. Red curve is a Poisson curve with rate = median count rate of data. |
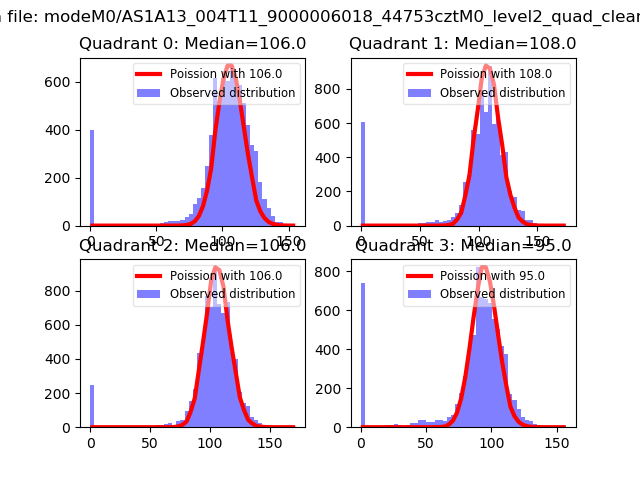 |
 |
| Quadrant-wise count rates Data is divided into 100 sec bins |
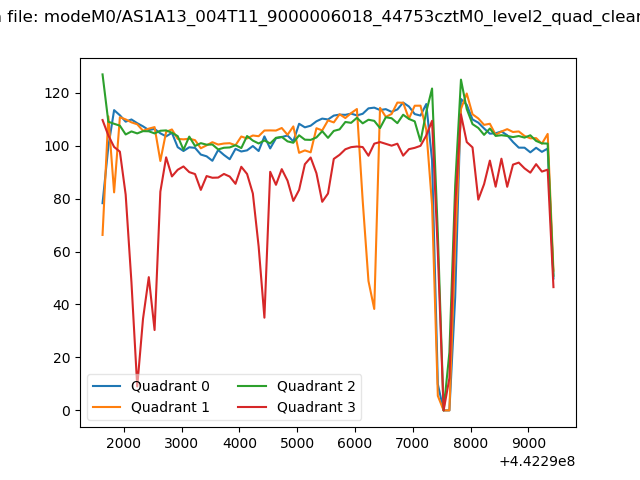 |
|
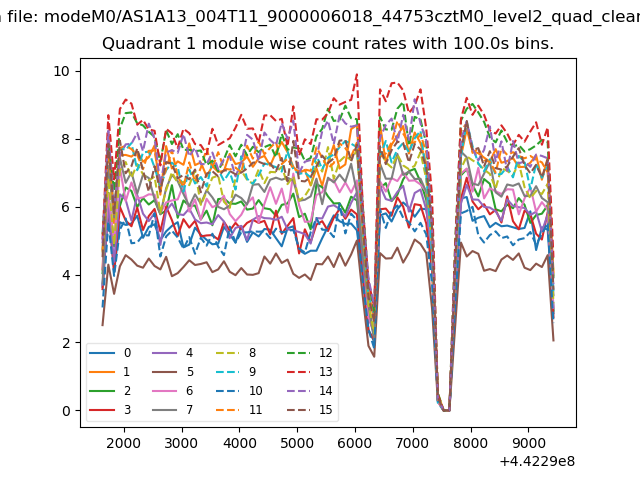
| Module-wise count rates for Quadrant A Data is divided into 100 sec bins |
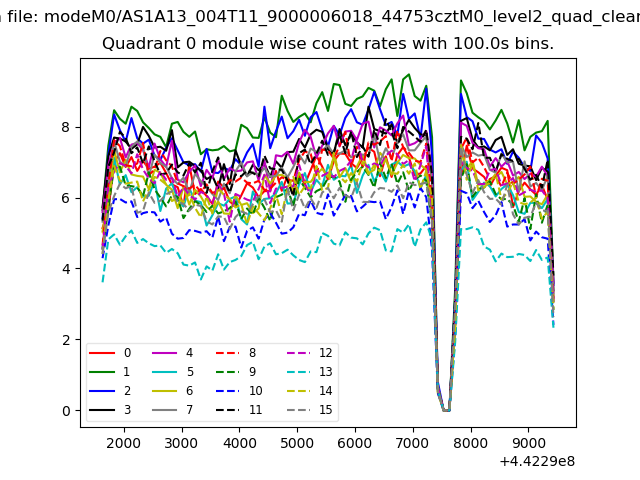 |
 |
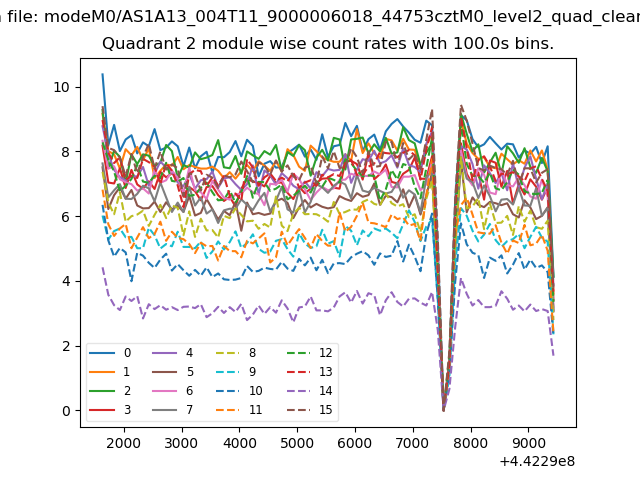
| Module-wise count rates for Quadrant B Data is divided into 100 sec bins |
 |
 |
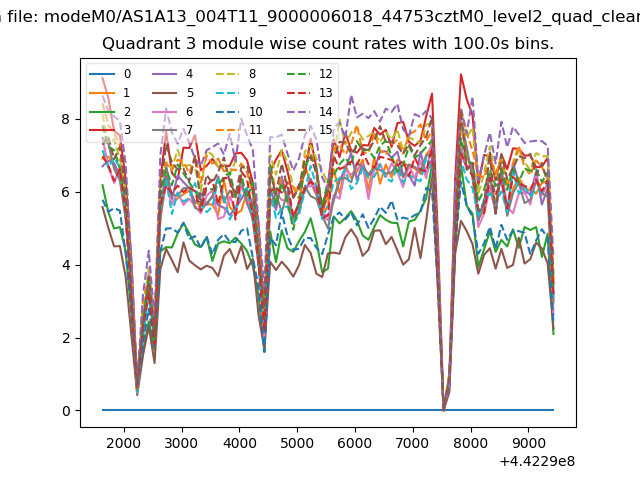
| Module-wise count rates for Quadrant C Data is divided into 100 sec bins |
 |
 |
| Module-wise count rates for Quadrant D Data is divided into 100 sec bins |
 |
 |
| Parameter | Plot |
|---|---|
| CZT HV Monitor | 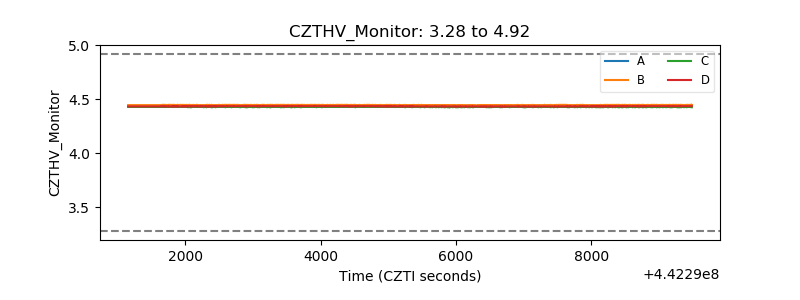 |
| D_VDD | 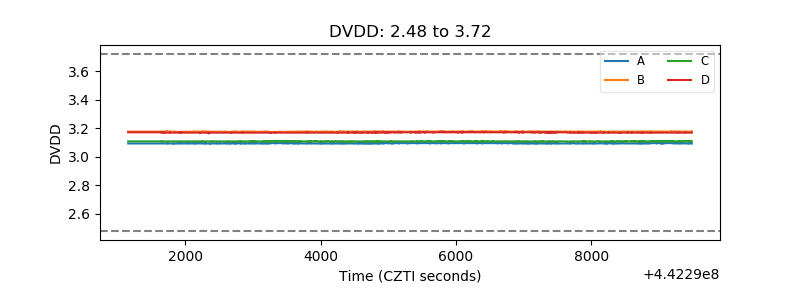 |
| Temperature 1 | 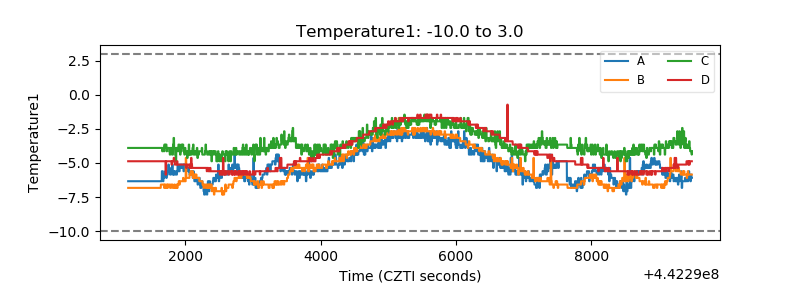 |
| Veto HV Monitor | 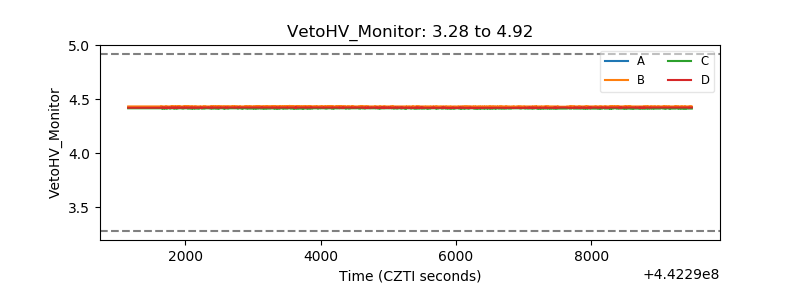 |
| Veto LLD | 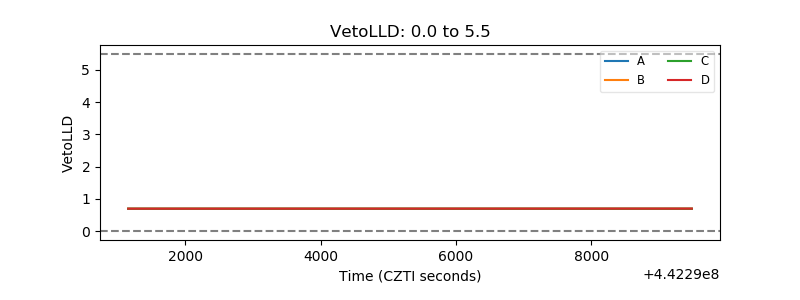 |
| Alpha Counter | 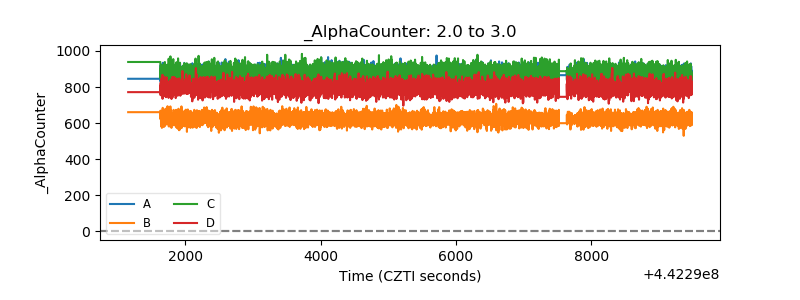 |
| _CPM_Rate | 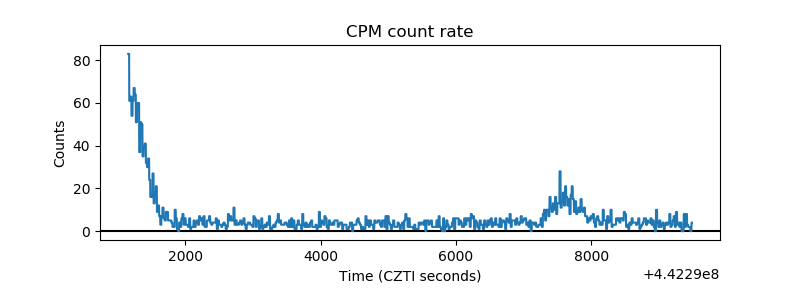 |
| CZT Counter | 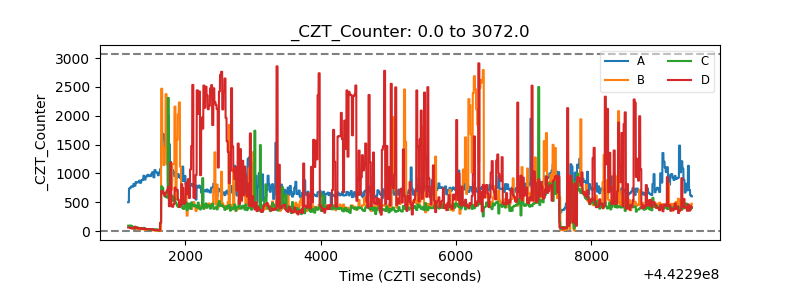 |
| +2.5 Volts monitor | 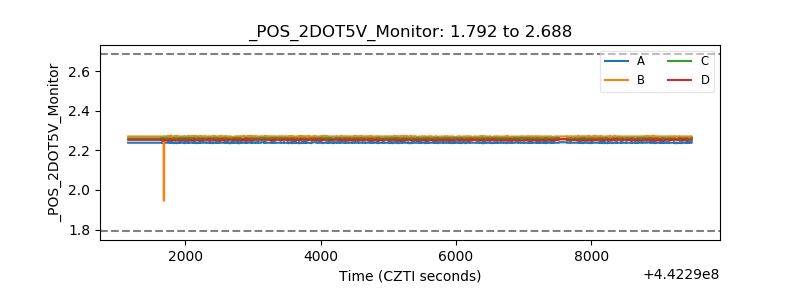 |
| +5 Volts monitor | 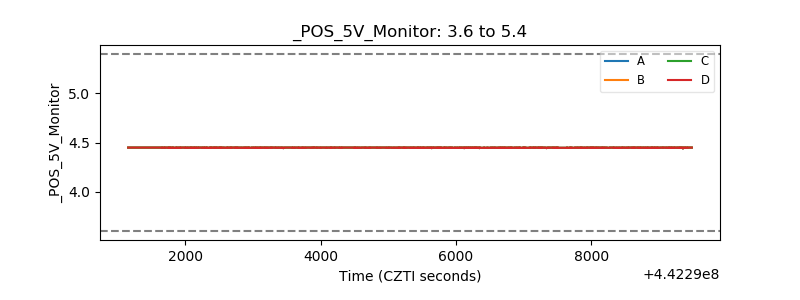 |
| _ROLL_ROT | 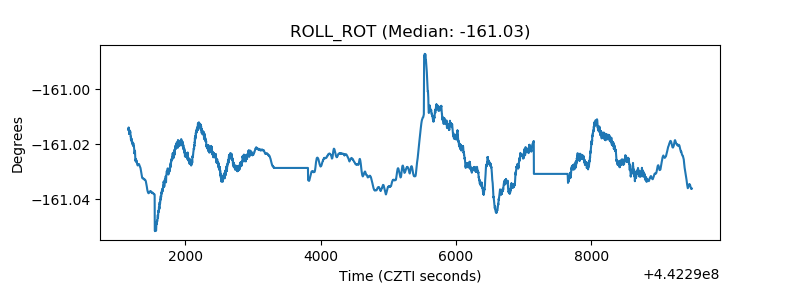 |
| _Roll_DEC | 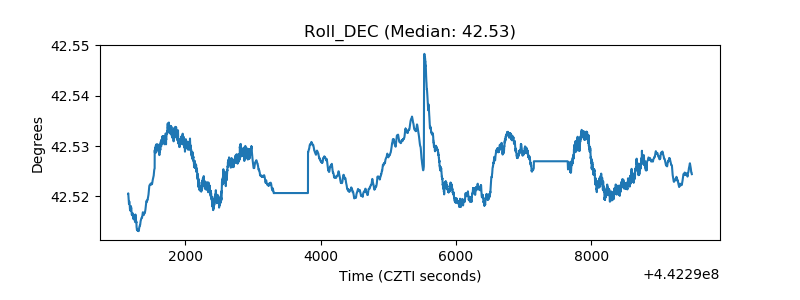 |
| _Roll_RA | 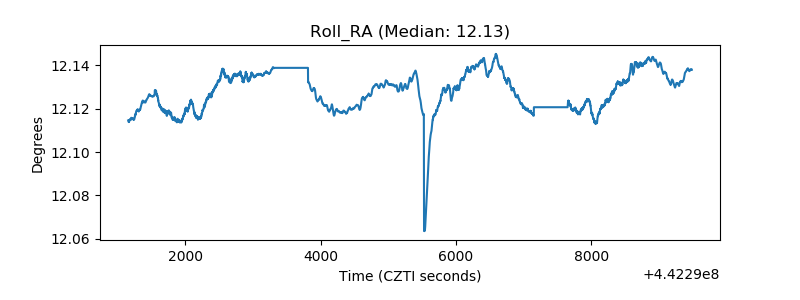 |
| Veto Counter | 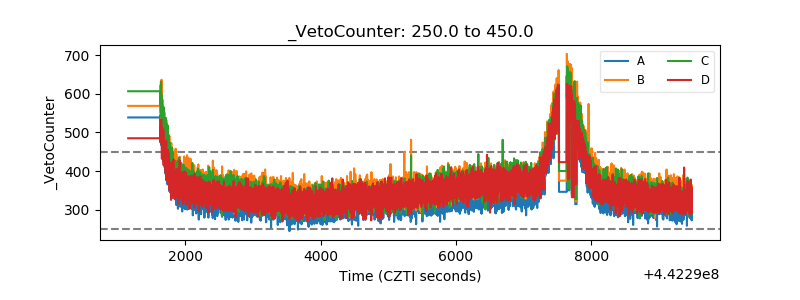 |