| Param | Original file | Final file |
|---|---|---|
| Filename | modeM0/AS1A13_004T11_9000006018_44754cztM0_level2.fits | modeM0/AS1A13_004T11_9000006018_44754cztM0_level2_quad_clean.evt |
| Size (bytes) | 381,424,320 | 87,168,960 |
| Size | 363.8 MB | 83.1 MB |
| Events in quadrant A | 4,470,989 | 573,649 |
| Events in quadrant B | 2,698,437 | 591,033 |
| Events in quadrant C | 2,556,575 | 575,910 |
| Events in quadrant D | 3,961,869 | 510,493 |
| Mode SS | |||
|---|---|---|---|
| Quadrant | BADHDUFLAG | Total packets | Discarded packets |
| A | 0 | 114 | 0 |
| B | 0 | 114 | 0 |
| C | 0 | 114 | 0 |
| D | 0 | 114 | 0 |
| Mode M0 | |||
|---|---|---|---|
| Quadrant | BADHDUFLAG | Total packets | Discarded packets |
| A | 0 | 17885 | 2 |
| B | 0 | 11874 | 2 |
| C | 0 | 11757 | 2 |
| D | 0 | 15675 | 2 |
| Mode M9 | |||
|---|---|---|---|
| Quadrant | BADHDUFLAG | Total packets | Discarded packets |
| A | 0 | 1 | 0 |
| B | 0 | 1 | 0 |
| C | 0 | 1 | 0 |
| D | 0 | 1 | 0 |
| Quadrant | Total seconds | Saturated seconds | Saturation percentage |
|---|---|---|---|
| A | 5544 | 177 | 3.192641% |
| B | 5544 | 104 | 1.875902% |
| C | 5544 | 55 | 0.992063% |
| D | 5545 | 307 | 5.536519% |
Noise dominated data is calculated using 1-second bins in cleaned event files. If a bin has >2000 counts, and if more than 50% of those come from <1% of pixels, then it is considered to be noise-dominated and hence unusable.
| Quadrant | # 1 sec bins | Bins with >0 counts | Bins with >2000 counts | High rate bins dominated by noise | Noise dominated (total time) | Noise dominated (detector-on time) | Marked lightcurve |
|---|---|---|---|---|---|---|---|
| A | 5619 | 5547 | 60 | 60 | 1.07% | 1.08% | 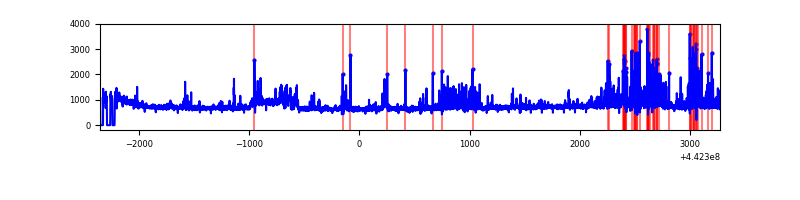 |
| B | 5619 | 5547 | 11 | 11 | 0.20% | 0.20% | 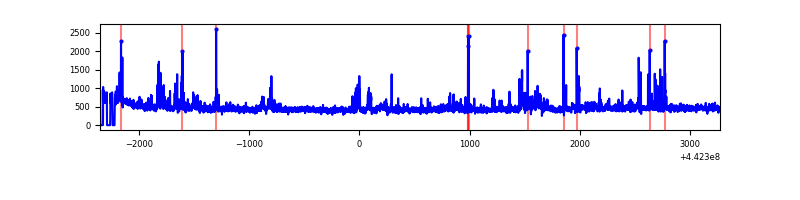 |
| C | 5619 | 5547 | 14 | 14 | 0.25% | 0.25% | 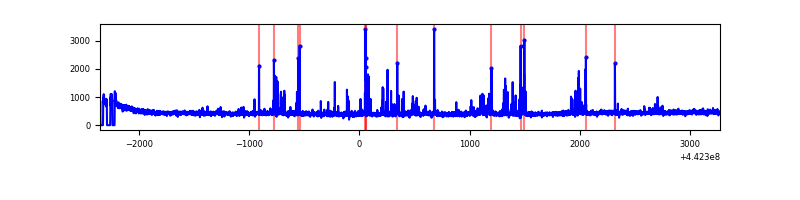 |
| D | 5620 | 5547 | 258 | 258 | 4.59% | 4.65% | 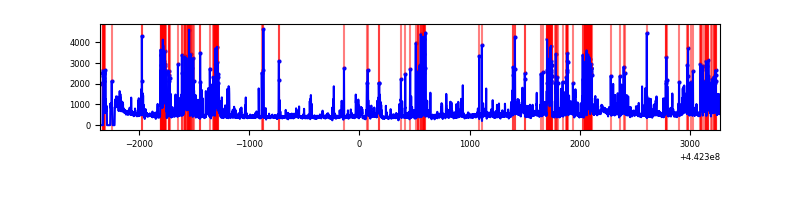 |
Top three noisy pixels from each quadrant. If the there are fewer than three noisy pixels in the level2.evt file, extra rows are filled as -1
| Pixel properties | Quadrant properties | ||||||
|---|---|---|---|---|---|---|---|
| Quadrant | DetID | PixID | Counts | Sigma | Mean | Median | Sigma |
| A | 10 | 83 | 1446970 | 11539.84 | 601 | 587 | 125.3 |
| A | 15 | 223 | 685012 | 5460.62 | 601 | 587 | 125.3 |
| A | 2 | 79 | 9682 | 72.56 | 601 | 587 | 125.3 |
| B | 0 | 189 | 149980 | 1239.83 | 601 | 581 | 120.5 |
| B | 5 | 255 | 114161 | 942.58 | 601 | 581 | 120.5 |
| B | 0 | 219 | 16087 | 128.68 | 601 | 581 | 120.5 |
| C | 14 | 254 | 202455 | 1436.51 | 596 | 600 | 140.5 |
| C | 12 | 2 | 13458 | 91.5 | 596 | 600 | 140.5 |
| C | 3 | 233 | 11974 | 80.94 | 596 | 600 | 140.5 |
| D | 1 | 52 | 849799 | 5783.56 | 580 | 560 | 146.8 |
| D | 13 | 249 | 333722 | 2268.93 | 580 | 560 | 146.8 |
| D | 1 | 47 | 259411 | 1762.85 | 580 | 560 | 146.8 |
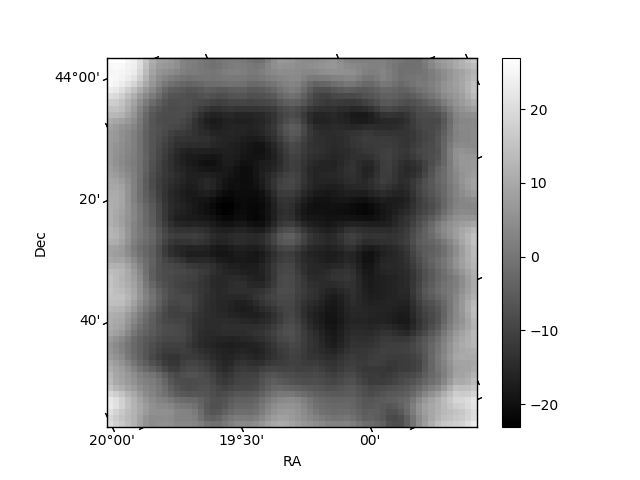
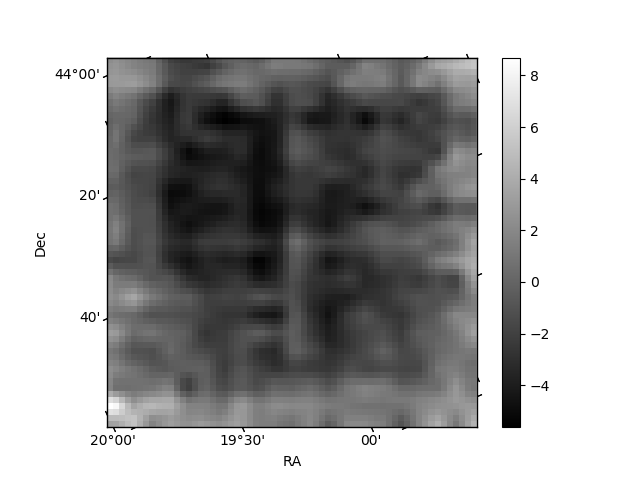
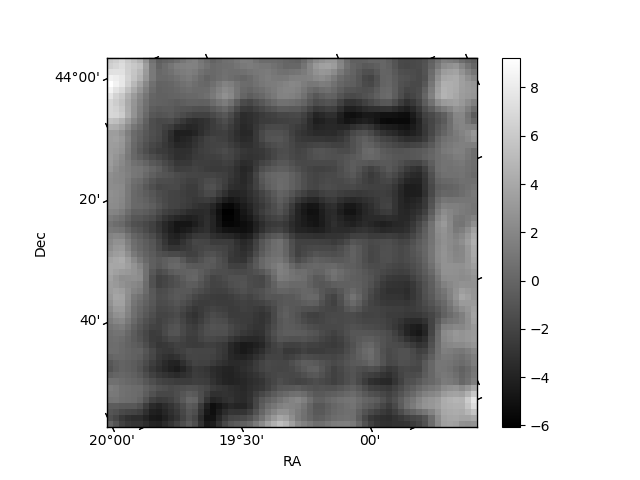
Histogram calculated using DETX and DETY for each event in the final _common_clean file
| Quadrant A | 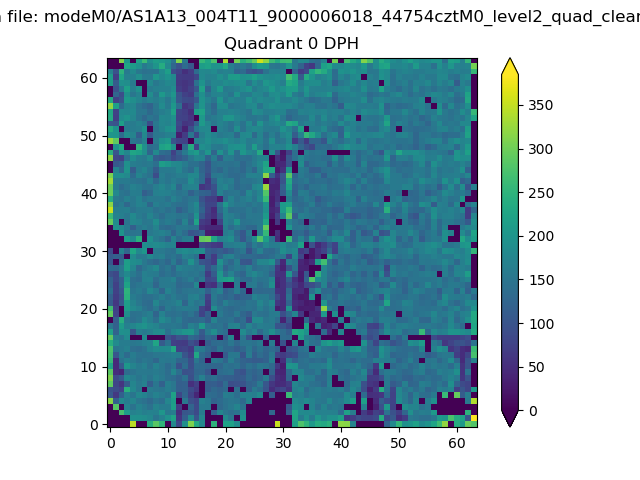 |
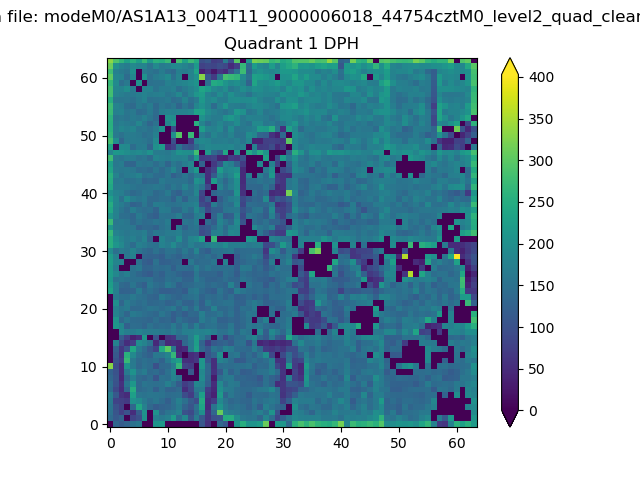 |
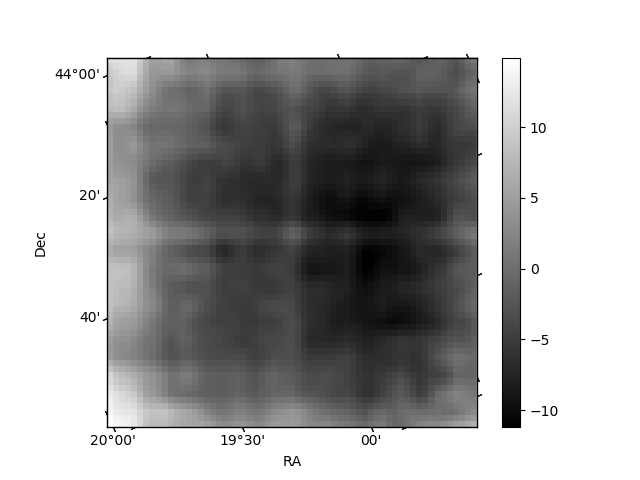
Quadrant B |
|---|---|---|---|
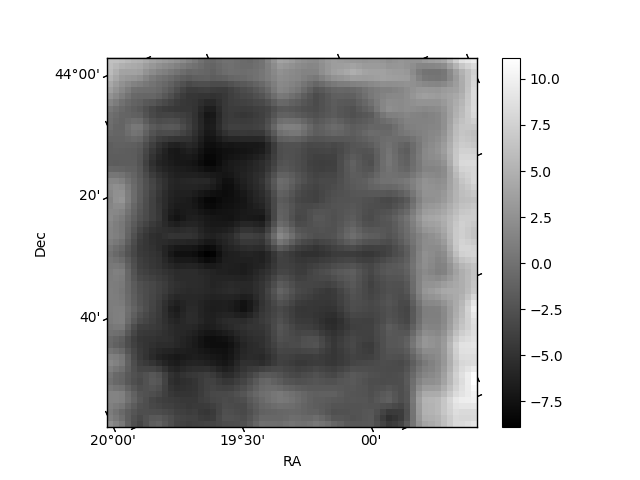
| Quadrant D | 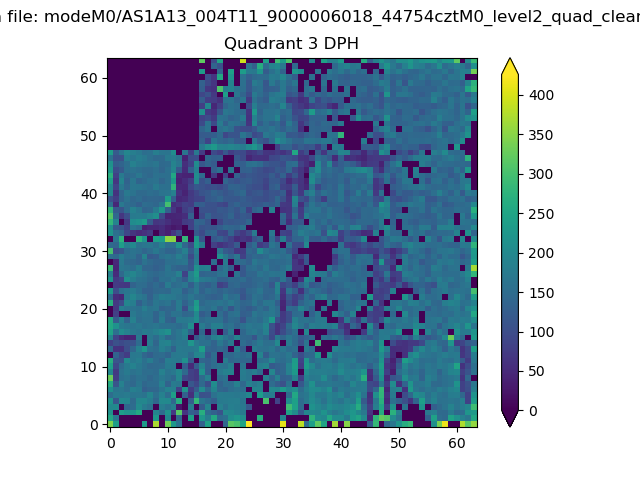 |
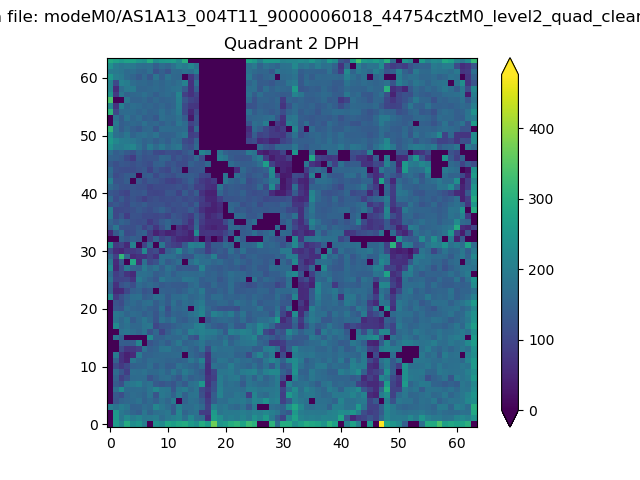 |
Quadrant C |
| Plot type | Count rate plots | Images |
|---|---|---|
| Comparison with Poisson distribution Blue bars denote a histogram of data divided into 1 sec bins. Red curve is a Poisson curve with rate = median count rate of data. |
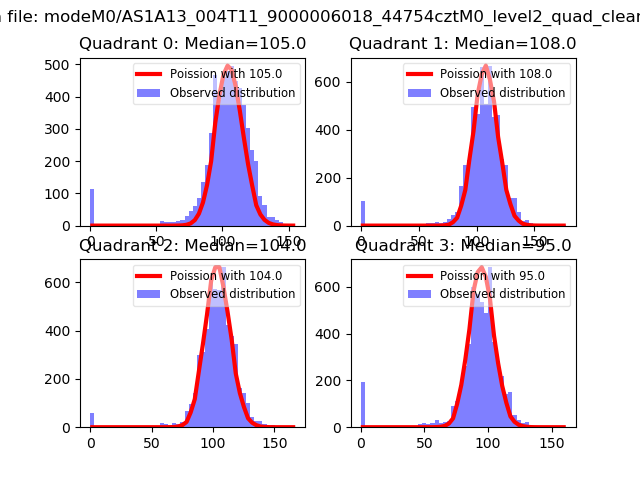 |
 |
| Quadrant-wise count rates Data is divided into 100 sec bins |
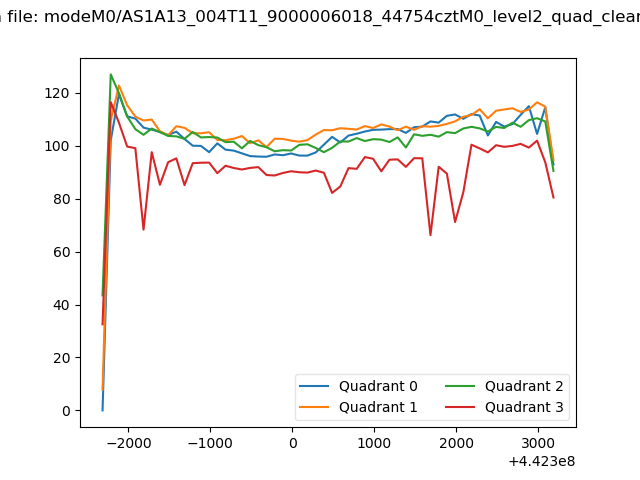 |
|
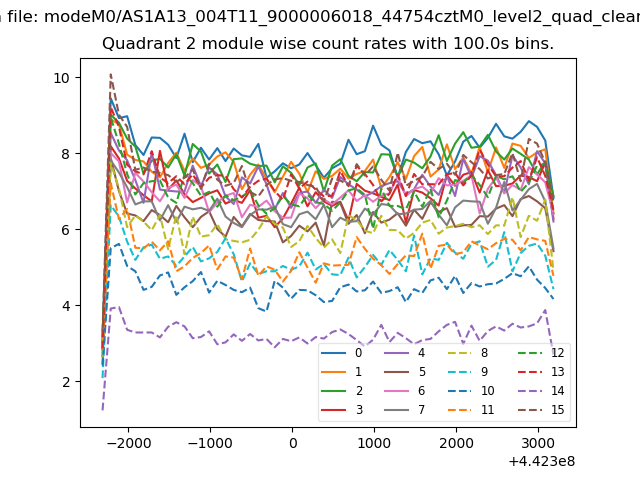
| Module-wise count rates for Quadrant A Data is divided into 100 sec bins |
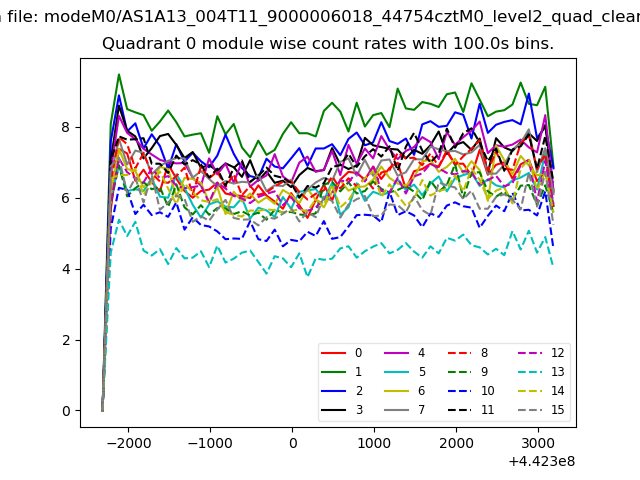 |
 |
| Module-wise count rates for Quadrant B Data is divided into 100 sec bins |
 |
 |
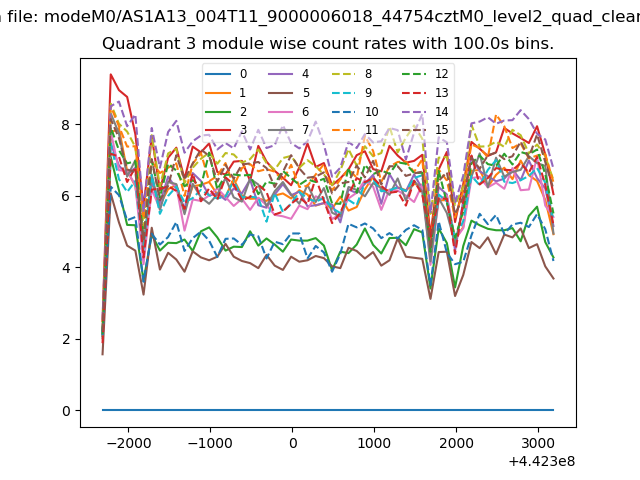
| Module-wise count rates for Quadrant C Data is divided into 100 sec bins |
 |
 |
| Module-wise count rates for Quadrant D Data is divided into 100 sec bins |
 |
 |
| Parameter | Plot |
|---|---|
| CZT HV Monitor |  |
| D_VDD | 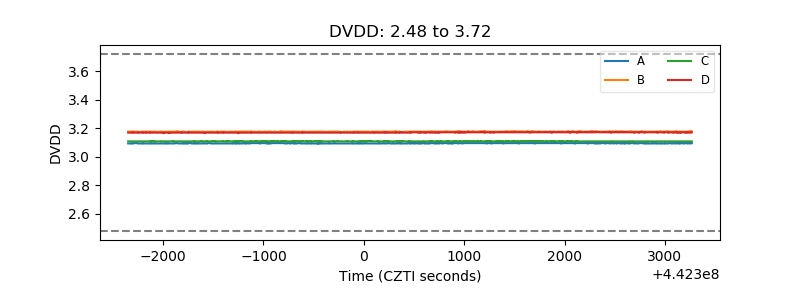 |
| Temperature 1 | 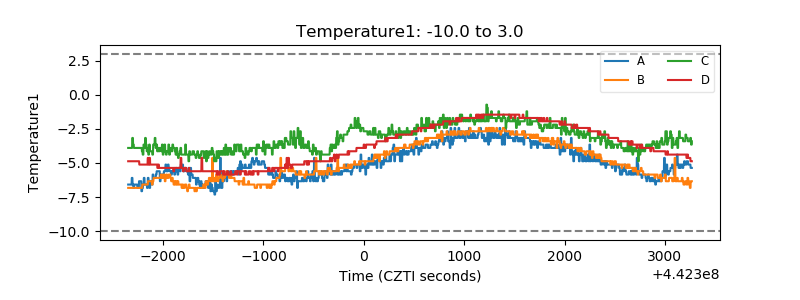 |
| Veto HV Monitor | 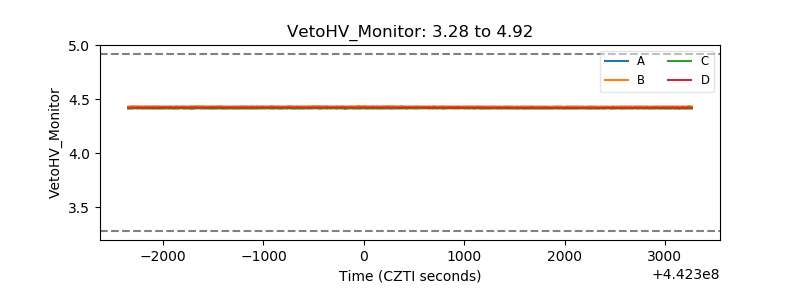 |
| Veto LLD | 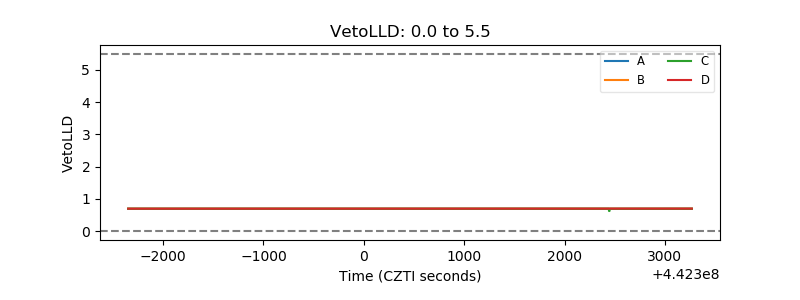 |
| Alpha Counter | 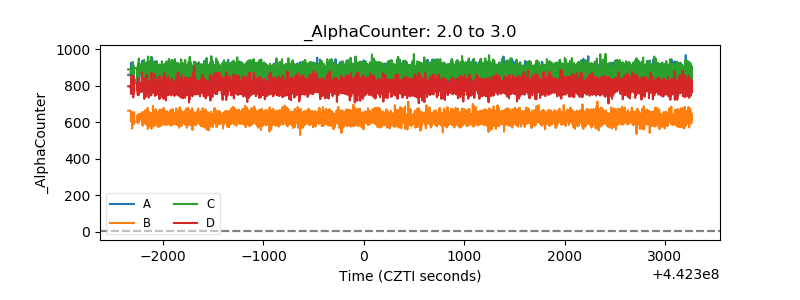 |
| _CPM_Rate | 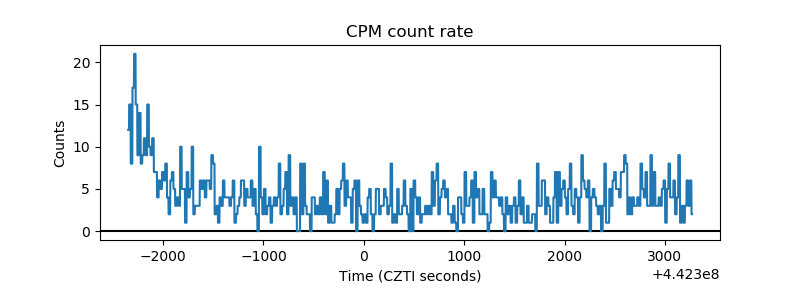 |
| CZT Counter | 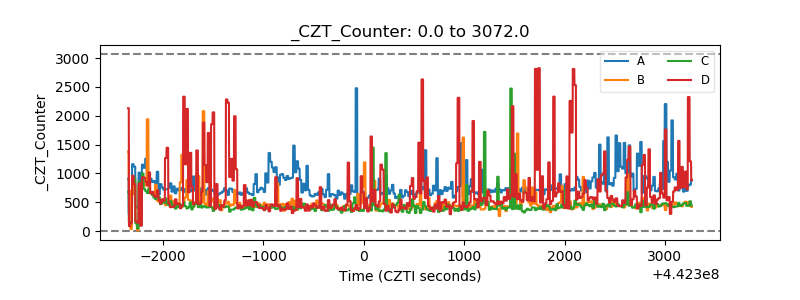 |
| +2.5 Volts monitor | 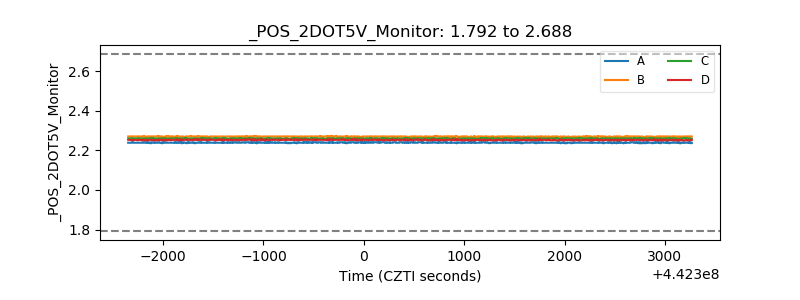 |
| +5 Volts monitor | 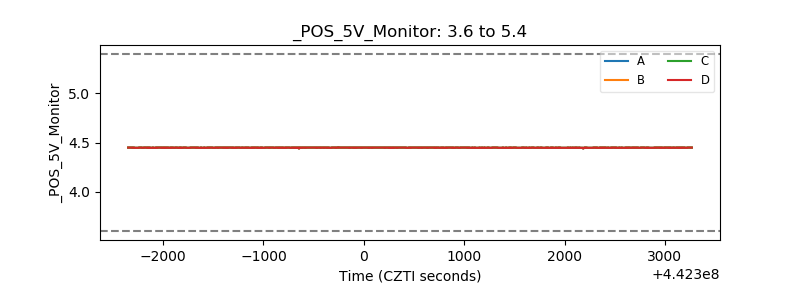 |
| _ROLL_ROT | 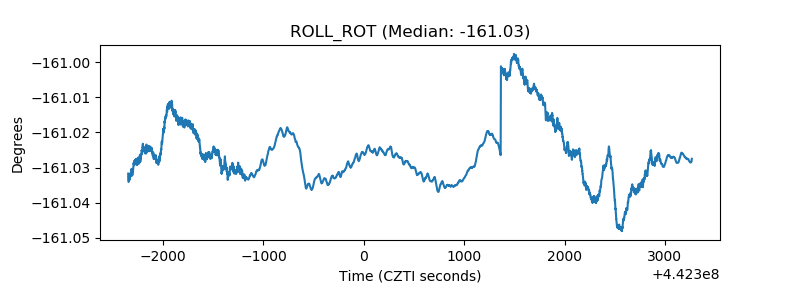 |
| _Roll_DEC | 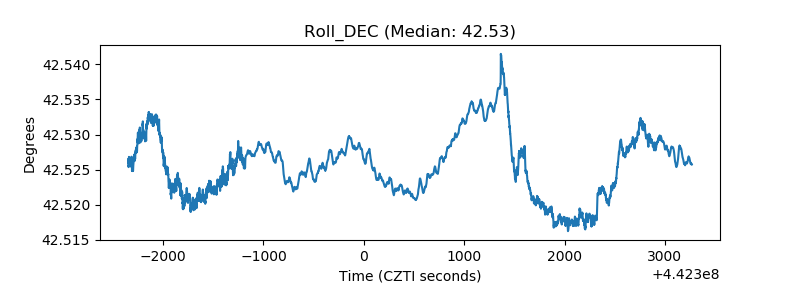 |
| _Roll_RA | 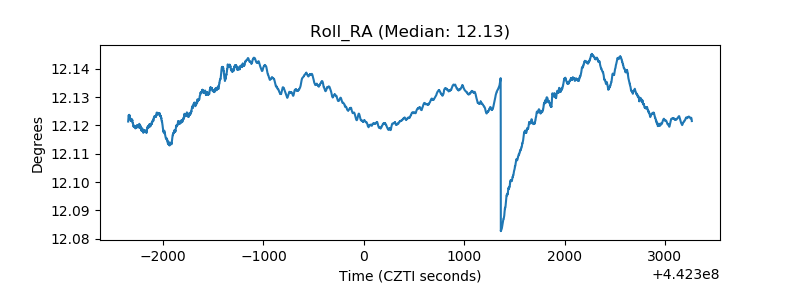 |
| Veto Counter | 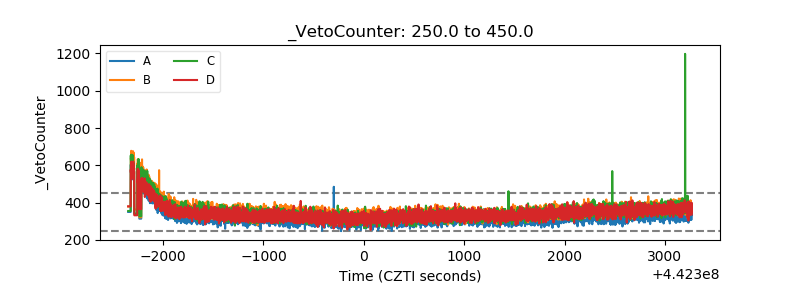 |