| Param | Original file | Final file |
|---|---|---|
| Filename | modeM0/AS1A13_004T12_9000006020_44754cztM0_level2.fits | modeM0/AS1A13_004T12_9000006020_44754cztM0_level2_quad_clean.evt |
| Size (bytes) | 152,896,320 | 34,142,400 |
| Size | 145.8 MB | 32.6 MB |
| Events in quadrant A | 1,858,598 | 218,392 |
| Events in quadrant B | 1,379,032 | 228,305 |
| Events in quadrant C | 1,031,067 | 228,642 |
| Events in quadrant D | 1,222,690 | 204,330 |
| Mode SS | |||
|---|---|---|---|
| Quadrant | BADHDUFLAG | Total packets | Discarded packets |
| A | 0 | 42 | 0 |
| B | 0 | 42 | 0 |
| C | 0 | 42 | 0 |
| D | 0 | 42 | 0 |
| Mode M0 | |||
|---|---|---|---|
| Quadrant | BADHDUFLAG | Total packets | Discarded packets |
| A | 0 | 7260 | 0 |
| B | 0 | 5532 | 0 |
| C | 0 | 4596 | 0 |
| D | 0 | 5207 | 0 |
| Quadrant | Total seconds | Saturated seconds | Saturation percentage |
|---|---|---|---|
| A | 2132 | 177 | 8.302064% |
| B | 2132 | 158 | 7.410882% |
| C | 2132 | 11 | 0.515947% |
| D | 2132 | 70 | 3.283302% |
Noise dominated data is calculated using 1-second bins in cleaned event files. If a bin has >2000 counts, and if more than 50% of those come from <1% of pixels, then it is considered to be noise-dominated and hence unusable.
| Quadrant | # 1 sec bins | Bins with >0 counts | Bins with >2000 counts | High rate bins dominated by noise | Noise dominated (total time) | Noise dominated (detector-on time) | Marked lightcurve |
|---|---|---|---|---|---|---|---|
| A | 2132 | 2132 | 41 | 41 | 1.92% | 1.92% | 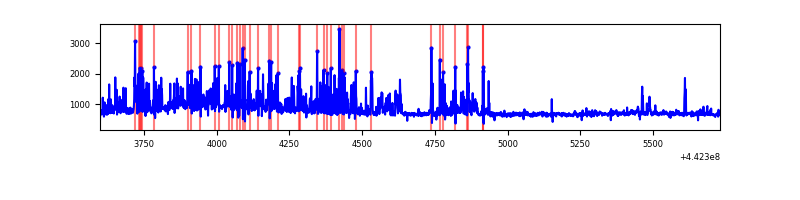 |
| B | 2132 | 2132 | 56 | 56 | 2.63% | 2.63% | 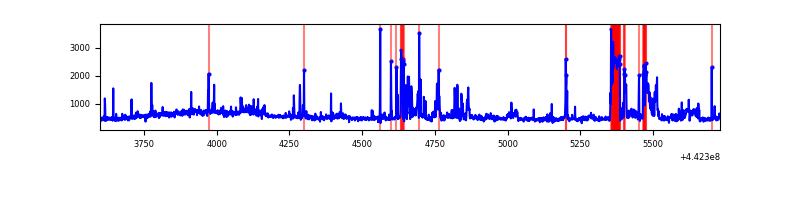 |
| C | 2132 | 2132 | 2 | 2 | 0.09% | 0.09% | 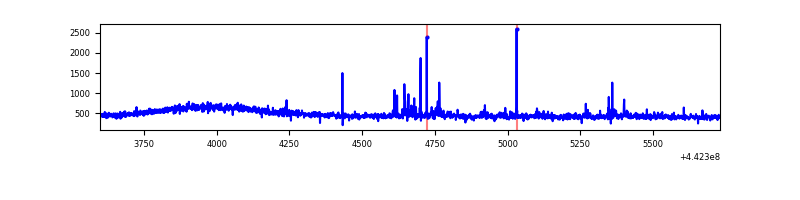 |
| D | 2132 | 2132 | 33 | 33 | 1.55% | 1.55% | 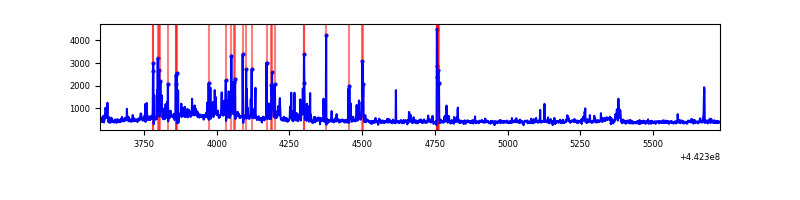 |
Top three noisy pixels from each quadrant. If the there are fewer than three noisy pixels in the level2.evt file, extra rows are filled as -1
| Pixel properties | Quadrant properties | ||||||
|---|---|---|---|---|---|---|---|
| Quadrant | DetID | PixID | Counts | Sigma | Mean | Median | Sigma |
| A | 10 | 83 | 546820 | 10039.4 | 251 | 244 | 54.4 |
| A | 15 | 223 | 331470 | 6083.89 | 251 | 244 | 54.4 |
| A | 13 | 248 | 6681 | 118.23 | 251 | 244 | 54.4 |
| B | 0 | 189 | 287975 | 5488.14 | 253 | 244 | 52.4 |
| B | 5 | 255 | 65050 | 1236.1 | 253 | 244 | 52.4 |
| B | 0 | 190 | 13625 | 255.23 | 253 | 244 | 52.4 |
| C | 14 | 254 | 32419 | 525.61 | 254 | 254 | 61.2 |
| C | 3 | 233 | 3925 | 59.99 | 254 | 254 | 61.2 |
| C | 1 | 3 | 2113 | 30.38 | 254 | 254 | 61.2 |
| D | 5 | 235 | 161092 | 2534.49 | 246 | 237 | 63.5 |
| D | 13 | 249 | 40566 | 635.44 | 246 | 237 | 63.5 |
| D | 2 | 249 | 37976 | 594.63 | 246 | 237 | 63.5 |
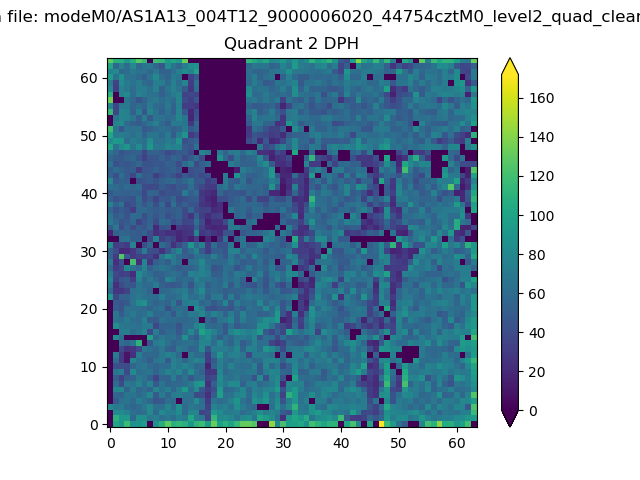
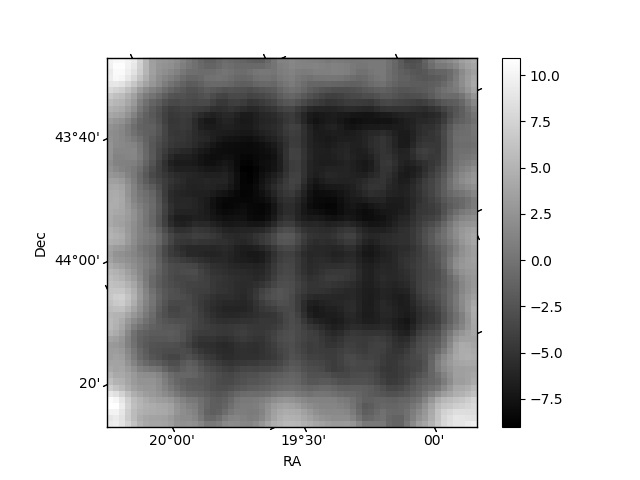
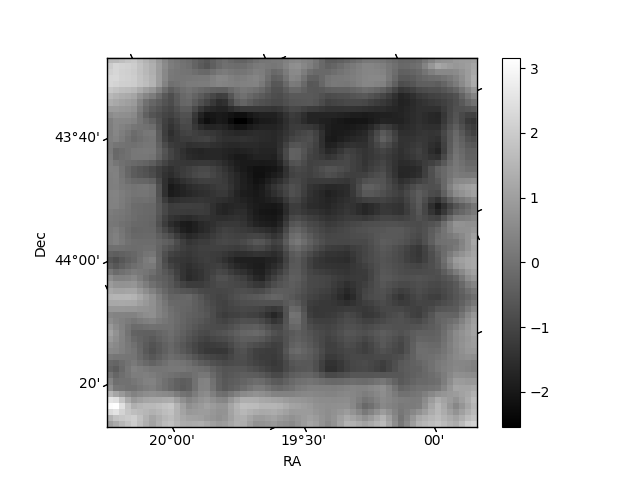
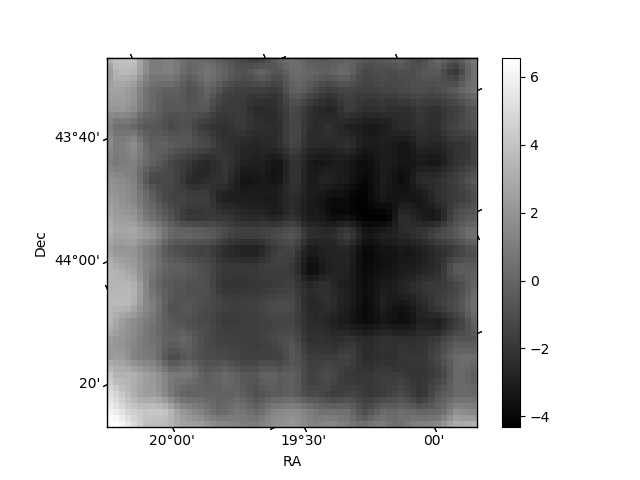
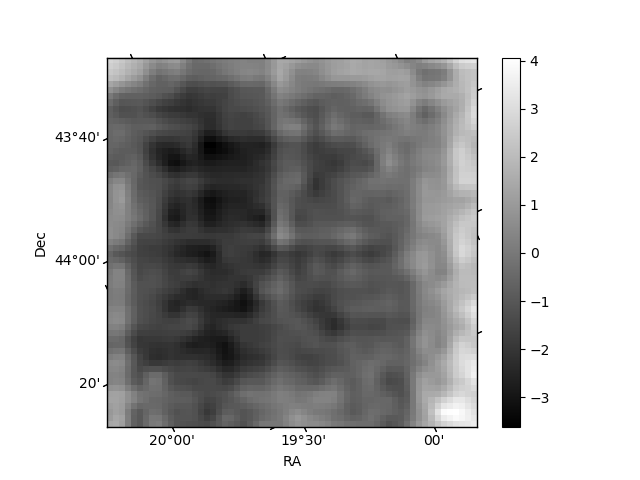
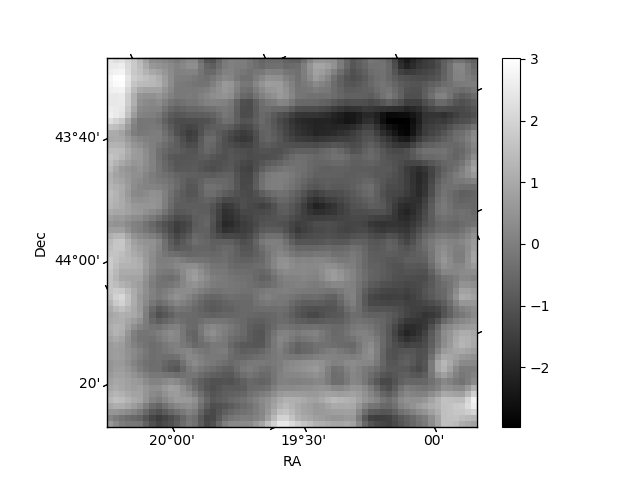
Histogram calculated using DETX and DETY for each event in the final _common_clean file
| Quadrant A | 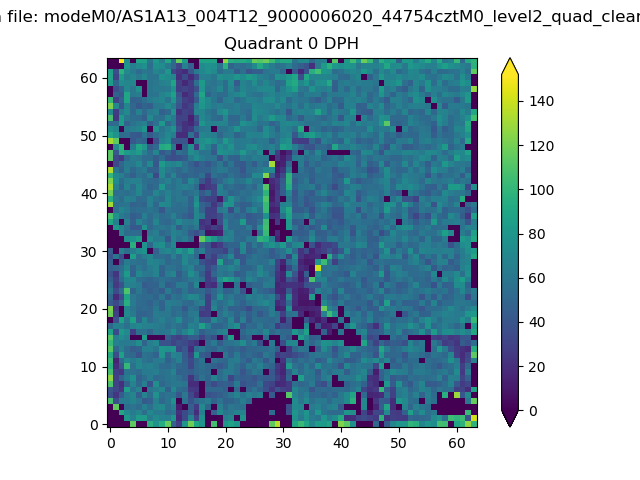 |
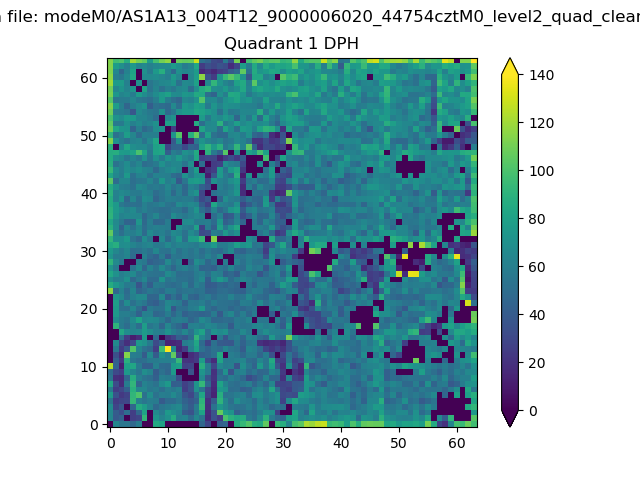 |
Quadrant B |
|---|---|---|---|
| Quadrant D | 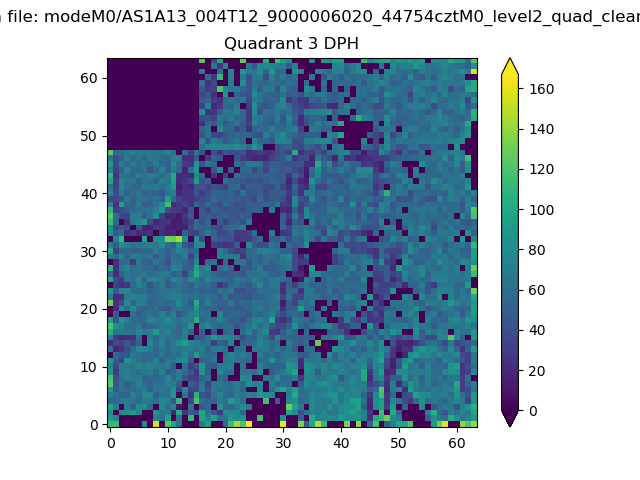 |
 |
Quadrant C |
| Plot type | Count rate plots | Images |
|---|---|---|
| Comparison with Poisson distribution Blue bars denote a histogram of data divided into 1 sec bins. Red curve is a Poisson curve with rate = median count rate of data. |
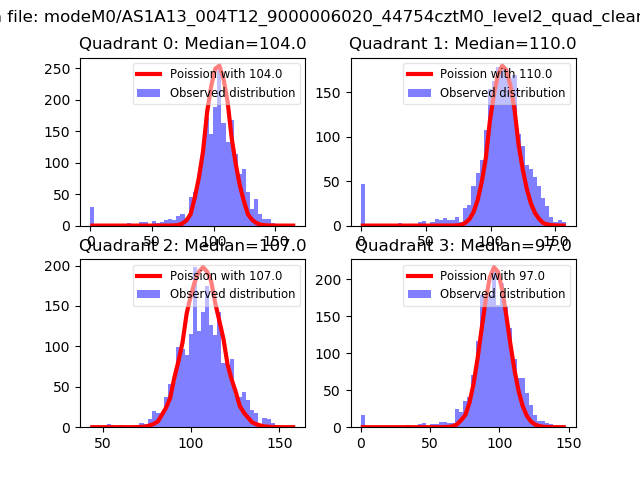 |
 |
| Quadrant-wise count rates Data is divided into 100 sec bins |
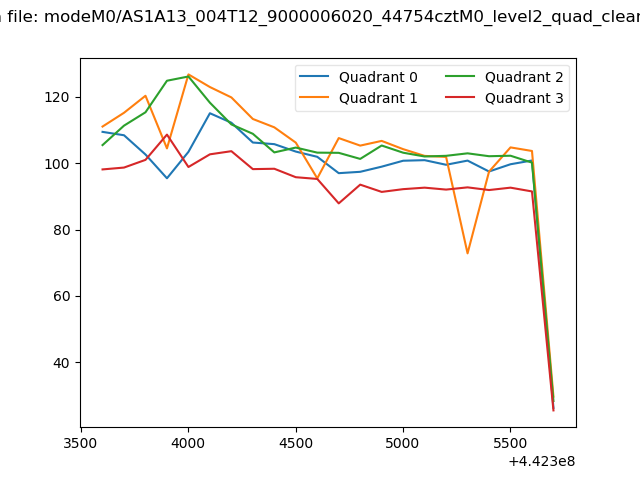 |
|
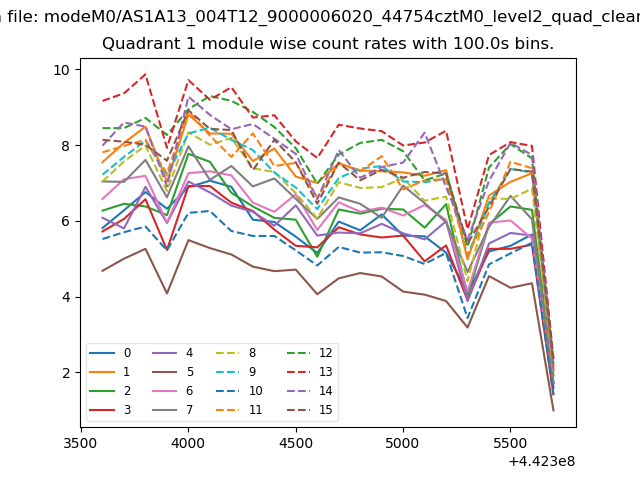
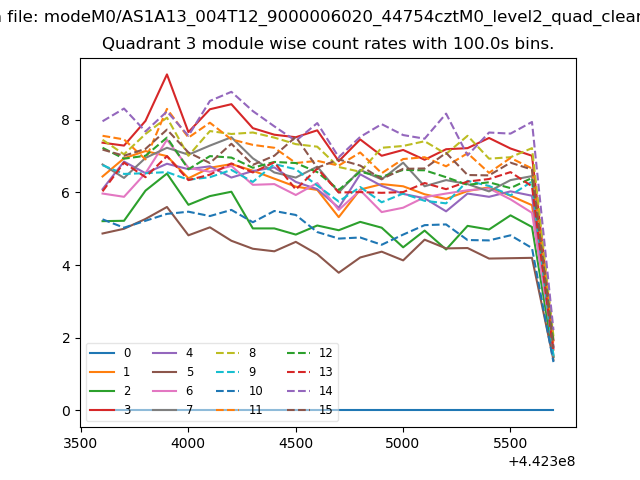
| Module-wise count rates for Quadrant A Data is divided into 100 sec bins |
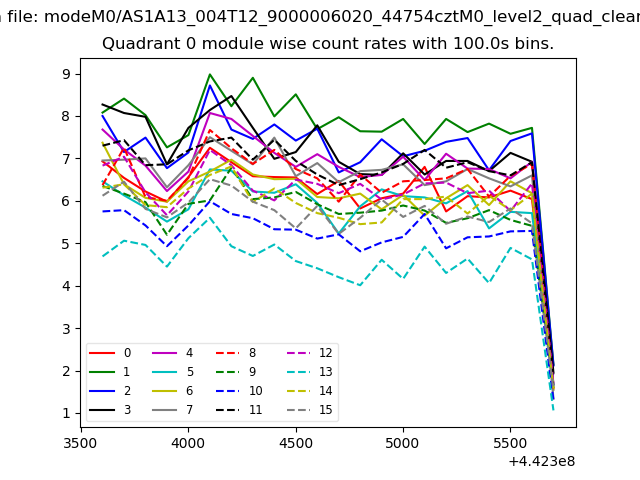 |
 |
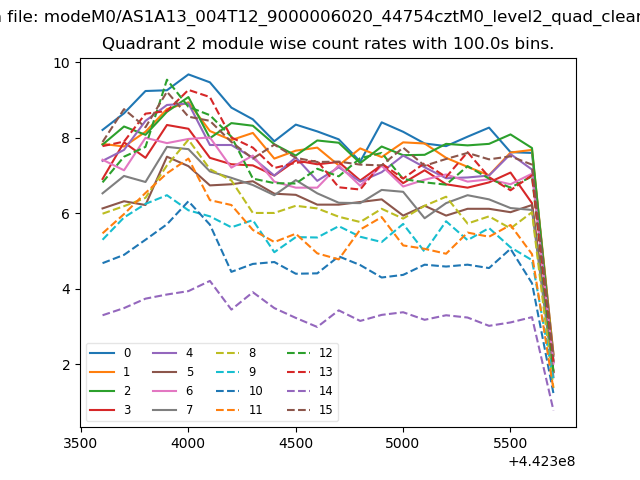
| Module-wise count rates for Quadrant B Data is divided into 100 sec bins |
 |
 |
| Module-wise count rates for Quadrant C Data is divided into 100 sec bins |
 |
 |
| Module-wise count rates for Quadrant D Data is divided into 100 sec bins |
 |
 |
| Parameter | Plot |
|---|---|
| CZT HV Monitor | 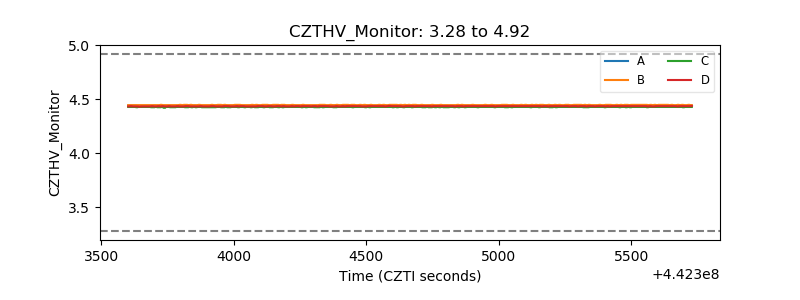 |
| D_VDD | 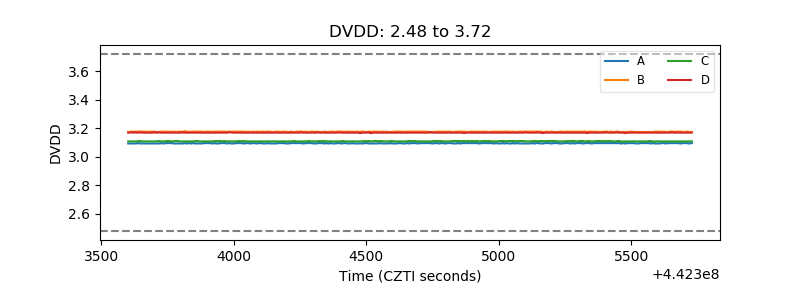 |
| Temperature 1 | 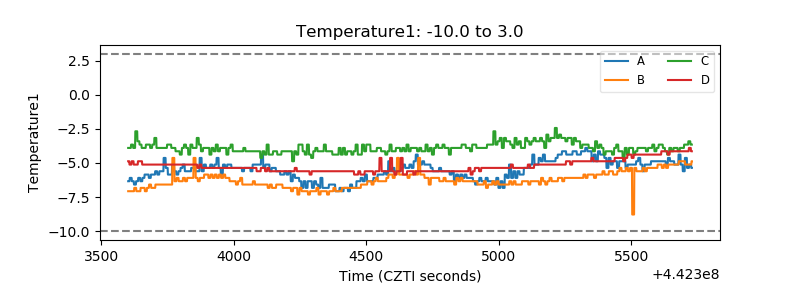 |
| Veto HV Monitor | 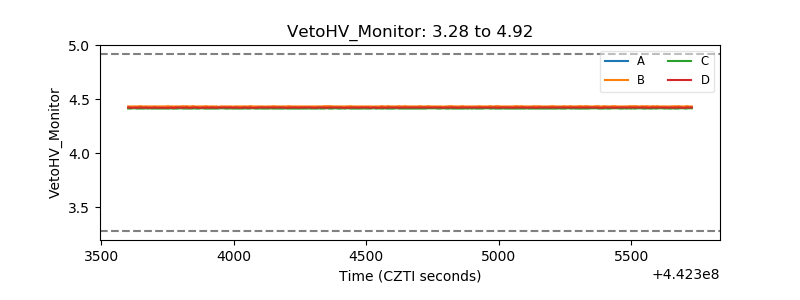 |
| Veto LLD | 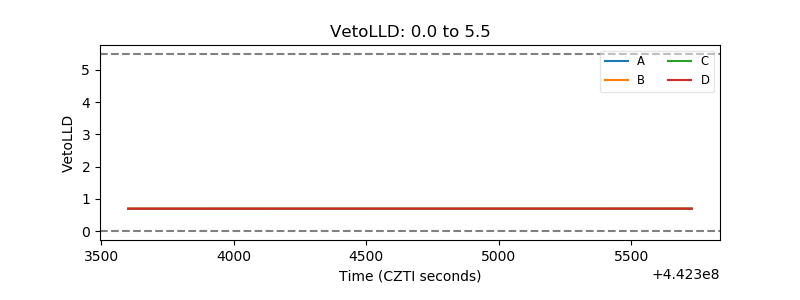 |
| Alpha Counter | 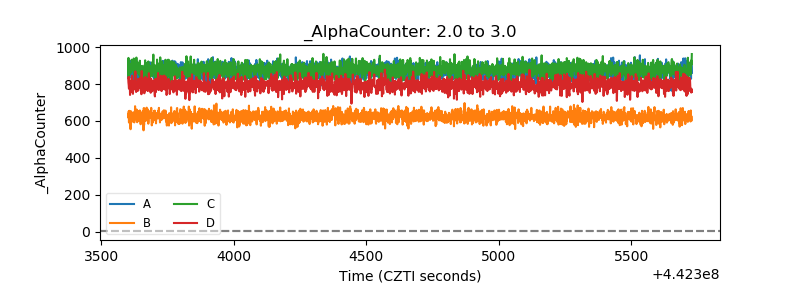 |
| _CPM_Rate | 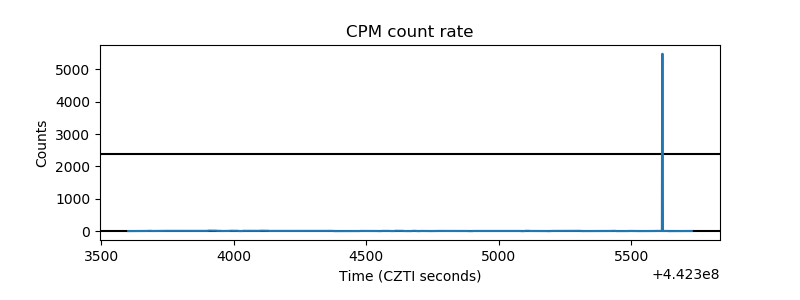 |
| CZT Counter | 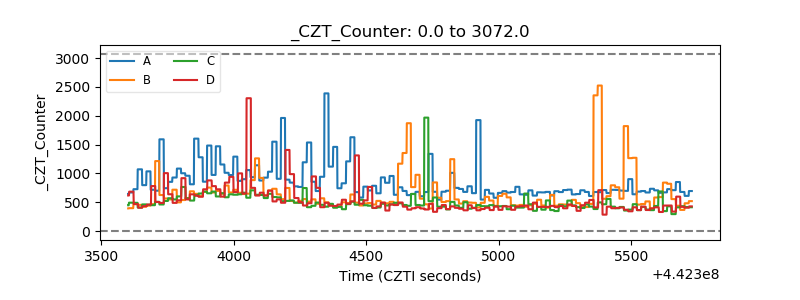 |
| +2.5 Volts monitor | 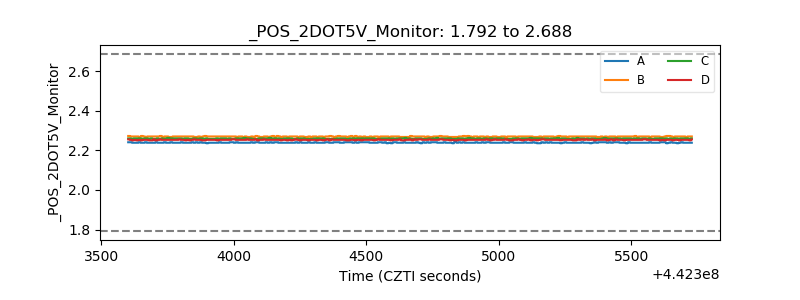 |
| +5 Volts monitor | 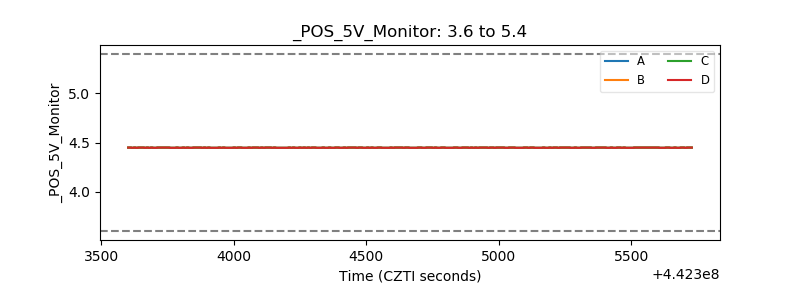 |
| _ROLL_ROT | 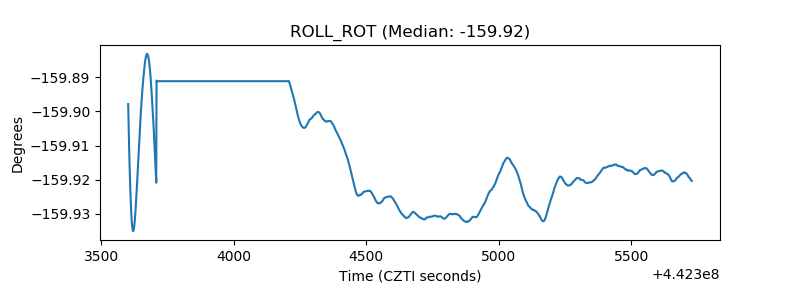 |
| _Roll_DEC | 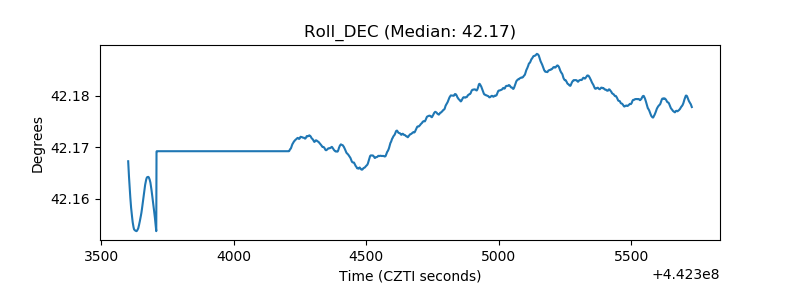 |
| _Roll_RA | 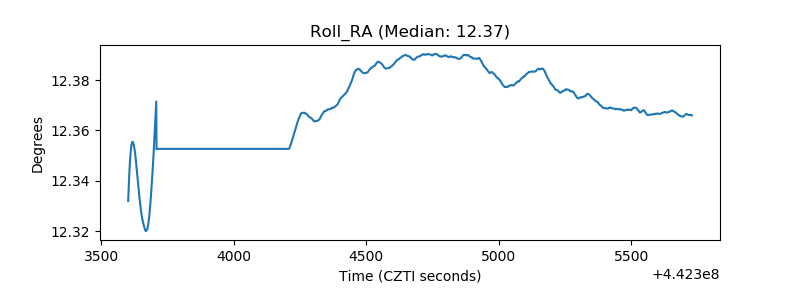 |
| Veto Counter | 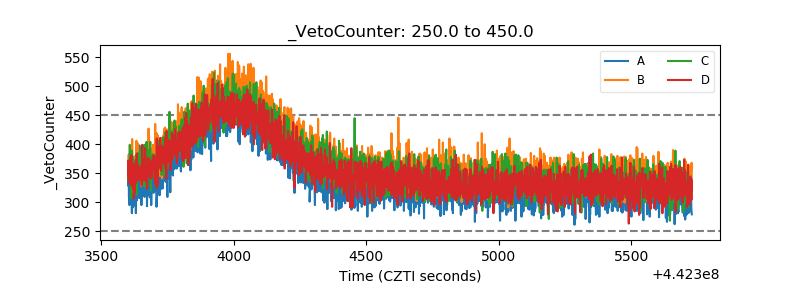 |