| Param | Original file | Final file |
|---|---|---|
| Filename | modeM0/AS1A13_004T12_9000006020_44761cztM0_level2.fits | modeM0/AS1A13_004T12_9000006020_44761cztM0_level2_quad_clean.evt |
| Size (bytes) | 576,996,480 | 98,712,000 |
| Size | 550.3 MB | 94.1 MB |
| Events in quadrant A | 6,538,819 | 652,619 |
| Events in quadrant B | 3,889,880 | 689,746 |
| Events in quadrant C | 2,979,197 | 678,519 |
| Events in quadrant D | 7,462,898 | 528,484 |
| Mode SS | |||
|---|---|---|---|
| Quadrant | BADHDUFLAG | Total packets | Discarded packets |
| A | 0 | 128 | 0 |
| B | 0 | 128 | 0 |
| C | 0 | 128 | 0 |
| D | 0 | 128 | 0 |
| Mode M0 | |||
|---|---|---|---|
| Quadrant | BADHDUFLAG | Total packets | Discarded packets |
| A | 0 | 24118 | 3 |
| B | 0 | 15806 | 1 |
| C | 0 | 13438 | 1 |
| D | 0 | 26584 | 1 |
| Mode M9 | |||
|---|---|---|---|
| Quadrant | BADHDUFLAG | Total packets | Discarded packets |
| A | 0 | 11 | 0 |
| B | 0 | 11 | 0 |
| C | 0 | 11 | 0 |
| D | 0 | 11 | 0 |
| Quadrant | Total seconds | Saturated seconds | Saturation percentage |
|---|---|---|---|
| A | 6294 | 617 | 9.802987% |
| B | 6294 | 255 | 4.051478% |
| C | 6294 | 55 | 0.873848% |
| D | 6295 | 1216 | 19.316918% |
Noise dominated data is calculated using 1-second bins in cleaned event files. If a bin has >2000 counts, and if more than 50% of those come from <1% of pixels, then it is considered to be noise-dominated and hence unusable.
| Quadrant | # 1 sec bins | Bins with >0 counts | Bins with >2000 counts | High rate bins dominated by noise | Noise dominated (total time) | Noise dominated (detector-on time) | Marked lightcurve |
|---|---|---|---|---|---|---|---|
| A | 7349 | 6295 | 438 | 438 | 5.96% | 6.96% | 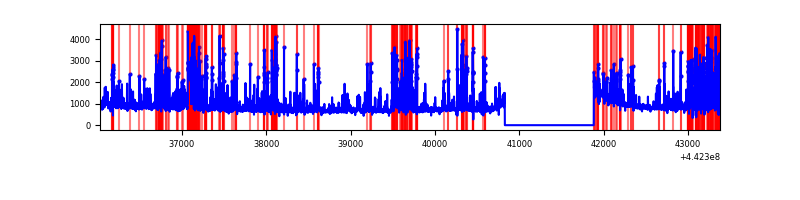 |
| B | 7349 | 6295 | 156 | 156 | 2.12% | 2.48% | 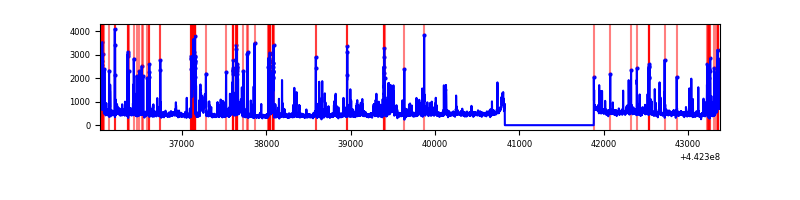 |
| C | 7349 | 6295 | 28 | 28 | 0.38% | 0.44% | 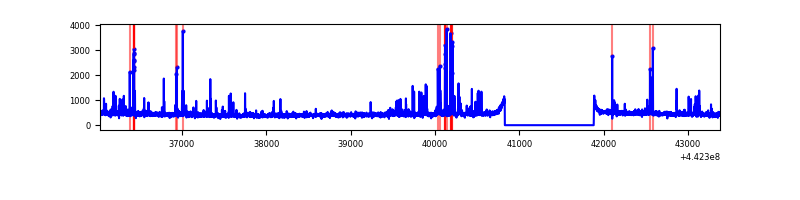 |
| D | 7350 | 6295 | 1072 | 1072 | 14.59% | 17.03% | 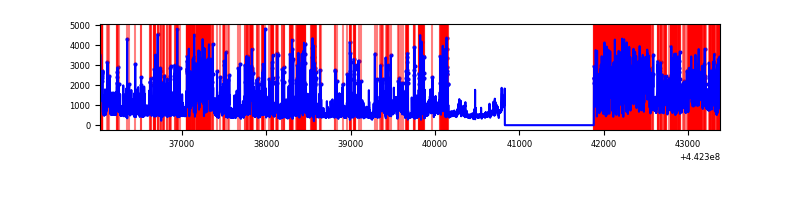 |
Top three noisy pixels from each quadrant. If the there are fewer than three noisy pixels in the level2.evt file, extra rows are filled as -1
| Pixel properties | Quadrant properties | ||||||
|---|---|---|---|---|---|---|---|
| Quadrant | DetID | PixID | Counts | Sigma | Mean | Median | Sigma |
| A | 10 | 83 | 1893811 | 13727.89 | 673 | 660 | 137.9 |
| A | 15 | 223 | 1879960 | 13627.46 | 673 | 660 | 137.9 |
| A | 13 | 248 | 142018 | 1025.04 | 673 | 660 | 137.9 |
| B | 0 | 189 | 746157 | 5545.96 | 685 | 666 | 134.4 |
| B | 5 | 255 | 201403 | 1493.35 | 685 | 666 | 134.4 |
| B | 15 | 36 | 73858 | 544.5 | 685 | 666 | 134.4 |
| C | 14 | 254 | 171349 | 1059.31 | 686 | 691 | 161.1 |
| C | 1 | 3 | 108546 | 669.48 | 686 | 691 | 161.1 |
| C | 12 | 16 | 11075 | 64.46 | 686 | 691 | 161.1 |
| D | 1 | 52 | 3229438 | 20285.59 | 631 | 610 | 159.2 |
| D | 13 | 249 | 716790 | 4499.51 | 631 | 610 | 159.2 |
| D | 5 | 222 | 291483 | 1827.45 | 631 | 610 | 159.2 |
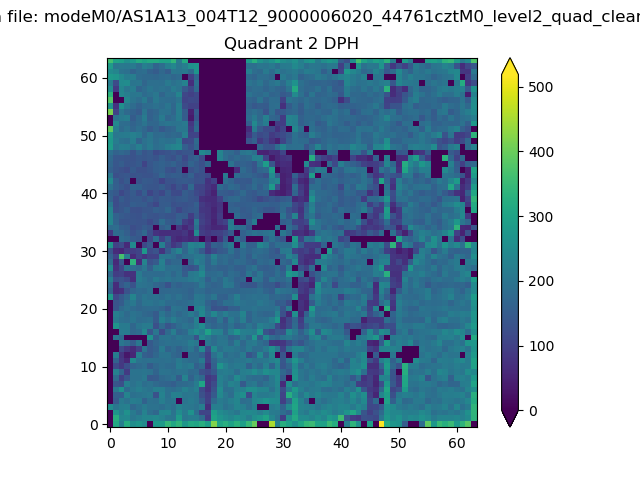
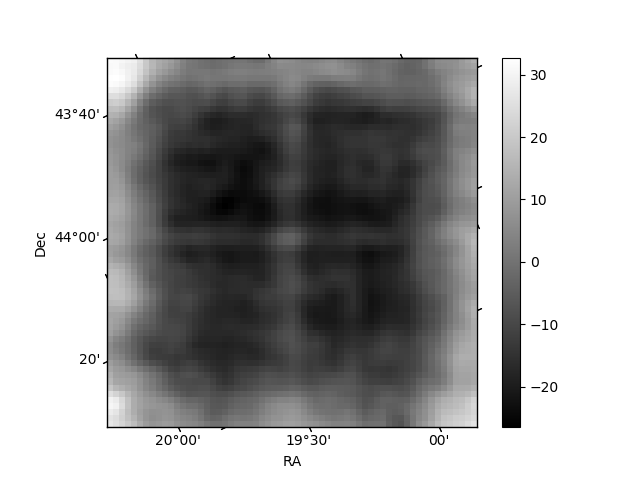
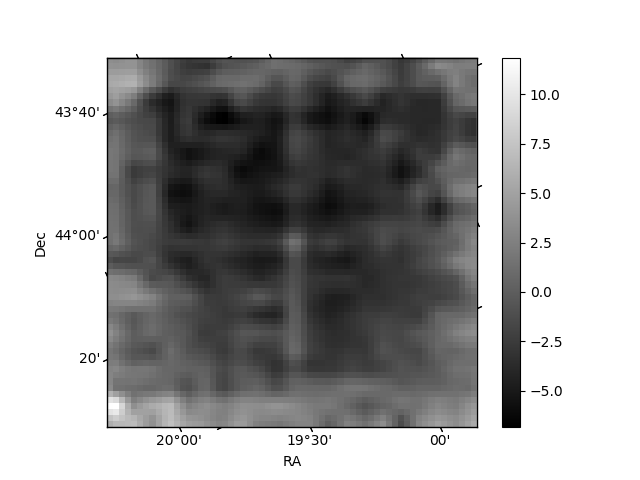
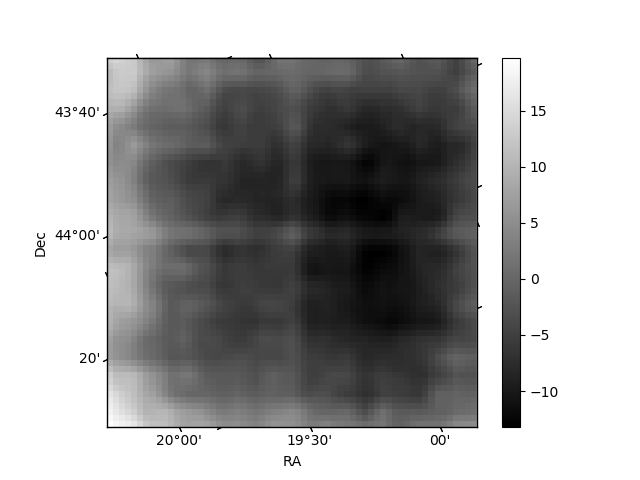
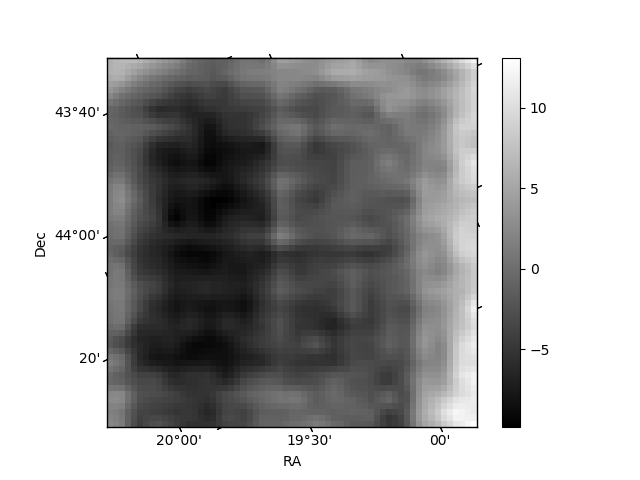
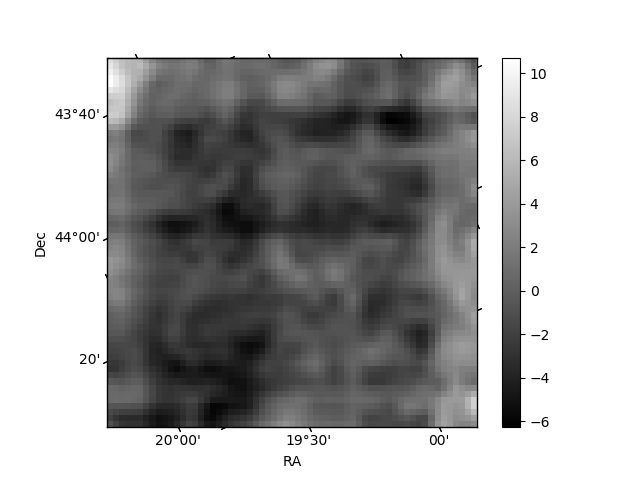
Histogram calculated using DETX and DETY for each event in the final _common_clean file
| Quadrant A | 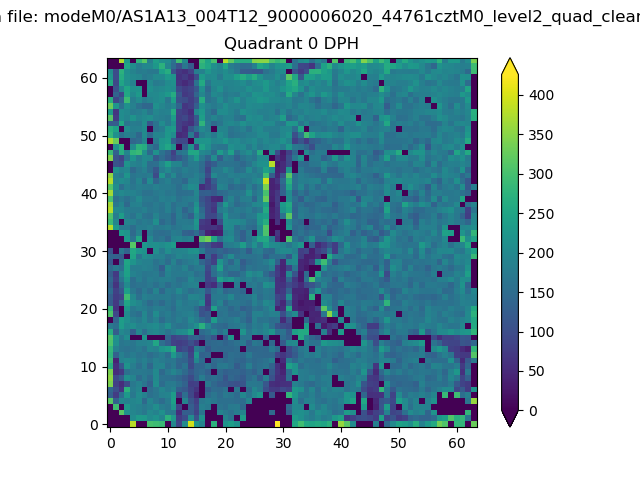 |
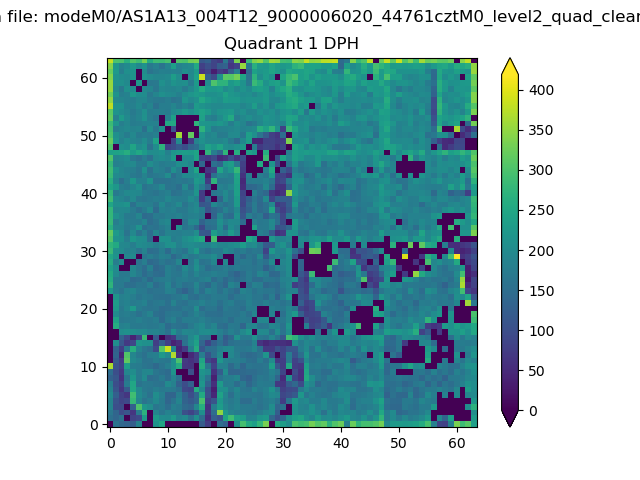 |
Quadrant B |
|---|---|---|---|
| Quadrant D | 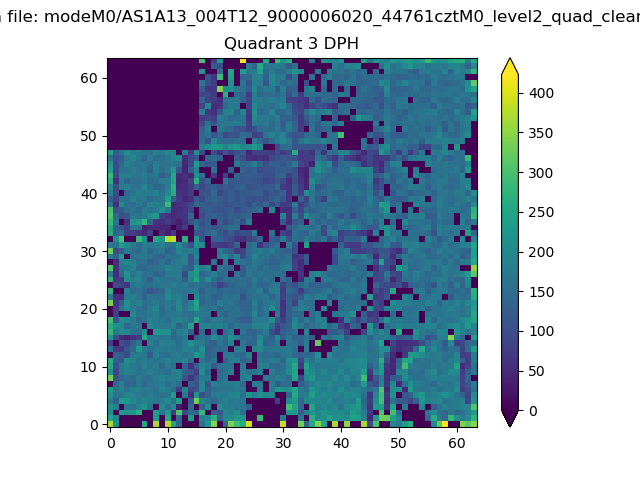 |
 |
Quadrant C |
| Plot type | Count rate plots | Images |
|---|---|---|
| Comparison with Poisson distribution Blue bars denote a histogram of data divided into 1 sec bins. Red curve is a Poisson curve with rate = median count rate of data. |
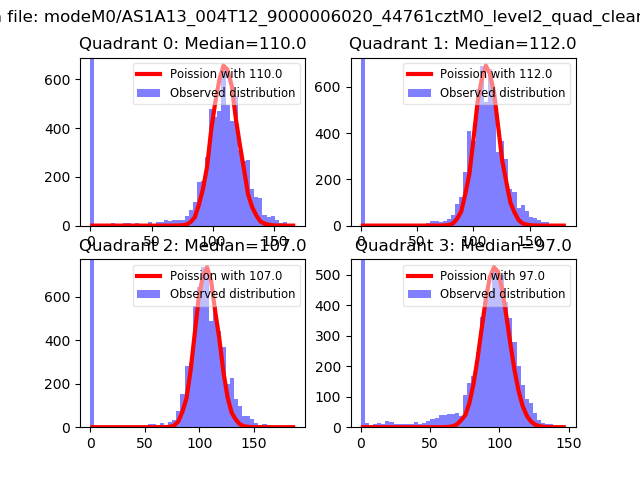 |
 |
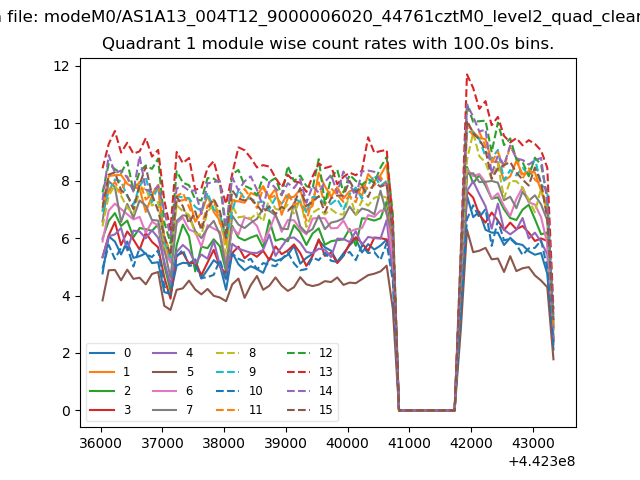
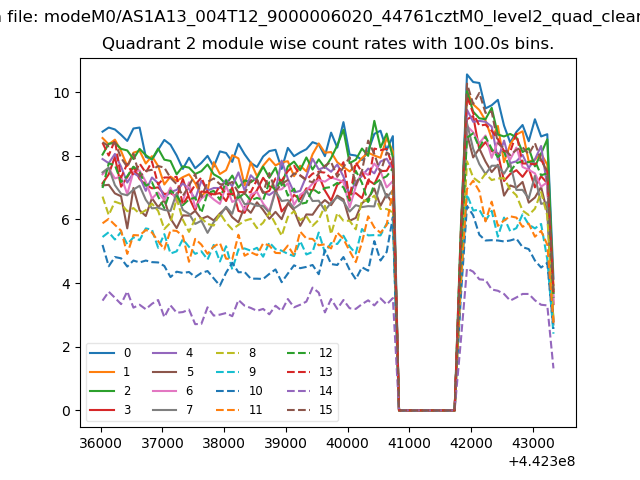
| Quadrant-wise count rates Data is divided into 100 sec bins |
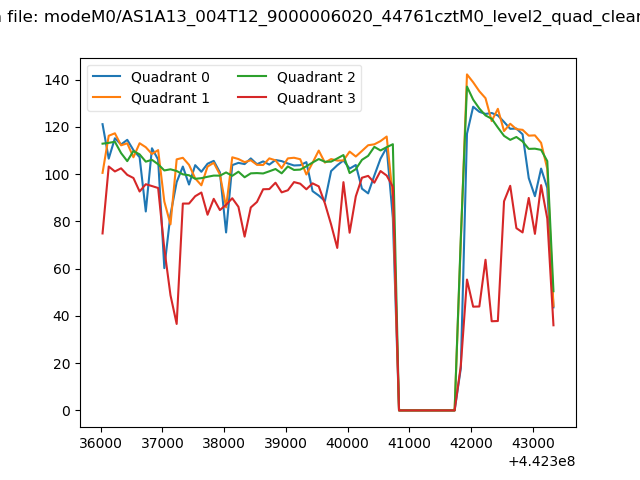 |
|
| Module-wise count rates for Quadrant A Data is divided into 100 sec bins |
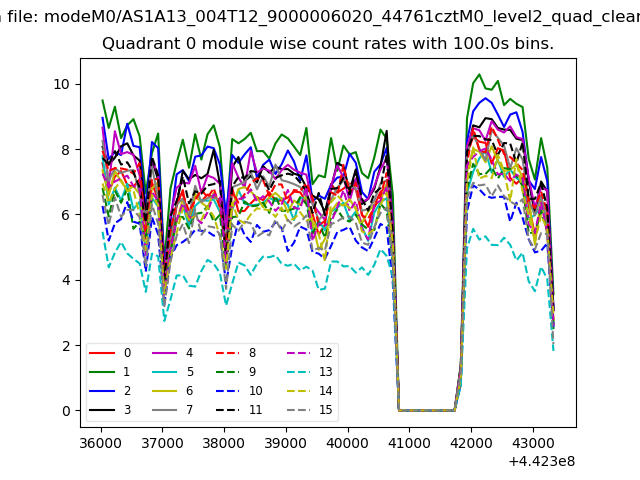 |
 |
| Module-wise count rates for Quadrant B Data is divided into 100 sec bins |
 |
 |
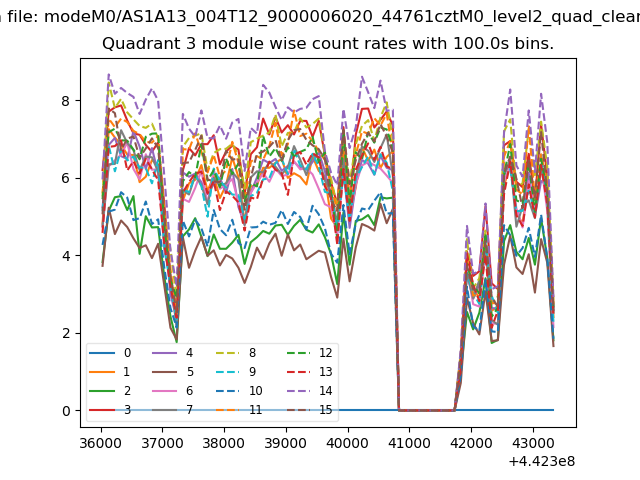
| Module-wise count rates for Quadrant C Data is divided into 100 sec bins |
 |
 |
| Module-wise count rates for Quadrant D Data is divided into 100 sec bins |
 |
 |
| Parameter | Plot |
|---|---|
| CZT HV Monitor | 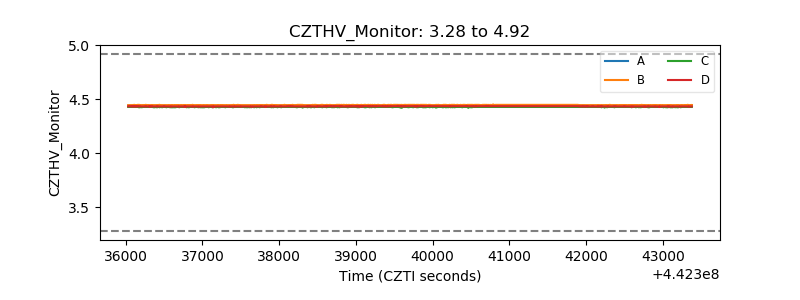 |
| D_VDD | 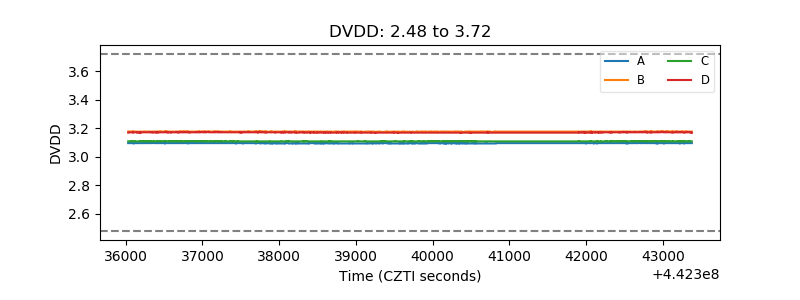 |
| Temperature 1 | 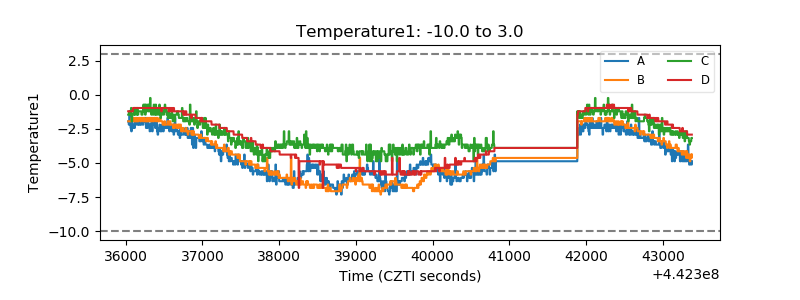 |
| Veto HV Monitor | 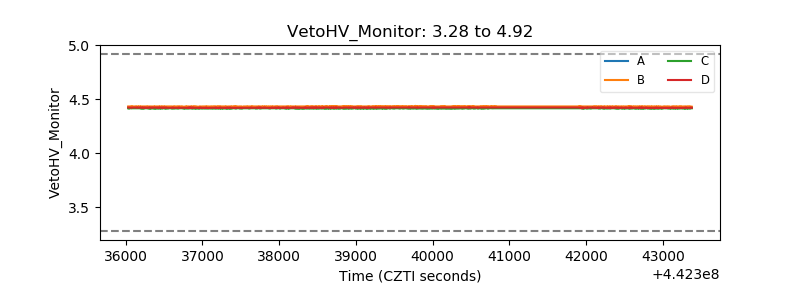 |
| Veto LLD | 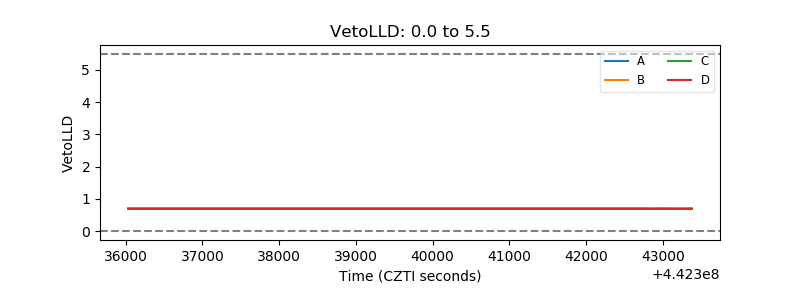 |
| Alpha Counter | 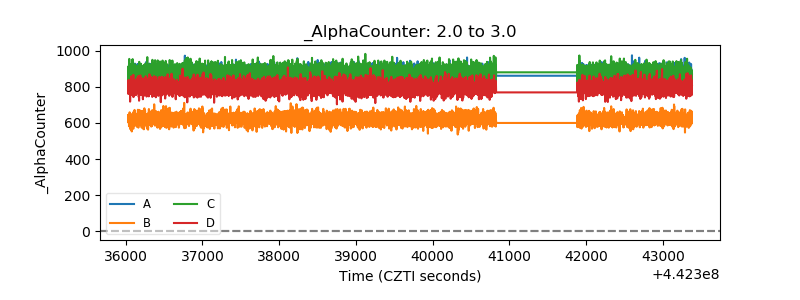 |
| _CPM_Rate | 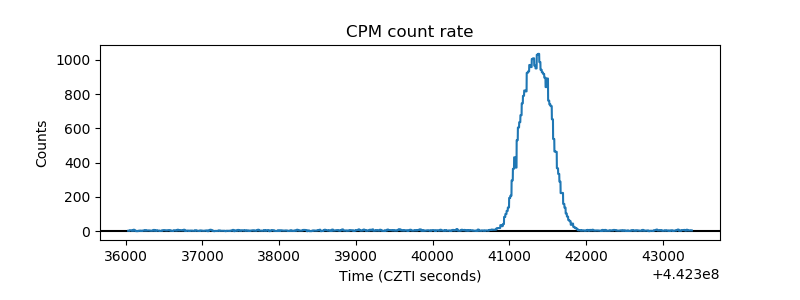 |
| CZT Counter | 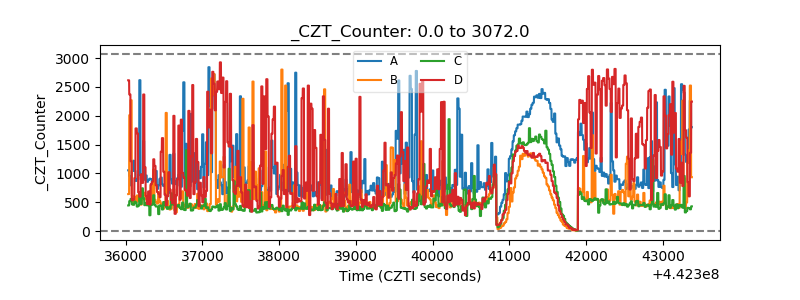 |
| +2.5 Volts monitor | 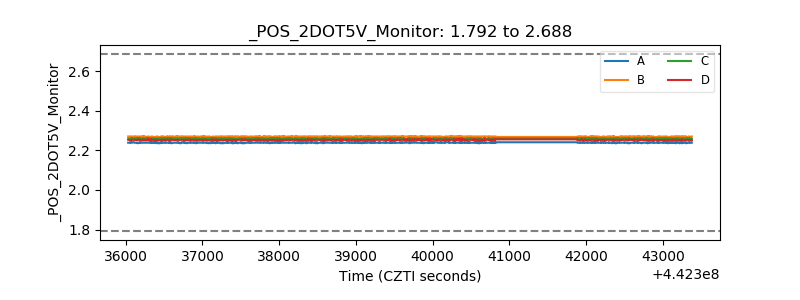 |
| +5 Volts monitor | 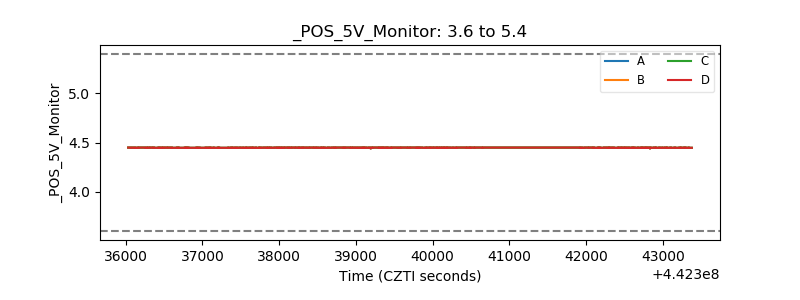 |
| _ROLL_ROT | 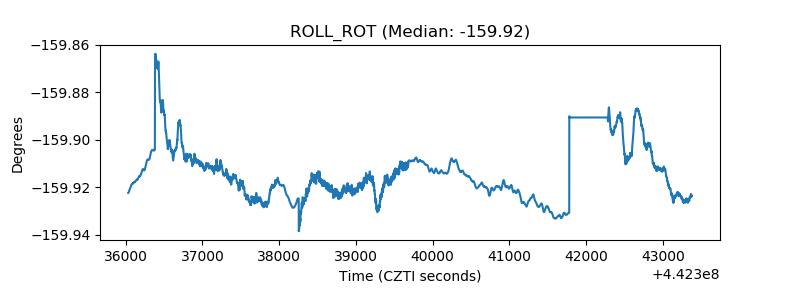 |
| _Roll_DEC | 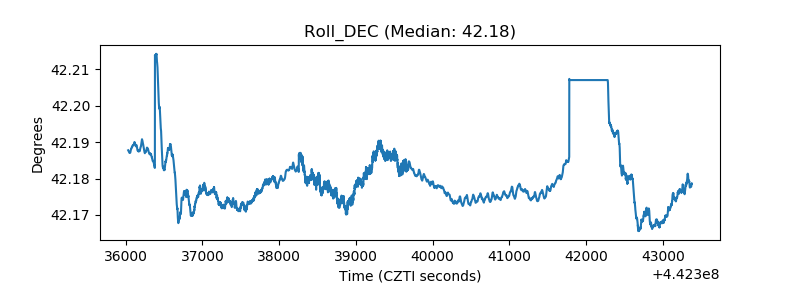 |
| _Roll_RA | 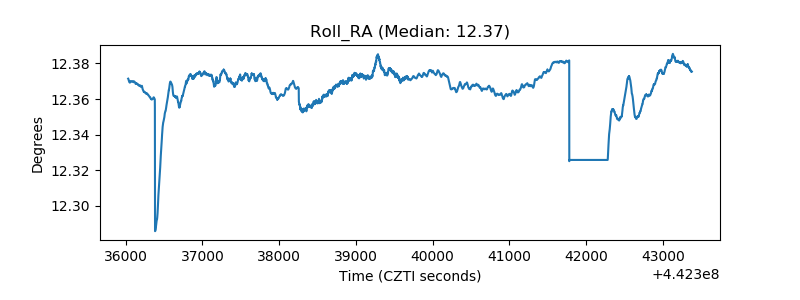 |
| Veto Counter | 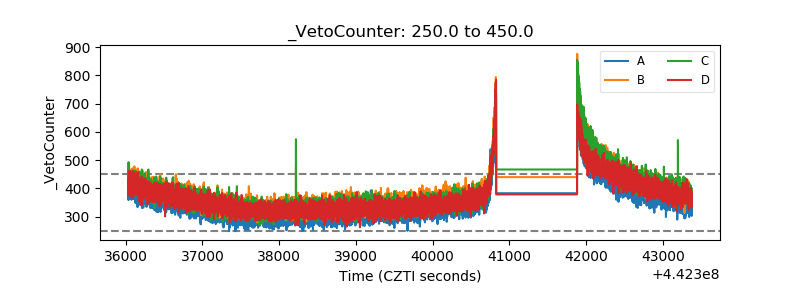 |