| Param | Original file | Final file |
|---|---|---|
| Filename | modeM0/AS1A13_004T12_9000006020_44764cztM0_level2.fits | modeM0/AS1A13_004T12_9000006020_44764cztM0_level2_quad_clean.evt |
| Size (bytes) | 647,507,520 | 101,571,840 |
| Size | 617.5 MB | 96.9 MB |
| Events in quadrant A | 10,217,571 | 520,309 |
| Events in quadrant B | 3,545,298 | 773,944 |
| Events in quadrant C | 3,015,471 | 747,118 |
| Events in quadrant D | 6,693,884 | 587,276 |
| Mode SS | |||
|---|---|---|---|
| Quadrant | BADHDUFLAG | Total packets | Discarded packets |
| A | 0 | 130 | 0 |
| B | 0 | 130 | 0 |
| C | 0 | 130 | 0 |
| D | 0 | 130 | 0 |
| Mode M0 | |||
|---|---|---|---|
| Quadrant | BADHDUFLAG | Total packets | Discarded packets |
| A | 0 | 34943 | 2 |
| B | 0 | 14874 | 2 |
| C | 0 | 13453 | 2 |
| D | 0 | 24342 | 4 |
| Mode M9 | |||
|---|---|---|---|
| Quadrant | BADHDUFLAG | Total packets | Discarded packets |
| A | 0 | 16 | 0 |
| B | 0 | 17 | 0 |
| C | 0 | 17 | 0 |
| D | 0 | 17 | 0 |
| Quadrant | Total seconds | Saturated seconds | Saturation percentage |
|---|---|---|---|
| A | 6404 | 2210 | 34.509681% |
| B | 6404 | 92 | 1.436602% |
| C | 6404 | 35 | 0.546533% |
| D | 6403 | 1043 | 16.289239% |
Noise dominated data is calculated using 1-second bins in cleaned event files. If a bin has >2000 counts, and if more than 50% of those come from <1% of pixels, then it is considered to be noise-dominated and hence unusable.
| Quadrant | # 1 sec bins | Bins with >0 counts | Bins with >2000 counts | High rate bins dominated by noise | Noise dominated (total time) | Noise dominated (detector-on time) | Marked lightcurve |
|---|---|---|---|---|---|---|---|
| A | 7649 | 6404 | 1986 | 1986 | 25.96% | 31.01% | 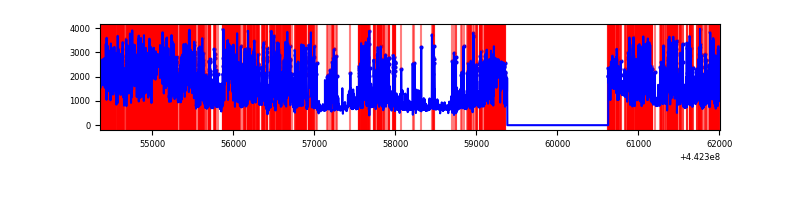 |
| B | 7649 | 6405 | 36 | 36 | 0.47% | 0.56% | 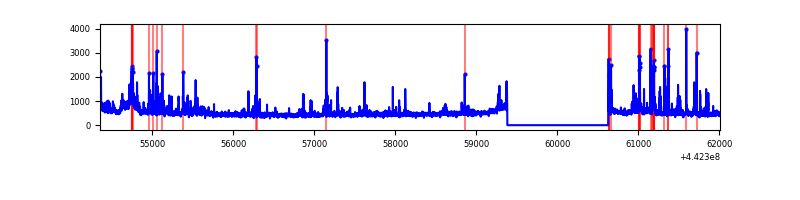 |
| C | 7649 | 6405 | 10 | 10 | 0.13% | 0.16% | 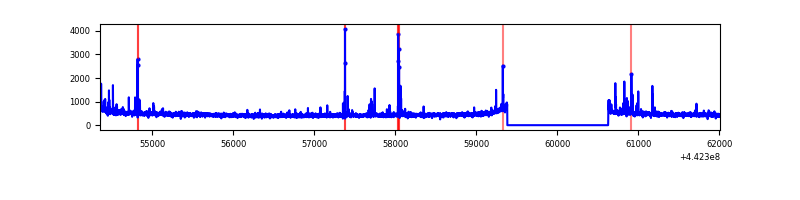 |
| D | 7648 | 6404 | 899 | 899 | 11.75% | 14.04% | 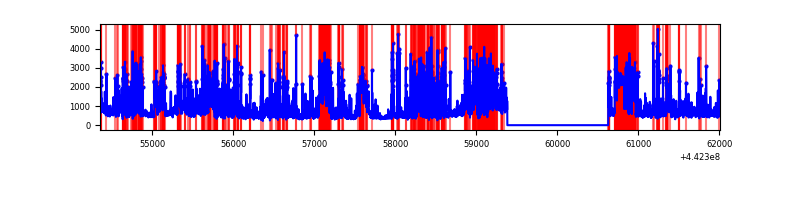 |
Top three noisy pixels from each quadrant. If the there are fewer than three noisy pixels in the level2.evt file, extra rows are filled as -1
| Pixel properties | Quadrant properties | ||||||
|---|---|---|---|---|---|---|---|
| Quadrant | DetID | PixID | Counts | Sigma | Mean | Median | Sigma |
| A | 15 | 223 | 5881865 | 44939.14 | 635 | 622 | 130.9 |
| A | 10 | 83 | 1814244 | 13858.06 | 635 | 622 | 130.9 |
| A | 13 | 248 | 52350 | 395.26 | 635 | 622 | 130.9 |
| B | 5 | 255 | 143881 | 1005.2 | 737 | 716 | 142.4 |
| B | 0 | 189 | 138761 | 969.25 | 737 | 716 | 142.4 |
| B | 0 | 219 | 104615 | 729.5 | 737 | 716 | 142.4 |
| C | 14 | 254 | 79409 | 460.71 | 733 | 737 | 170.8 |
| C | 12 | 2 | 25149 | 142.96 | 733 | 737 | 170.8 |
| C | 1 | 3 | 18810 | 105.84 | 733 | 737 | 170.8 |
| D | 1 | 52 | 1732042 | 10334.86 | 671 | 650 | 167.5 |
| D | 7 | 38 | 781377 | 4660.24 | 671 | 650 | 167.5 |
| D | 2 | 249 | 651488 | 3884.92 | 671 | 650 | 167.5 |
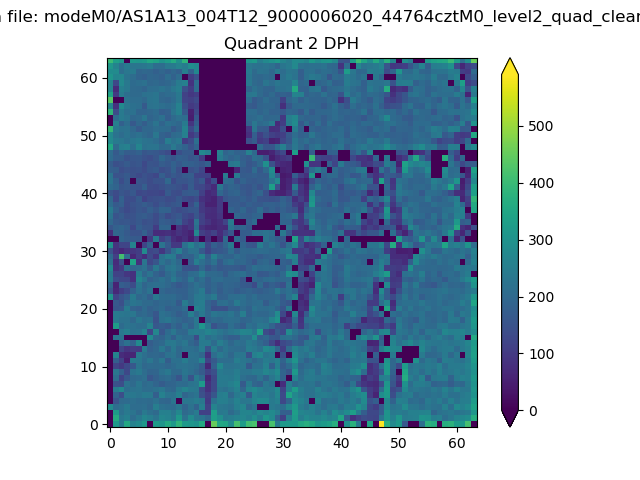
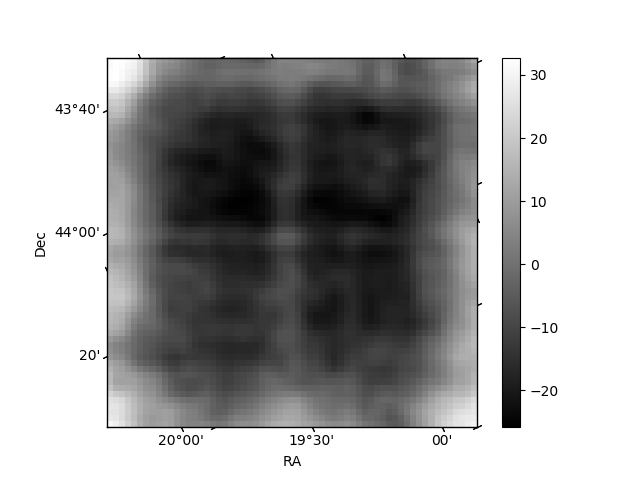
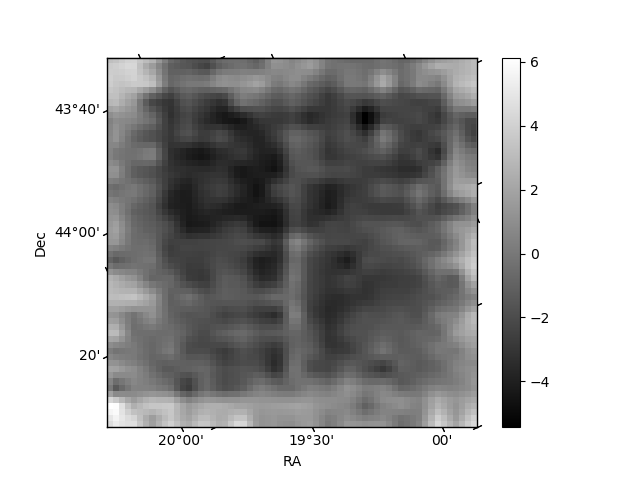
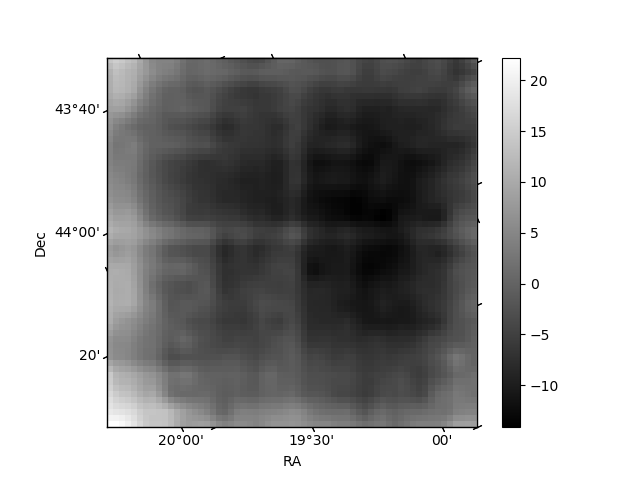
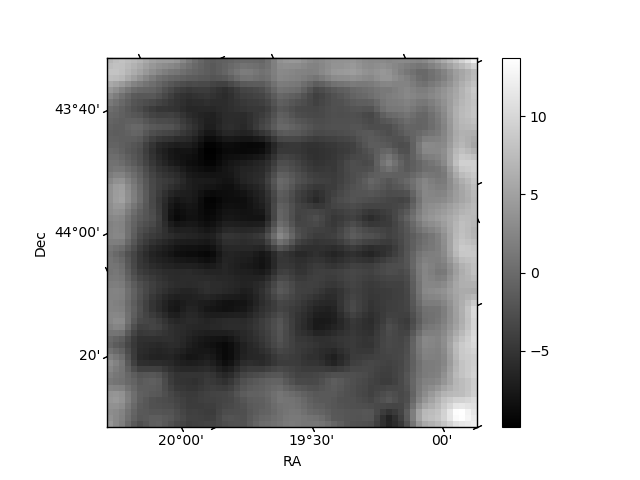
Histogram calculated using DETX and DETY for each event in the final _common_clean file
| Quadrant A | 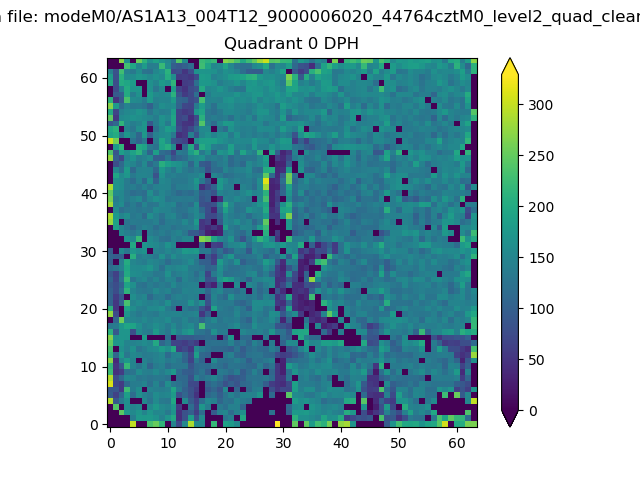 |
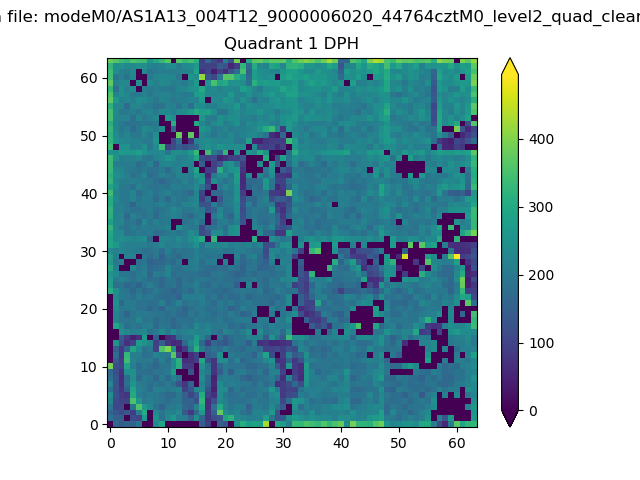 |
Quadrant B |
|---|---|---|---|
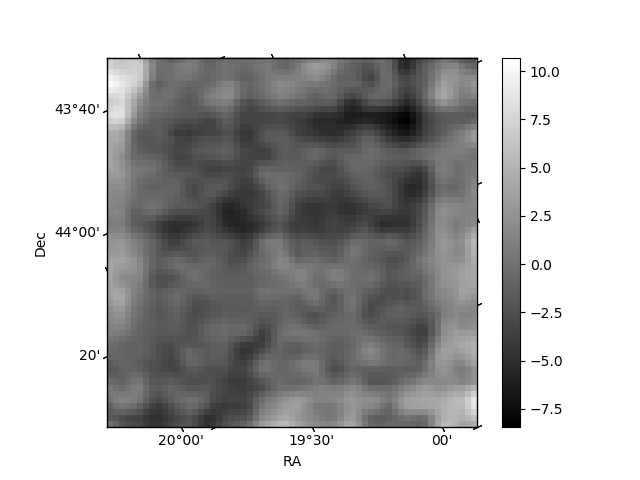
| Quadrant D | 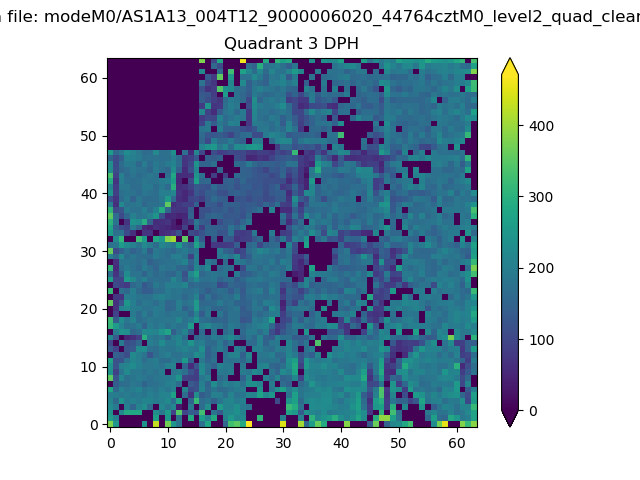 |
 |
Quadrant C |
| Plot type | Count rate plots | Images |
|---|---|---|
| Comparison with Poisson distribution Blue bars denote a histogram of data divided into 1 sec bins. Red curve is a Poisson curve with rate = median count rate of data. |
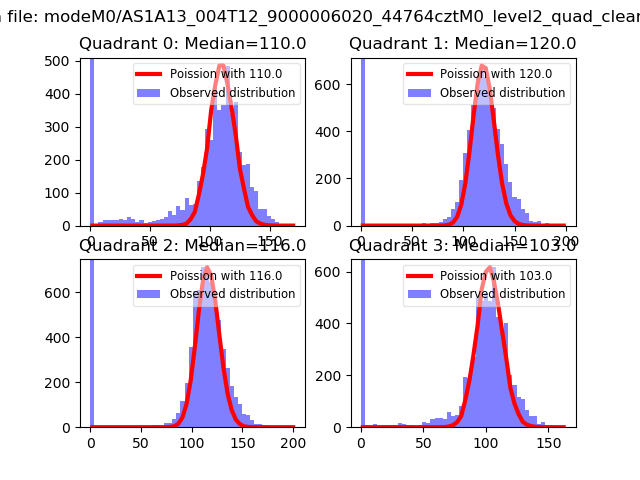 |
 |
| Quadrant-wise count rates Data is divided into 100 sec bins |
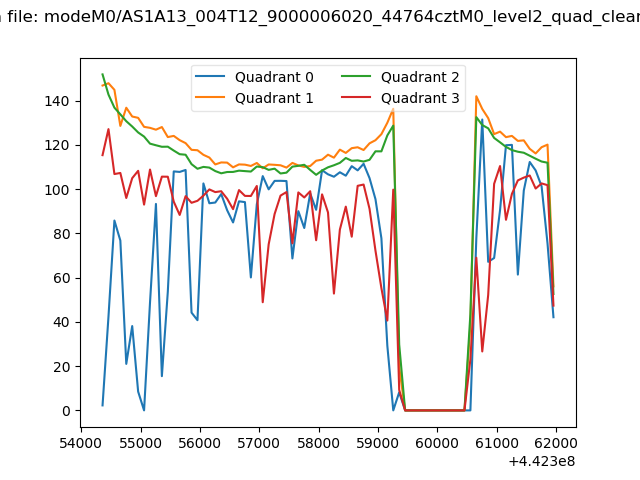 |
|
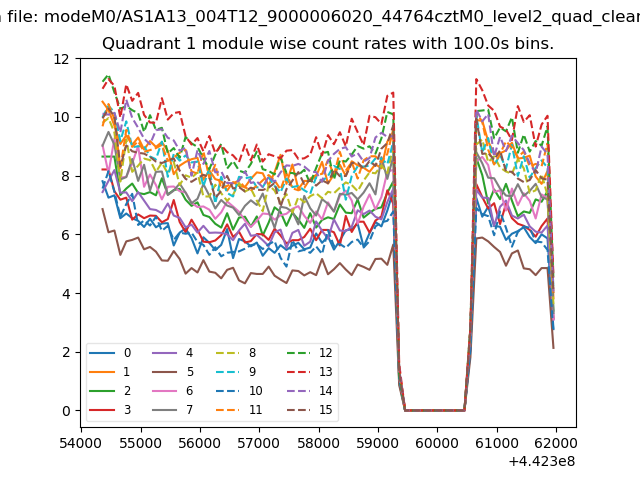
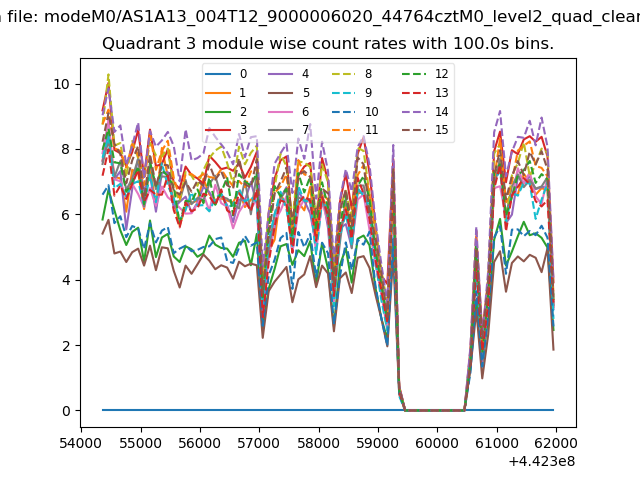
| Module-wise count rates for Quadrant A Data is divided into 100 sec bins |
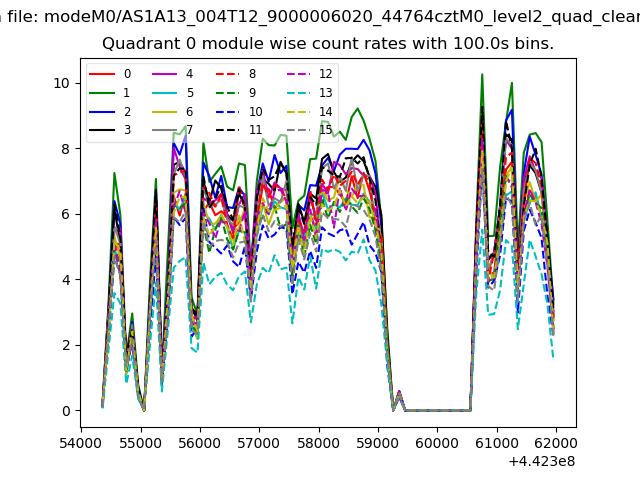 |
 |
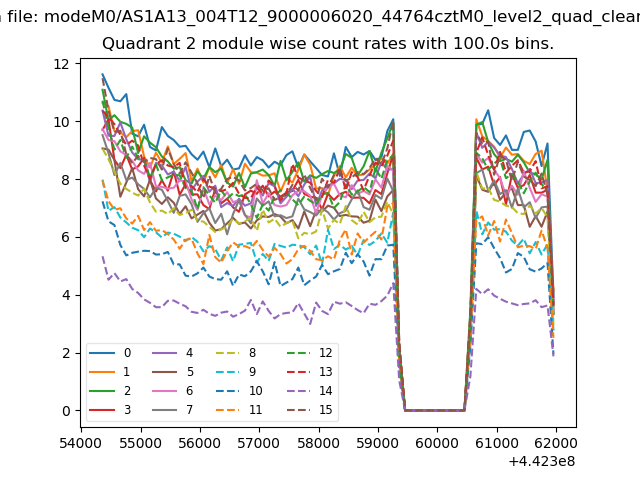
| Module-wise count rates for Quadrant B Data is divided into 100 sec bins |
 |
 |
| Module-wise count rates for Quadrant C Data is divided into 100 sec bins |
 |
 |
| Module-wise count rates for Quadrant D Data is divided into 100 sec bins |
 |
 |
| Parameter | Plot |
|---|---|
| CZT HV Monitor |  |
| D_VDD | 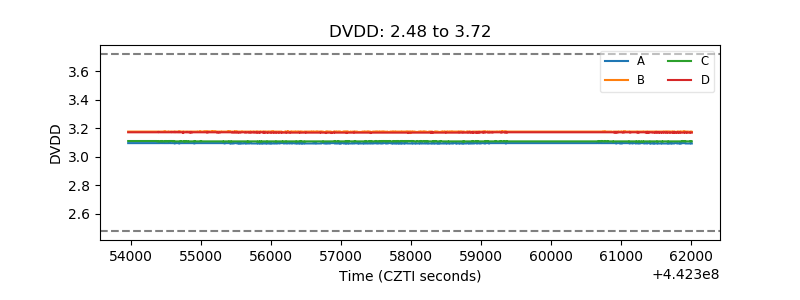 |
| Temperature 1 | 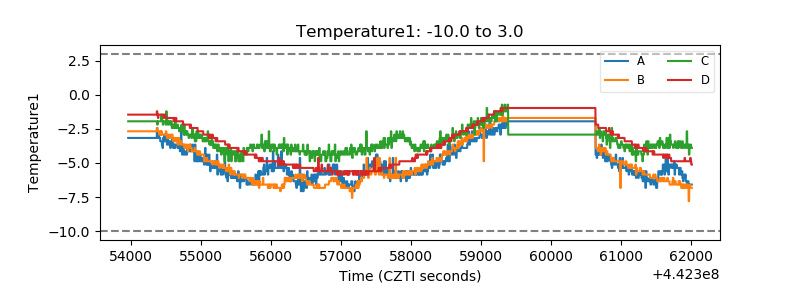 |
| Veto HV Monitor | 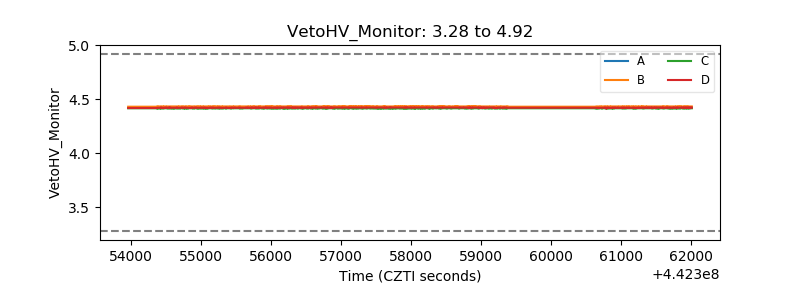 |
| Veto LLD | 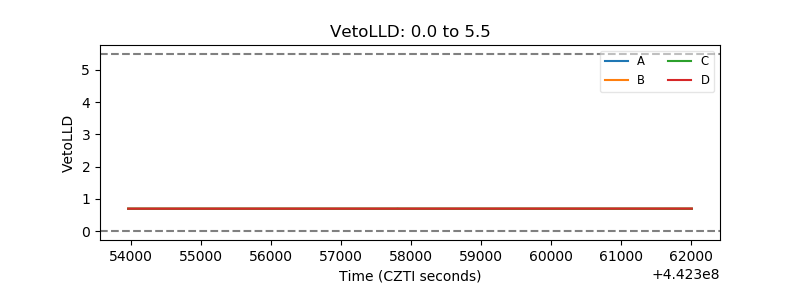 |
| Alpha Counter | 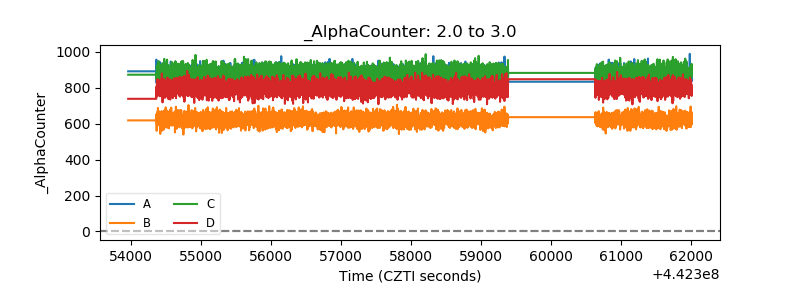 |
| _CPM_Rate | 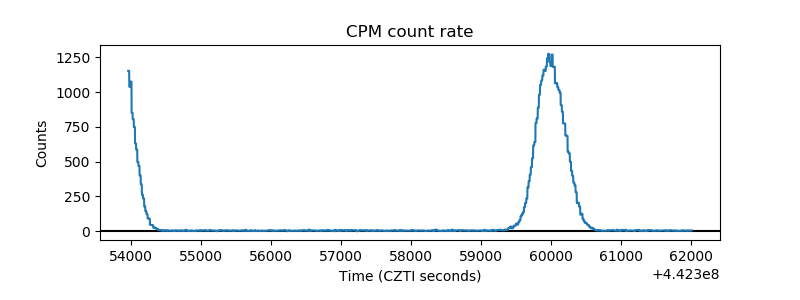 |
| CZT Counter | 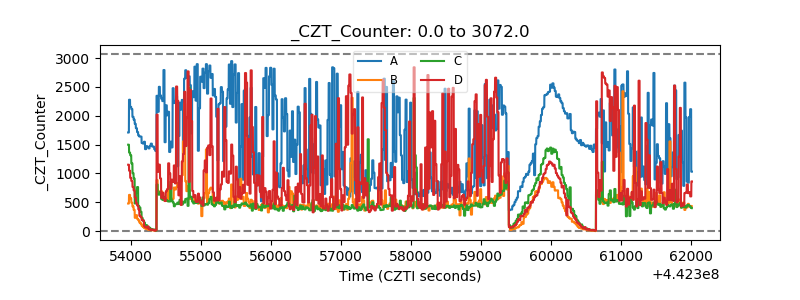 |
| +2.5 Volts monitor | 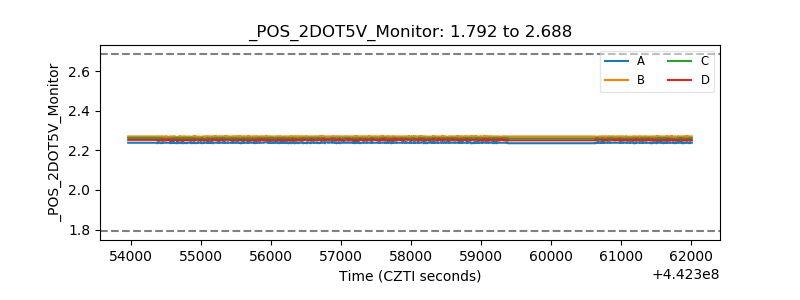 |
| +5 Volts monitor | 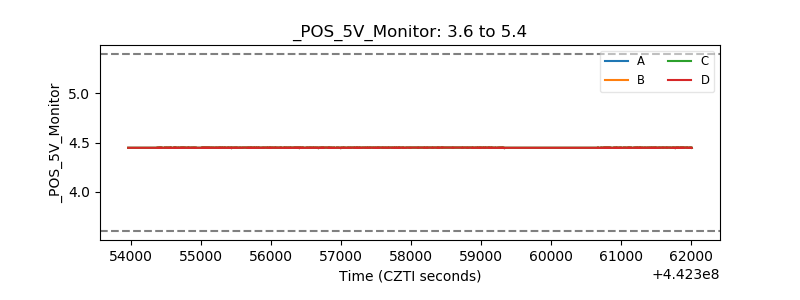 |
| _ROLL_ROT | 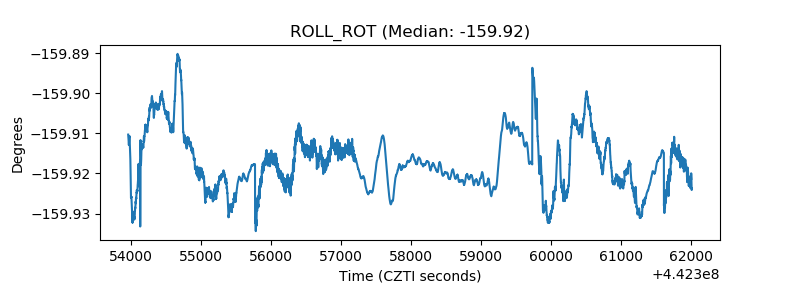 |
| _Roll_DEC | 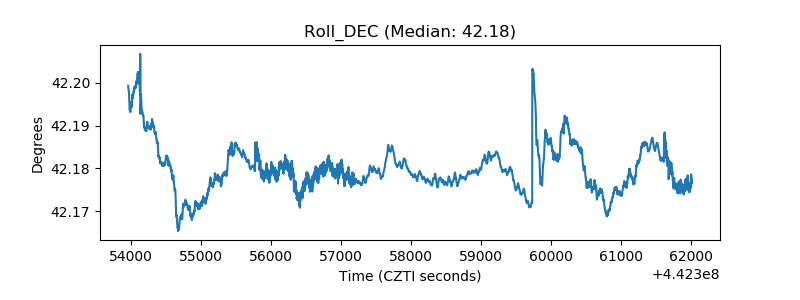 |
| _Roll_RA | 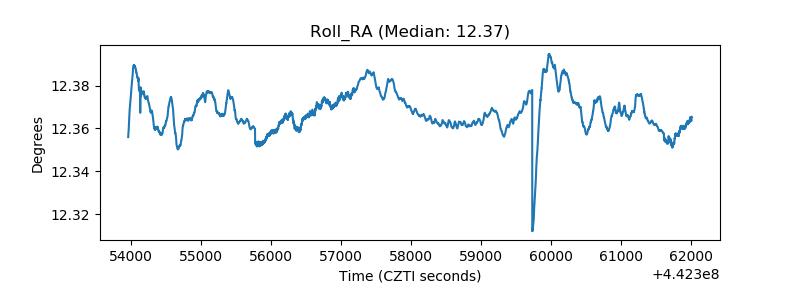 |
| Veto Counter | 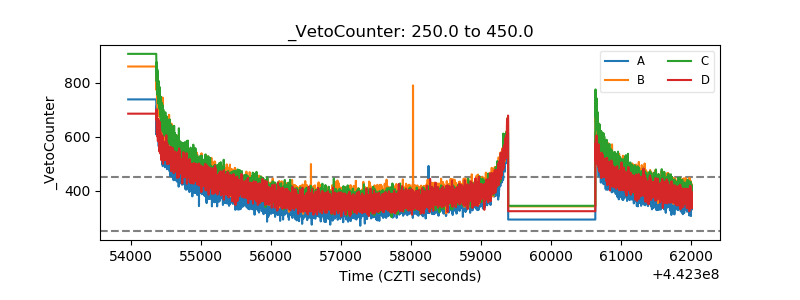 |