| Param | Original file | Final file |
|---|---|---|
| Filename | modeM0/AS1A13_004T12_9000006020_44766cztM0_level2.fits | modeM0/AS1A13_004T12_9000006020_44766cztM0_level2_quad_clean.evt |
| Size (bytes) | 652,720,320 | 105,203,520 |
| Size | 622.5 MB | 100.3 MB |
| Events in quadrant A | 10,024,215 | 590,897 |
| Events in quadrant B | 3,740,118 | 771,128 |
| Events in quadrant C | 3,222,838 | 748,444 |
| Events in quadrant D | 6,639,250 | 594,305 |
| Mode SS | |||
|---|---|---|---|
| Quadrant | BADHDUFLAG | Total packets | Discarded packets |
| A | 0 | 138 | 0 |
| B | 0 | 138 | 0 |
| C | 0 | 138 | 0 |
| D | 0 | 138 | 0 |
| Mode M0 | |||
|---|---|---|---|
| Quadrant | BADHDUFLAG | Total packets | Discarded packets |
| A | 0 | 34684 | 2 |
| B | 0 | 15834 | 3 |
| C | 0 | 14607 | 2 |
| D | 0 | 24560 | 2 |
| Mode M9 | |||
|---|---|---|---|
| Quadrant | BADHDUFLAG | Total packets | Discarded packets |
| A | 0 | 13 | 0 |
| B | 0 | 14 | 0 |
| C | 0 | 14 | 0 |
| D | 0 | 14 | 0 |
| Quadrant | Total seconds | Saturated seconds | Saturation percentage |
|---|---|---|---|
| A | 6905 | 1856 | 26.879073% |
| B | 6904 | 133 | 1.926419% |
| C | 6904 | 53 | 0.767671% |
| D | 6904 | 1063 | 15.396871% |
Noise dominated data is calculated using 1-second bins in cleaned event files. If a bin has >2000 counts, and if more than 50% of those come from <1% of pixels, then it is considered to be noise-dominated and hence unusable.
| Quadrant | # 1 sec bins | Bins with >0 counts | Bins with >2000 counts | High rate bins dominated by noise | Noise dominated (total time) | Noise dominated (detector-on time) | Marked lightcurve |
|---|---|---|---|---|---|---|---|
| A | 7875 | 6905 | 1475 | 1475 | 18.73% | 21.36% | 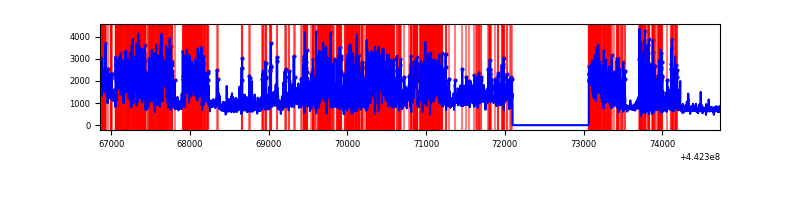 |
| B | 7874 | 6905 | 46 | 46 | 0.58% | 0.67% | 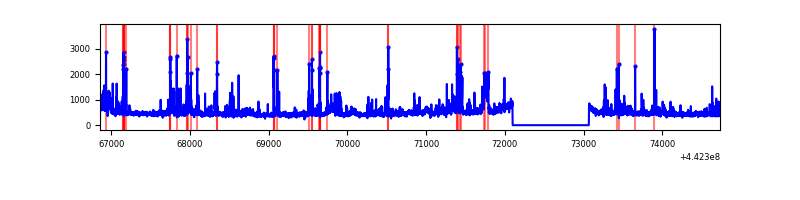 |
| C | 7874 | 6905 | 32 | 32 | 0.41% | 0.46% | 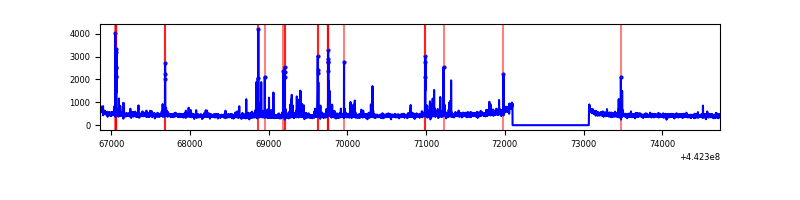 |
| D | 7874 | 6904 | 798 | 798 | 10.13% | 11.56% | 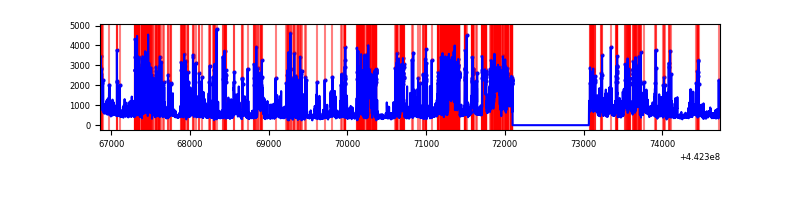 |
Top three noisy pixels from each quadrant. If the there are fewer than three noisy pixels in the level2.evt file, extra rows are filled as -1
| Pixel properties | Quadrant properties | ||||||
|---|---|---|---|---|---|---|---|
| Quadrant | DetID | PixID | Counts | Sigma | Mean | Median | Sigma |
| A | 15 | 223 | 5368779 | 37660.45 | 691 | 675 | 142.5 |
| A | 10 | 83 | 1964747 | 13779.14 | 691 | 675 | 142.5 |
| A | 13 | 248 | 14301 | 95.59 | 691 | 675 | 142.5 |
| B | 0 | 189 | 481086 | 3170.45 | 765 | 741 | 151.5 |
| B | 5 | 255 | 71720 | 468.49 | 765 | 741 | 151.5 |
| B | 0 | 219 | 45107 | 292.83 | 765 | 741 | 151.5 |
| C | 14 | 254 | 171537 | 958.72 | 759 | 764 | 178.1 |
| C | 1 | 3 | 66692 | 370.12 | 759 | 764 | 178.1 |
| C | 12 | 250 | 7539 | 38.03 | 759 | 764 | 178.1 |
| D | 1 | 52 | 2432708 | 13930.22 | 693 | 672 | 174.6 |
| D | 7 | 38 | 379653 | 2170.73 | 693 | 672 | 174.6 |
| D | 2 | 249 | 296351 | 1693.59 | 693 | 672 | 174.6 |
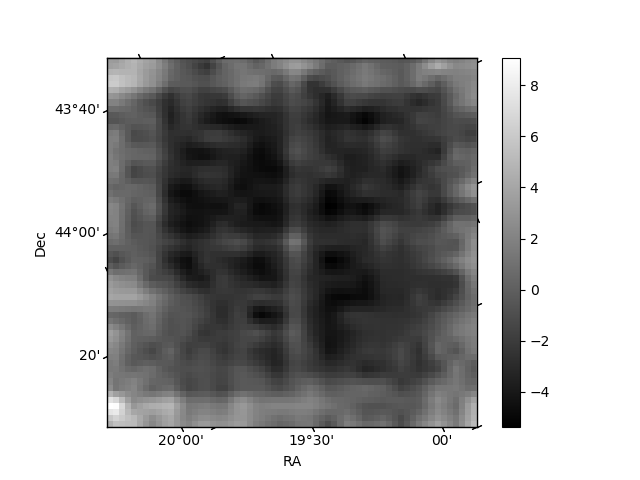
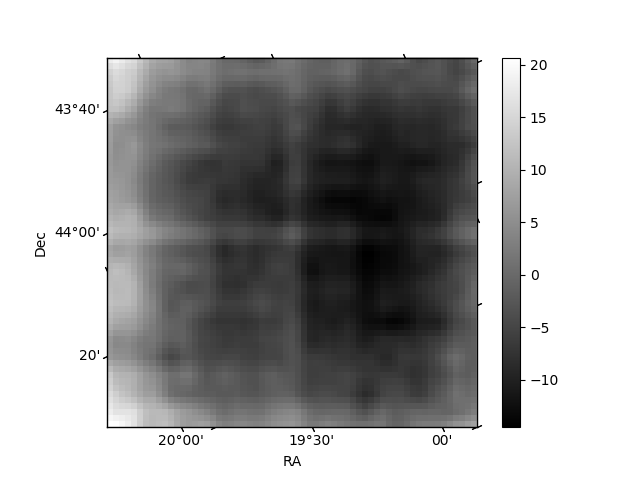
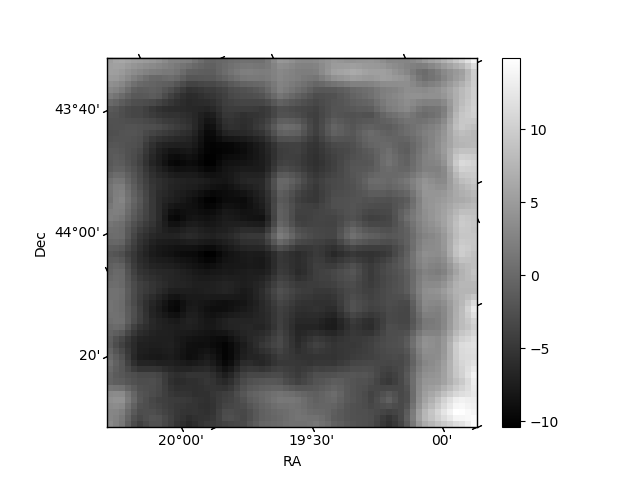
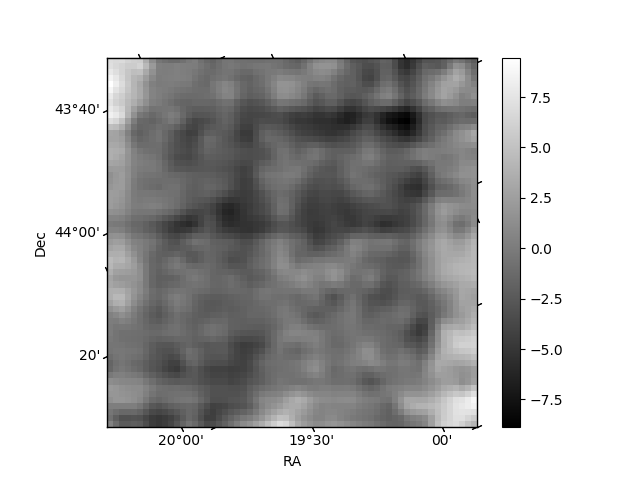
Histogram calculated using DETX and DETY for each event in the final _common_clean file
| Quadrant A | 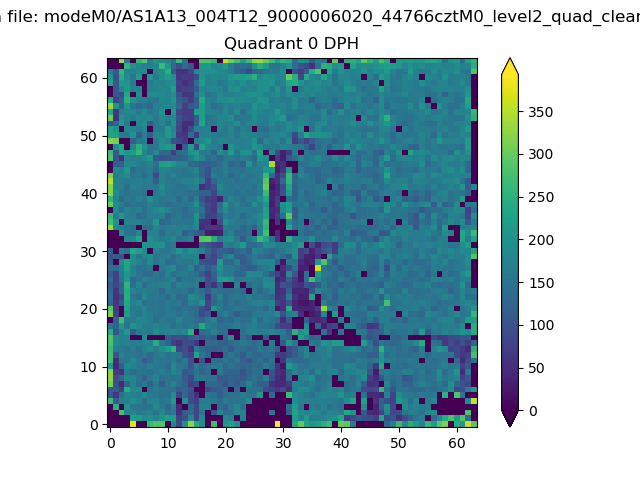 |
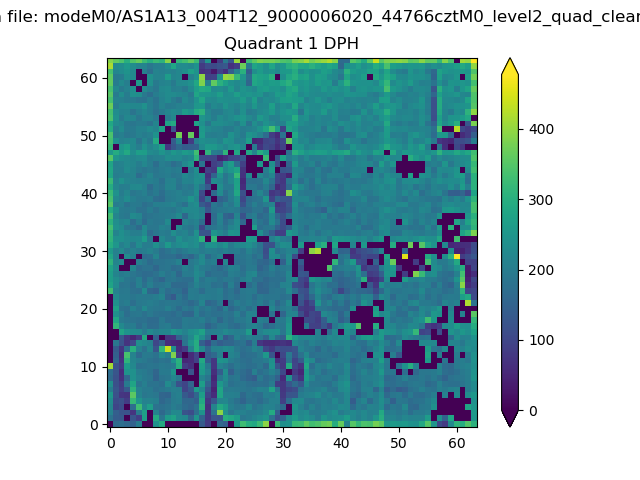 |
Quadrant B |
|---|---|---|---|
| Quadrant D | 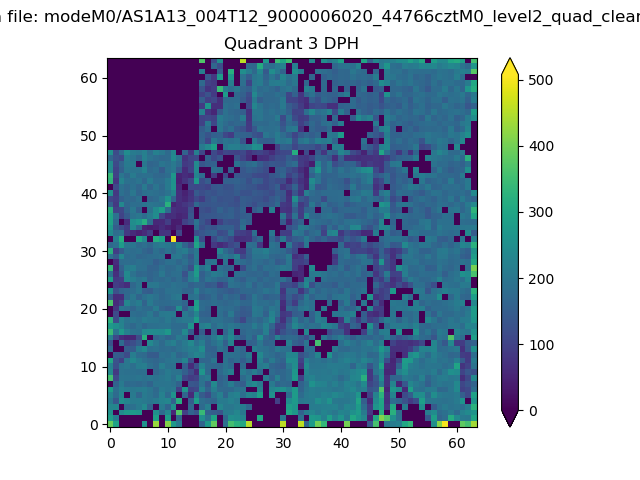 |
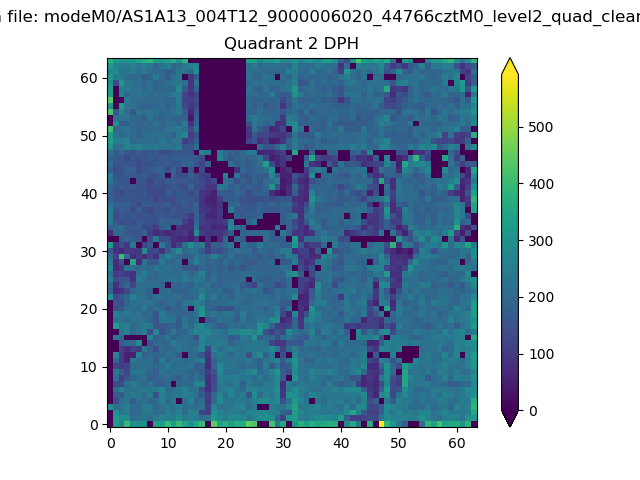 |
Quadrant C |
| Plot type | Count rate plots | Images |
|---|---|---|
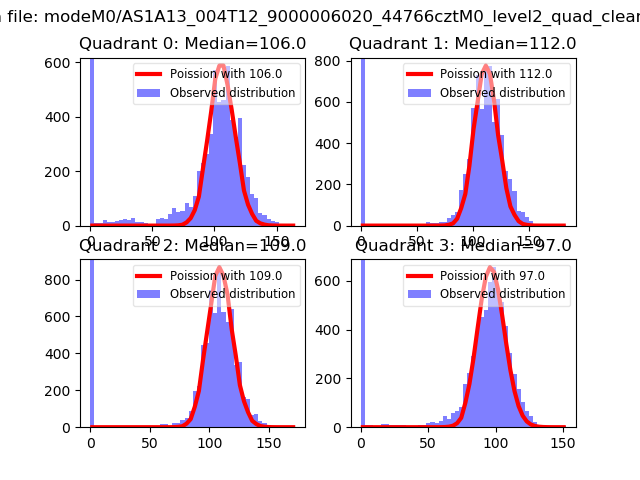
| Comparison with Poisson distribution Blue bars denote a histogram of data divided into 1 sec bins. Red curve is a Poisson curve with rate = median count rate of data. |
 |
 |
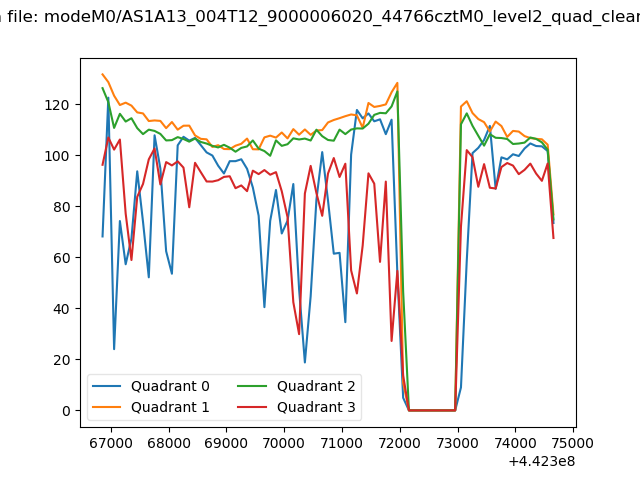
| Quadrant-wise count rates Data is divided into 100 sec bins |
 |
|
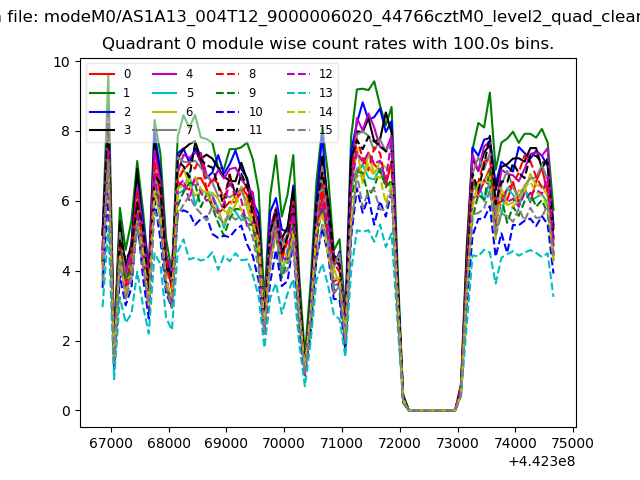
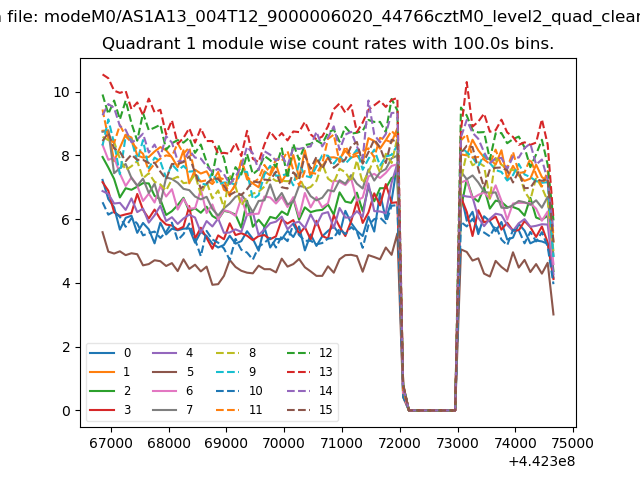
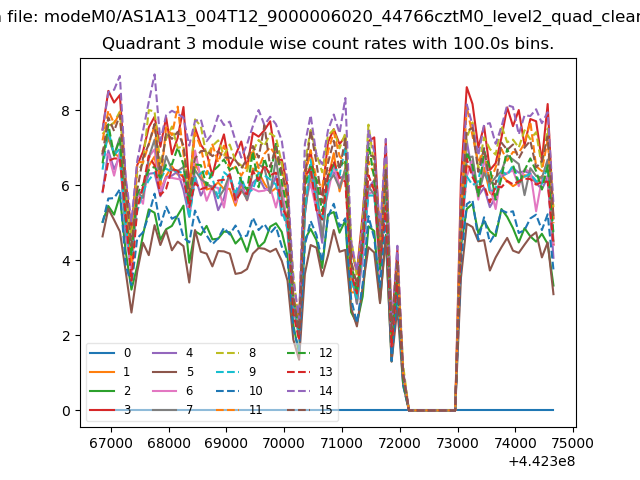
| Module-wise count rates for Quadrant A Data is divided into 100 sec bins |
 |
 |
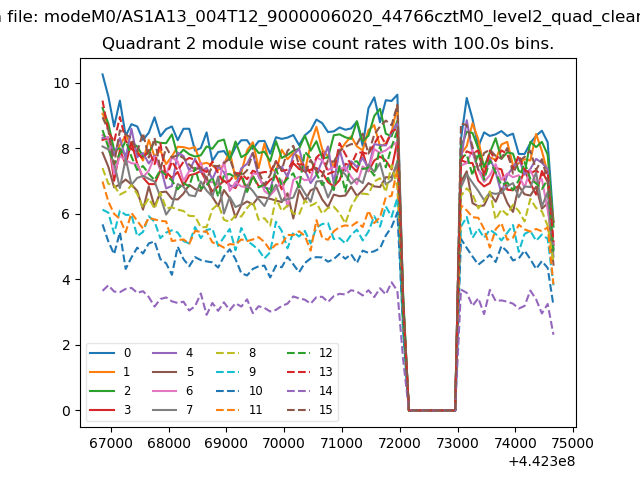
| Module-wise count rates for Quadrant B Data is divided into 100 sec bins |
 |
 |
| Module-wise count rates for Quadrant C Data is divided into 100 sec bins |
 |
 |
| Module-wise count rates for Quadrant D Data is divided into 100 sec bins |
 |
 |
| Parameter | Plot |
|---|---|
| CZT HV Monitor | 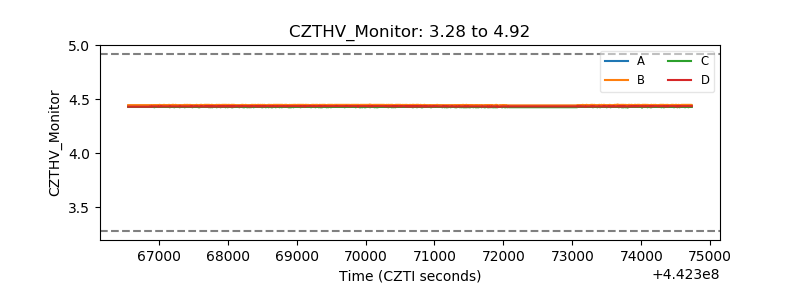 |
| D_VDD | 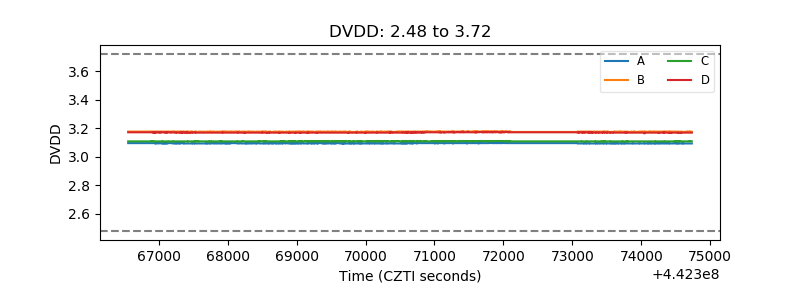 |
| Temperature 1 | 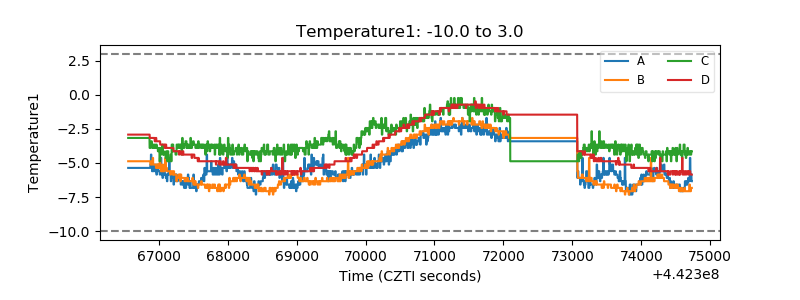 |
| Veto HV Monitor | 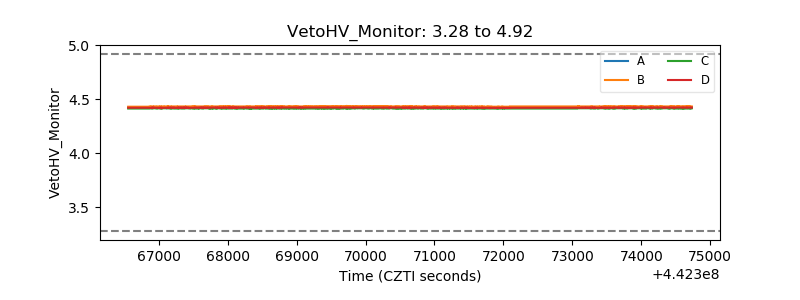 |
| Veto LLD | 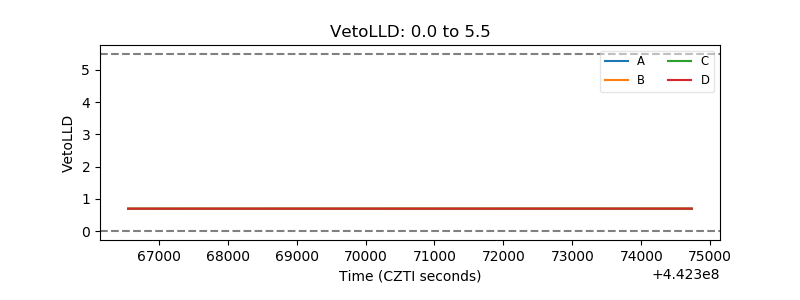 |
| Alpha Counter | 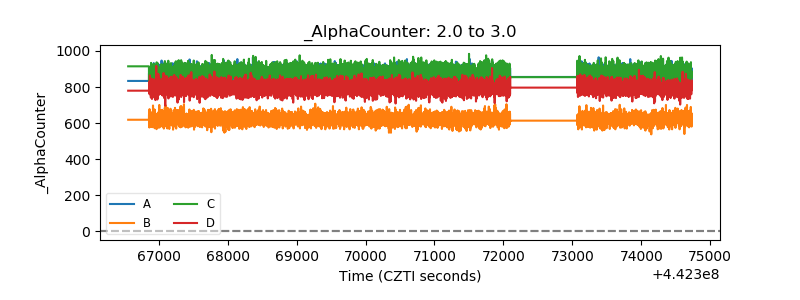 |
| _CPM_Rate | 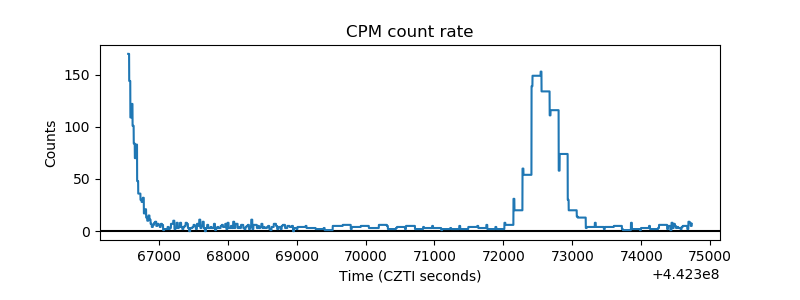 |
| CZT Counter | 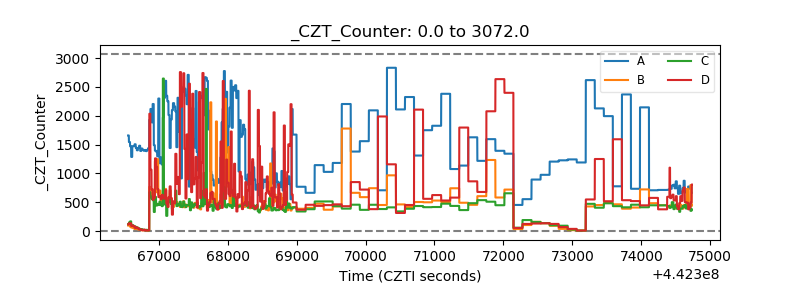 |
| +2.5 Volts monitor | 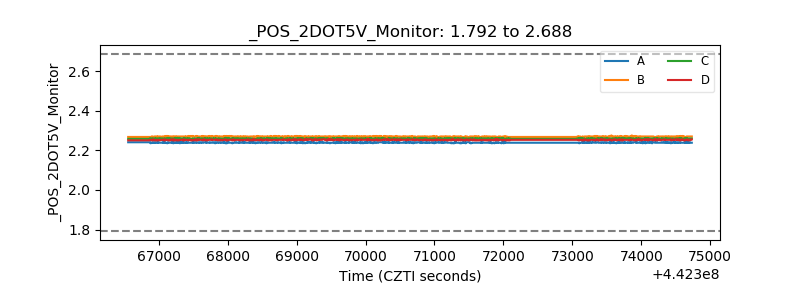 |
| +5 Volts monitor | 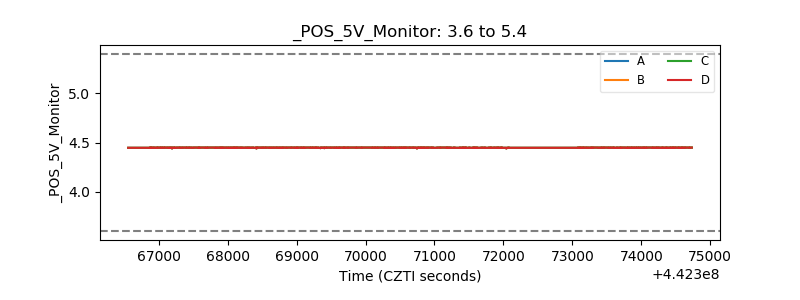 |
| _ROLL_ROT |  |
| _Roll_DEC | 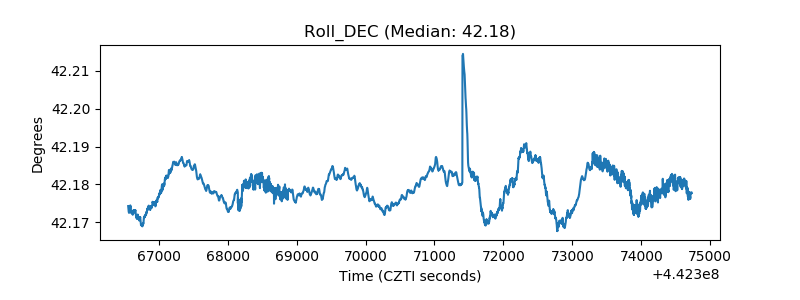 |
| _Roll_RA | 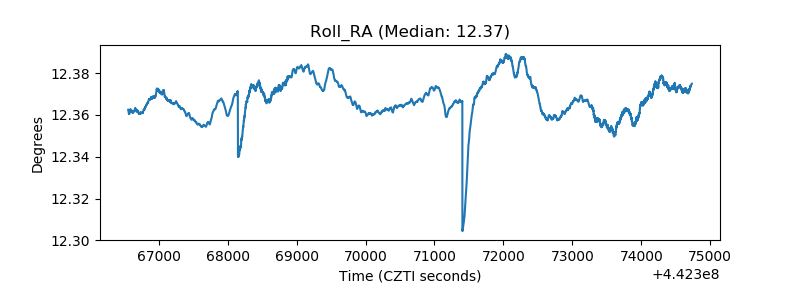 |
| Veto Counter | 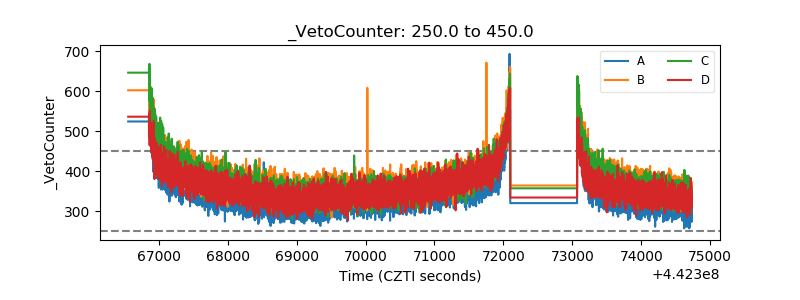 |