| Param | Original file | Final file |
|---|---|---|
| Filename | modeM0/AS1A13_004T12_9000006020_44767cztM0_level2.fits | modeM0/AS1A13_004T12_9000006020_44767cztM0_level2_quad_clean.evt |
| Size (bytes) | 558,901,440 | 114,837,120 |
| Size | 533.0 MB | 109.5 MB |
| Events in quadrant A | 6,195,794 | 742,319 |
| Events in quadrant B | 4,440,051 | 773,603 |
| Events in quadrant C | 3,443,118 | 774,699 |
| Events in quadrant D | 6,041,784 | 676,946 |
| Mode SS | |||
|---|---|---|---|
| Quadrant | BADHDUFLAG | Total packets | Discarded packets |
| A | 0 | 148 | 0 |
| B | 0 | 148 | 0 |
| C | 0 | 148 | 0 |
| D | 0 | 148 | 0 |
| Mode M0 | |||
|---|---|---|---|
| Quadrant | BADHDUFLAG | Total packets | Discarded packets |
| A | 0 | 24452 | 2 |
| B | 0 | 18290 | 2 |
| C | 0 | 15625 | 2 |
| D | 0 | 23051 | 2 |
| Mode M9 | |||
|---|---|---|---|
| Quadrant | BADHDUFLAG | Total packets | Discarded packets |
| A | 0 | 8 | 0 |
| B | 0 | 8 | 0 |
| C | 0 | 9 | 0 |
| D | 0 | 9 | 0 |
| Quadrant | Total seconds | Saturated seconds | Saturation percentage |
|---|---|---|---|
| A | 7322 | 456 | 6.227807% |
| B | 7321 | 374 | 5.108592% |
| C | 7321 | 109 | 1.488868% |
| D | 7321 | 538 | 7.348723% |
Noise dominated data is calculated using 1-second bins in cleaned event files. If a bin has >2000 counts, and if more than 50% of those come from <1% of pixels, then it is considered to be noise-dominated and hence unusable.
| Quadrant | # 1 sec bins | Bins with >0 counts | Bins with >2000 counts | High rate bins dominated by noise | Noise dominated (total time) | Noise dominated (detector-on time) | Marked lightcurve |
|---|---|---|---|---|---|---|---|
| A | 7807 | 7323 | 232 | 232 | 2.97% | 3.17% | 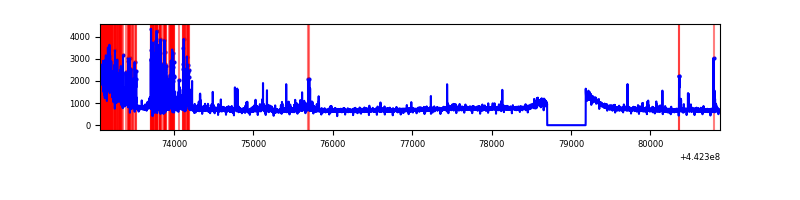 |
| B | 7806 | 7322 | 125 | 125 | 1.60% | 1.71% | 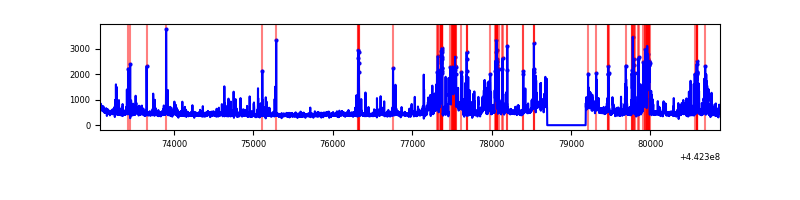 |
| C | 7806 | 7322 | 33 | 33 | 0.42% | 0.45% | 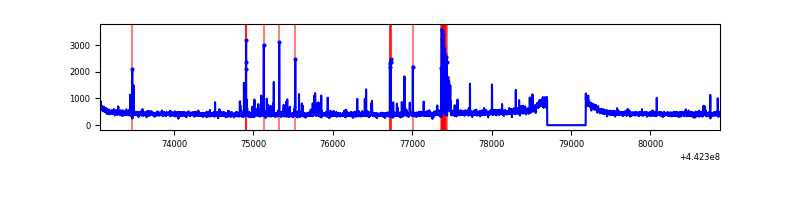 |
| D | 7806 | 7322 | 409 | 409 | 5.24% | 5.59% | 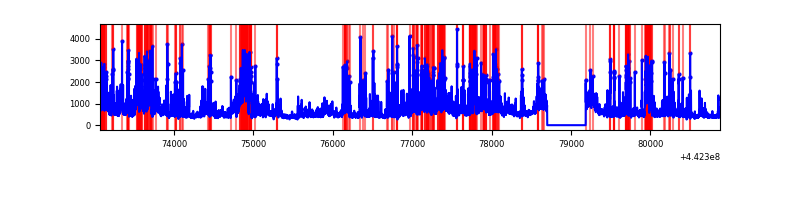 |
Top three noisy pixels from each quadrant. If the there are fewer than three noisy pixels in the level2.evt file, extra rows are filled as -1
| Pixel properties | Quadrant properties | ||||||
|---|---|---|---|---|---|---|---|
| Quadrant | DetID | PixID | Counts | Sigma | Mean | Median | Sigma |
| A | 10 | 83 | 2165064 | 12918.62 | 804 | 782 | 167.5 |
| A | 15 | 223 | 872299 | 5202.09 | 804 | 782 | 167.5 |
| A | 13 | 248 | 38757 | 226.67 | 804 | 782 | 167.5 |
| B | 0 | 189 | 665735 | 4115.88 | 812 | 787 | 161.6 |
| B | 15 | 36 | 227023 | 1400.35 | 812 | 787 | 161.6 |
| B | 5 | 255 | 134669 | 828.7 | 812 | 787 | 161.6 |
| C | 1 | 3 | 129697 | 672.33 | 814 | 818 | 191.7 |
| C | 14 | 254 | 100325 | 519.11 | 814 | 818 | 191.7 |
| C | 0 | 207 | 10392 | 49.95 | 814 | 818 | 191.7 |
| D | 1 | 52 | 1414927 | 7205.01 | 789 | 766 | 196.3 |
| D | 7 | 38 | 467776 | 2379.37 | 789 | 766 | 196.3 |
| D | 2 | 249 | 319620 | 1624.53 | 789 | 766 | 196.3 |
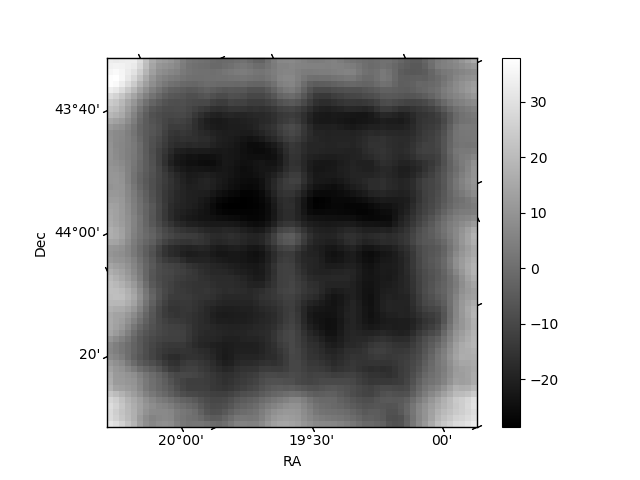
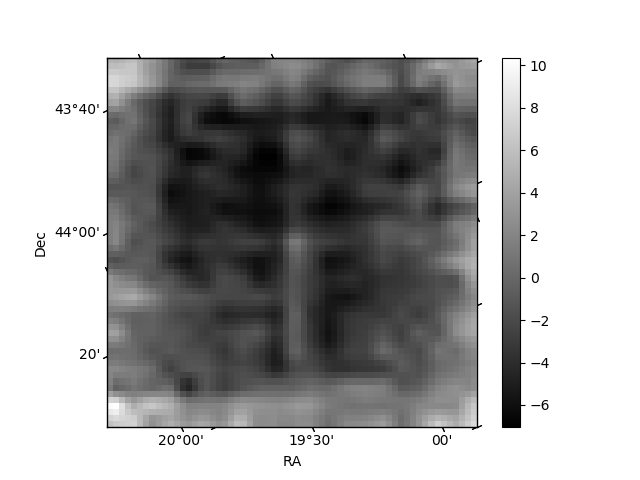
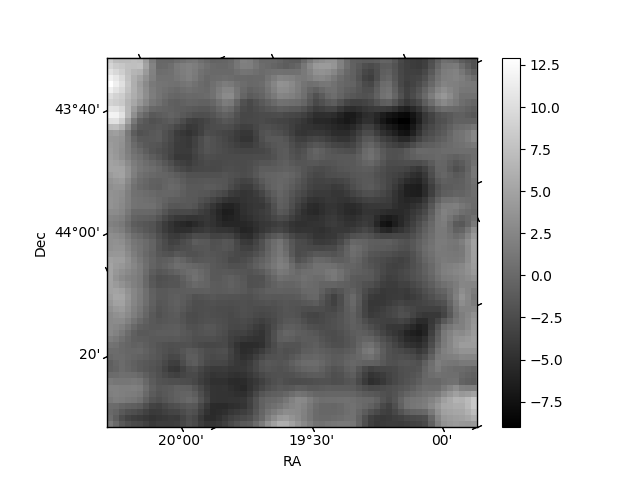
Histogram calculated using DETX and DETY for each event in the final _common_clean file
| Quadrant A | 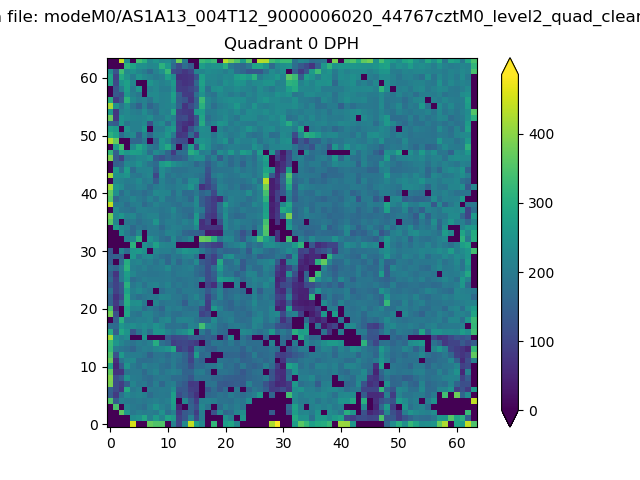 |
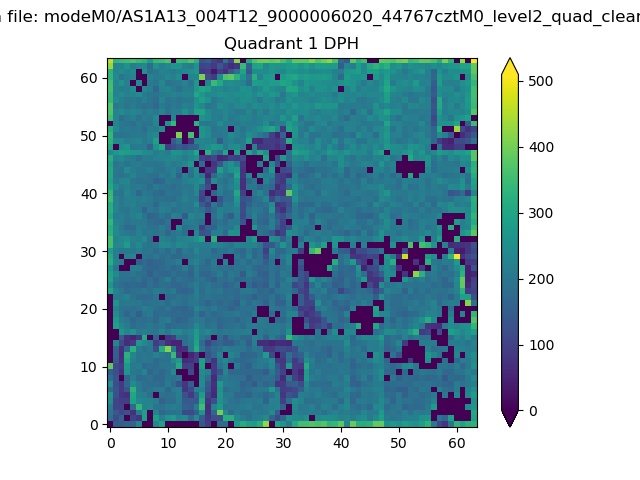 |
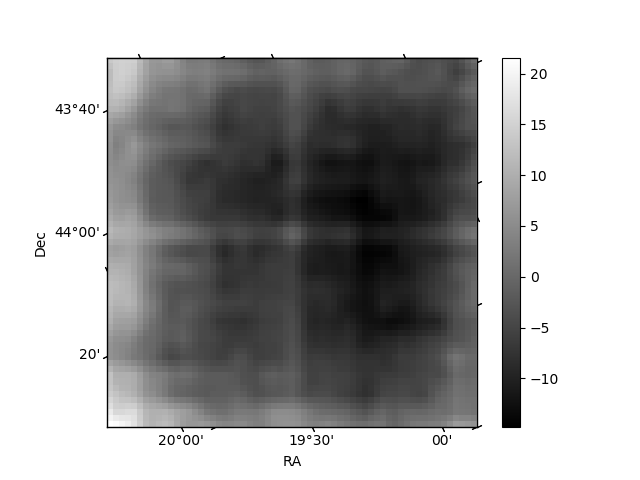
Quadrant B |
|---|---|---|---|
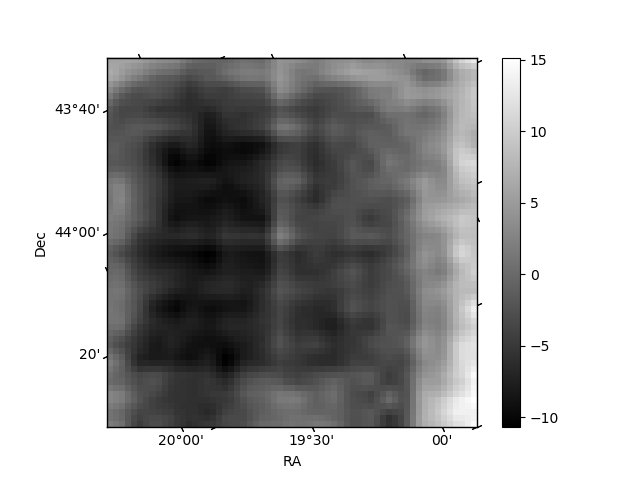
| Quadrant D | 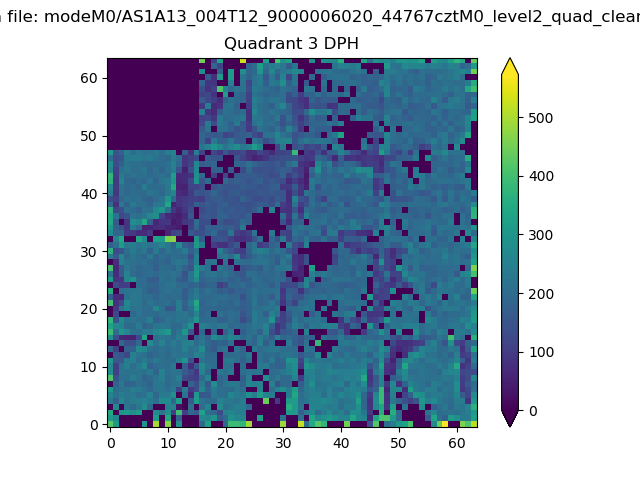 |
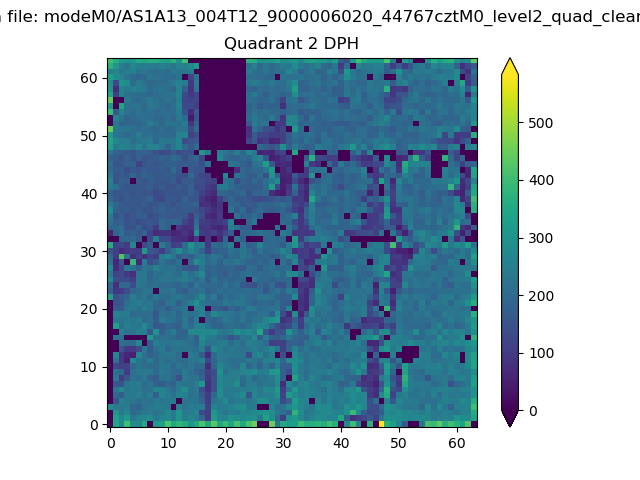 |
Quadrant C |
| Plot type | Count rate plots | Images |
|---|---|---|
| Comparison with Poisson distribution Blue bars denote a histogram of data divided into 1 sec bins. Red curve is a Poisson curve with rate = median count rate of data. |
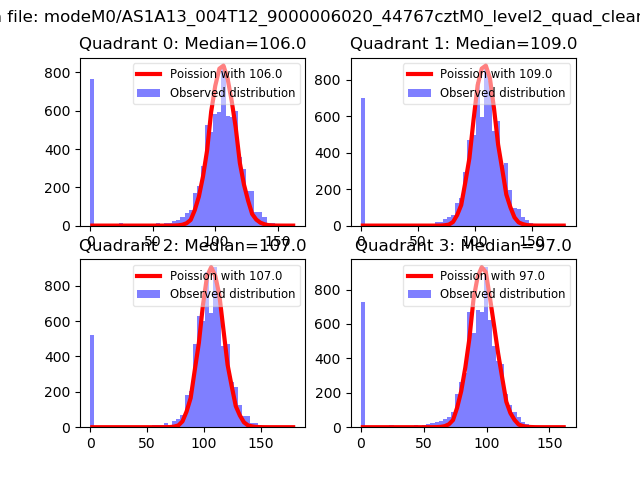 |
 |
| Quadrant-wise count rates Data is divided into 100 sec bins |
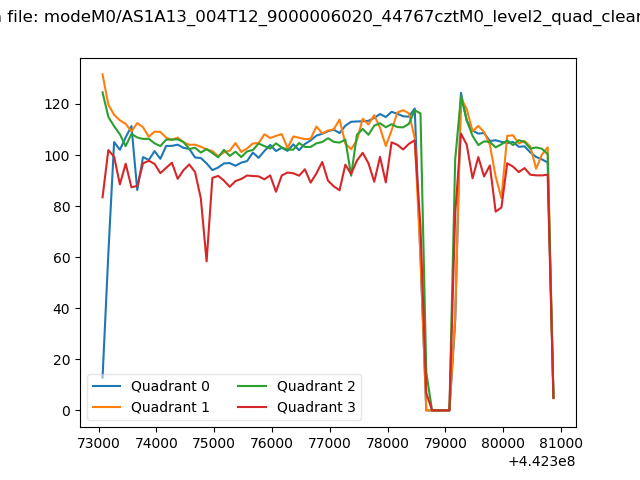 |
|
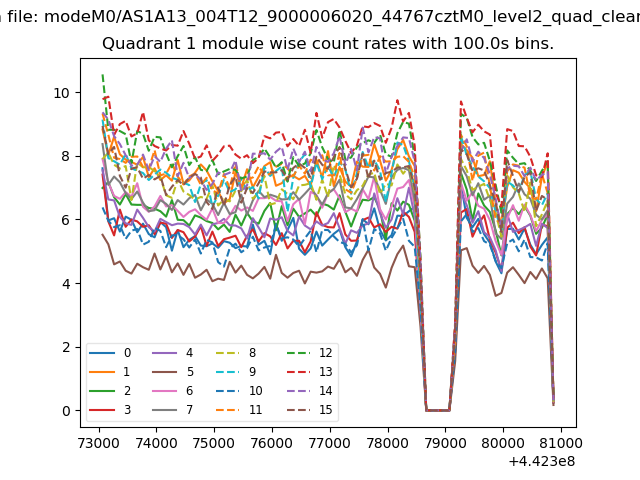
| Module-wise count rates for Quadrant A Data is divided into 100 sec bins |
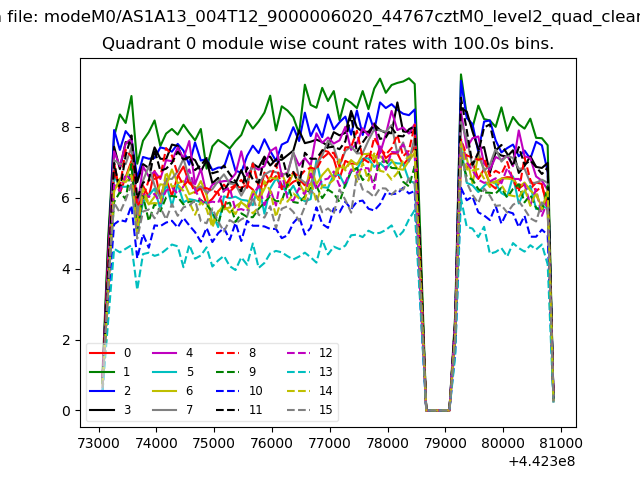 |
 |
| Module-wise count rates for Quadrant B Data is divided into 100 sec bins |
 |
 |
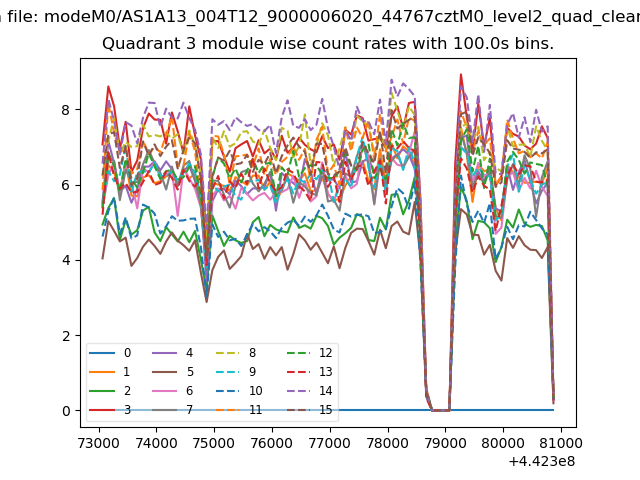
| Module-wise count rates for Quadrant C Data is divided into 100 sec bins |
 |
 |
| Module-wise count rates for Quadrant D Data is divided into 100 sec bins |
 |
 |
| Parameter | Plot |
|---|---|
| CZT HV Monitor | 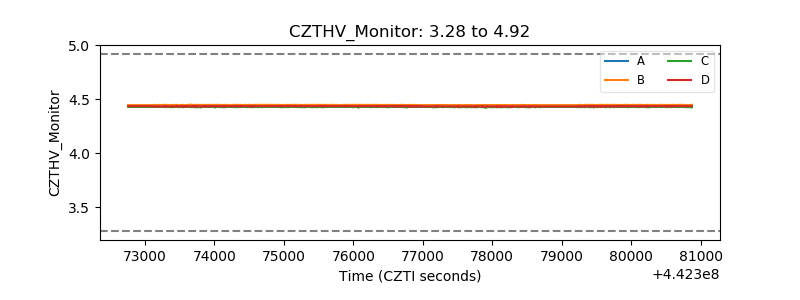 |
| D_VDD | 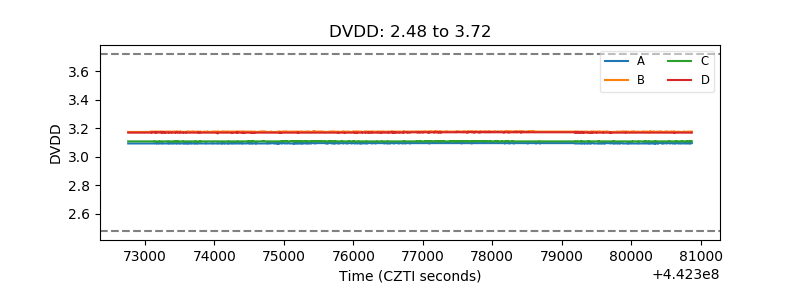 |
| Temperature 1 | 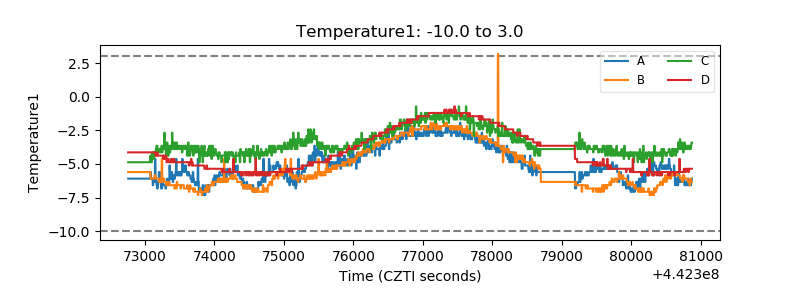 |
| Veto HV Monitor | 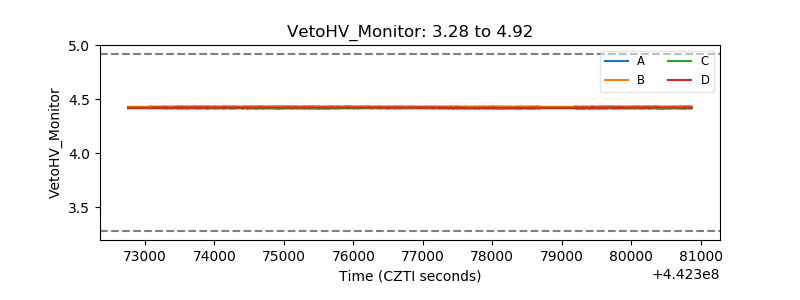 |
| Veto LLD | 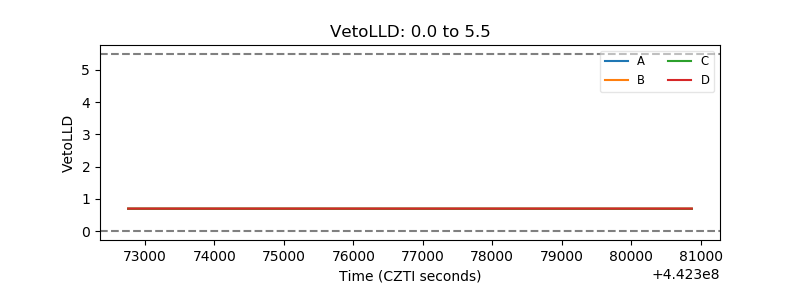 |
| Alpha Counter | 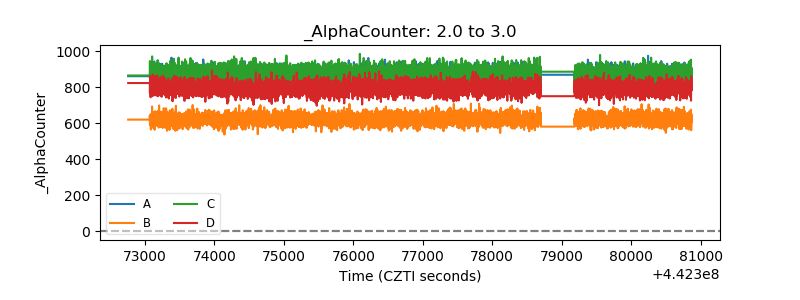 |
| _CPM_Rate | 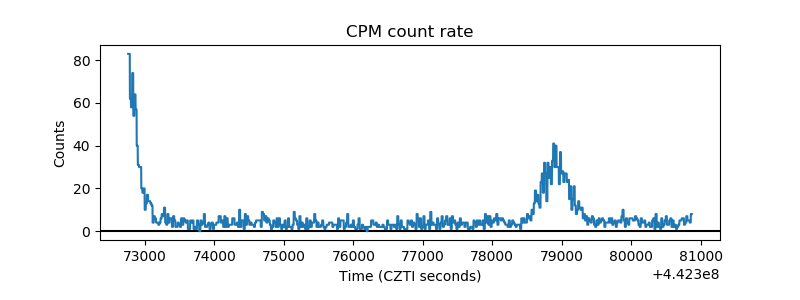 |
| CZT Counter | 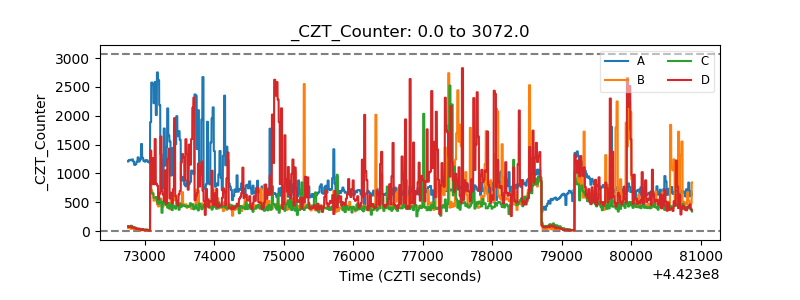 |
| +2.5 Volts monitor | 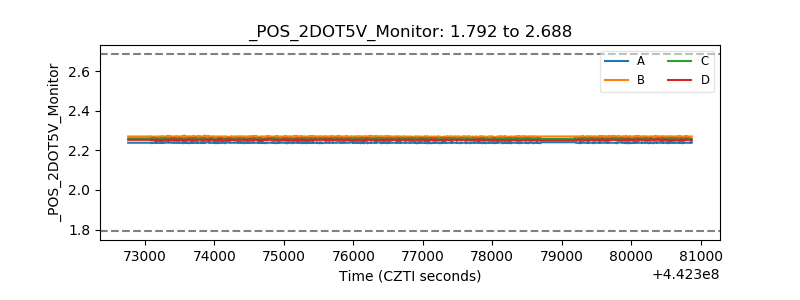 |
| +5 Volts monitor | 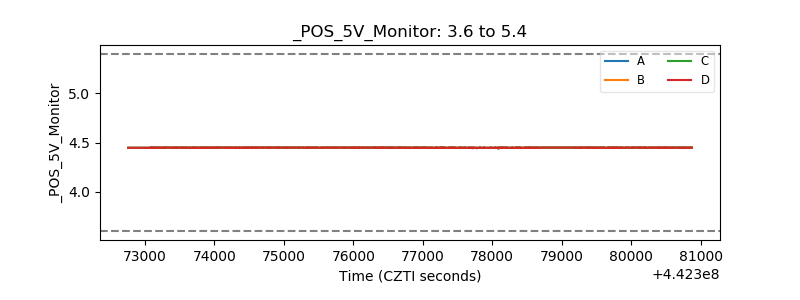 |
| _ROLL_ROT | 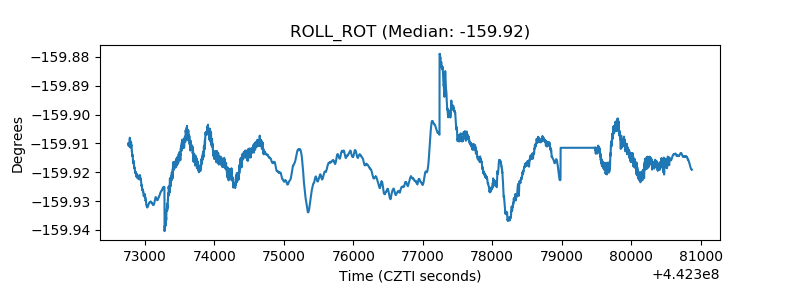 |
| _Roll_DEC | 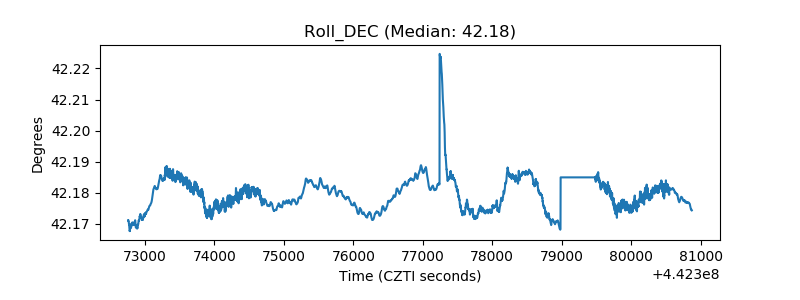 |
| _Roll_RA | 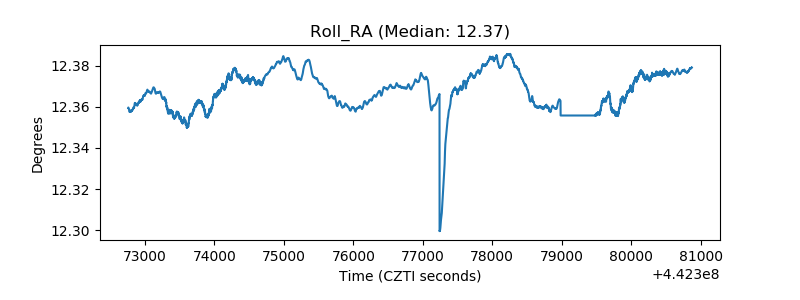 |
| Veto Counter | 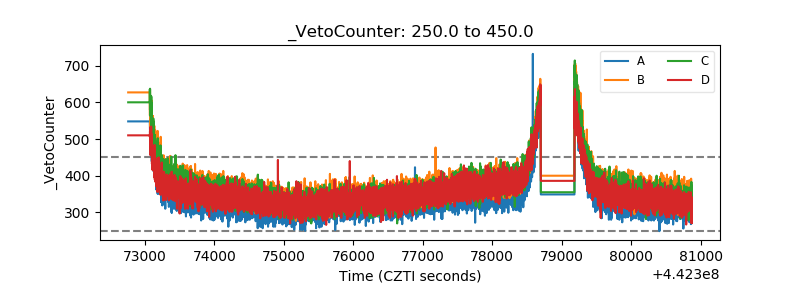 |