| Param | Original file | Final file |
|---|---|---|
| Filename | modeM0/AS1A13_004T12_9000006020_44769cztM0_level2.fits | modeM0/AS1A13_004T12_9000006020_44769cztM0_level2_quad_clean.evt |
| Size (bytes) | 663,033,600 | 139,325,760 |
| Size | 632.3 MB | 132.9 MB |
| Events in quadrant A | 6,299,922 | 925,014 |
| Events in quadrant B | 5,129,168 | 942,093 |
| Events in quadrant C | 4,381,439 | 930,720 |
| Events in quadrant D | 8,049,413 | 807,713 |
| Mode SS | |||
|---|---|---|---|
| Quadrant | BADHDUFLAG | Total packets | Discarded packets |
| A | 0 | 178 | 0 |
| B | 0 | 178 | 0 |
| C | 0 | 178 | 0 |
| D | 0 | 178 | 0 |
| Mode M0 | |||
|---|---|---|---|
| Quadrant | BADHDUFLAG | Total packets | Discarded packets |
| A | 0 | 26576 | 1 |
| B | 0 | 21337 | 1 |
| C | 0 | 19323 | 1 |
| D | 0 | 30073 | 1 |
| Quadrant | Total seconds | Saturated seconds | Saturation percentage |
|---|---|---|---|
| A | 8822 | 265 | 3.003854% |
| B | 8822 | 387 | 4.386760% |
| C | 8822 | 114 | 1.292224% |
| D | 8822 | 727 | 8.240762% |
Noise dominated data is calculated using 1-second bins in cleaned event files. If a bin has >2000 counts, and if more than 50% of those come from <1% of pixels, then it is considered to be noise-dominated and hence unusable.
| Quadrant | # 1 sec bins | Bins with >0 counts | Bins with >2000 counts | High rate bins dominated by noise | Noise dominated (total time) | Noise dominated (detector-on time) | Marked lightcurve |
|---|---|---|---|---|---|---|---|
| A | 8867 | 8823 | 16 | 16 | 0.18% | 0.18% | 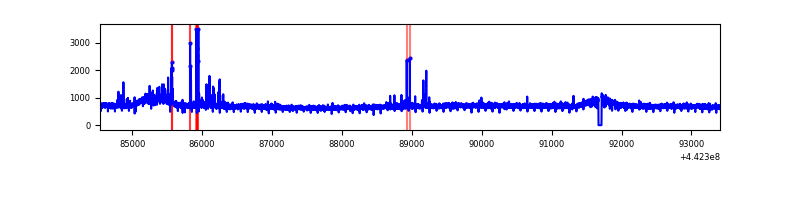 |
| B | 8867 | 8823 | 80 | 80 | 0.90% | 0.91% | 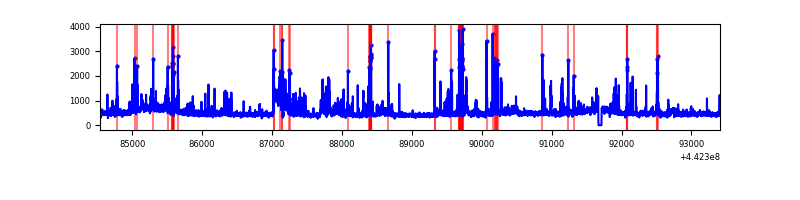 |
| C | 8867 | 8823 | 53 | 53 | 0.60% | 0.60% | 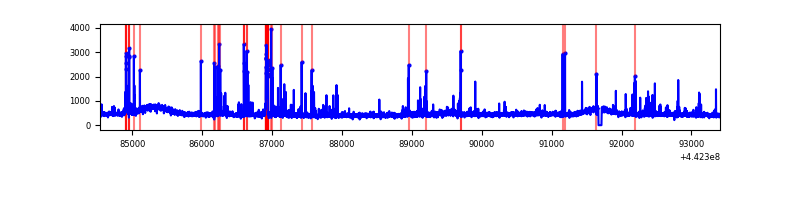 |
| D | 8867 | 8823 | 561 | 561 | 6.33% | 6.36% | 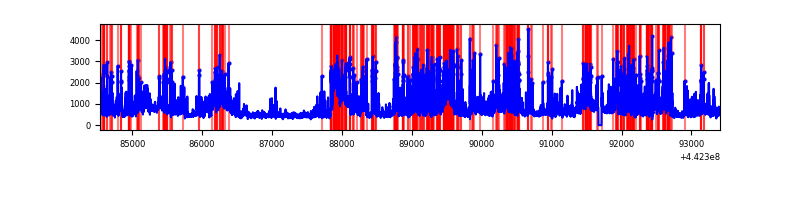 |
Top three noisy pixels from each quadrant. If the there are fewer than three noisy pixels in the level2.evt file, extra rows are filled as -1
| Pixel properties | Quadrant properties | ||||||
|---|---|---|---|---|---|---|---|
| Quadrant | DetID | PixID | Counts | Sigma | Mean | Median | Sigma |
| A | 10 | 83 | 2272616 | 10744.8 | 1006 | 980 | 211.4 |
| A | 13 | 248 | 142531 | 669.53 | 1006 | 980 | 211.4 |
| A | 3 | 137 | 12073 | 52.47 | 1006 | 980 | 211.4 |
| B | 0 | 189 | 563007 | 2852.15 | 999 | 967 | 197.1 |
| B | 5 | 255 | 355231 | 1797.76 | 999 | 967 | 197.1 |
| B | 7 | 221 | 121276 | 610.52 | 999 | 967 | 197.1 |
| C | 14 | 254 | 270612 | 1149.16 | 997 | 1001 | 234.6 |
| C | 1 | 3 | 73742 | 310.04 | 997 | 1001 | 234.6 |
| C | 12 | 2 | 64615 | 271.14 | 997 | 1001 | 234.6 |
| D | 1 | 52 | 1632407 | 6767.0 | 966 | 935 | 241.1 |
| D | 7 | 38 | 925397 | 3834.47 | 966 | 935 | 241.1 |
| D | 5 | 235 | 582222 | 2411.05 | 966 | 935 | 241.1 |
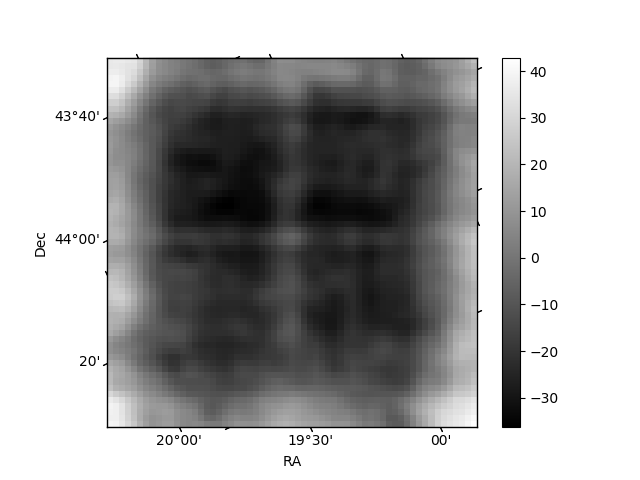
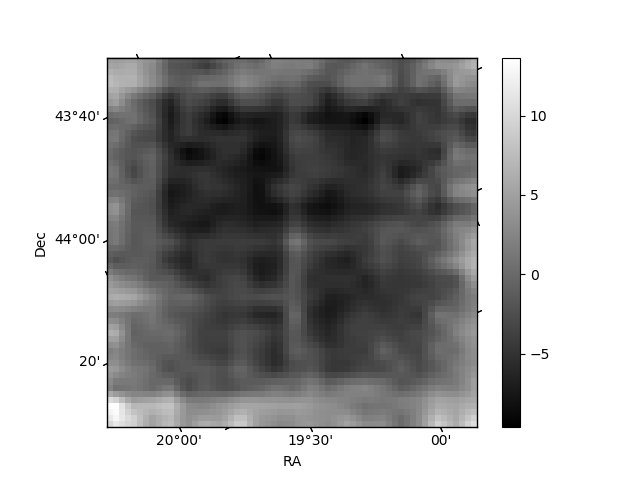
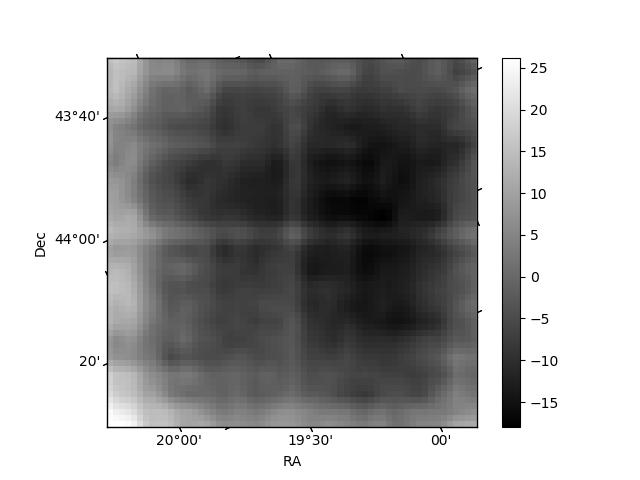
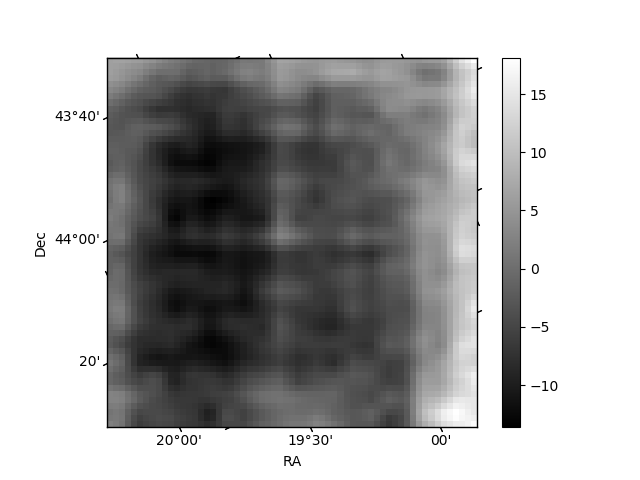
Histogram calculated using DETX and DETY for each event in the final _common_clean file
| Quadrant A | 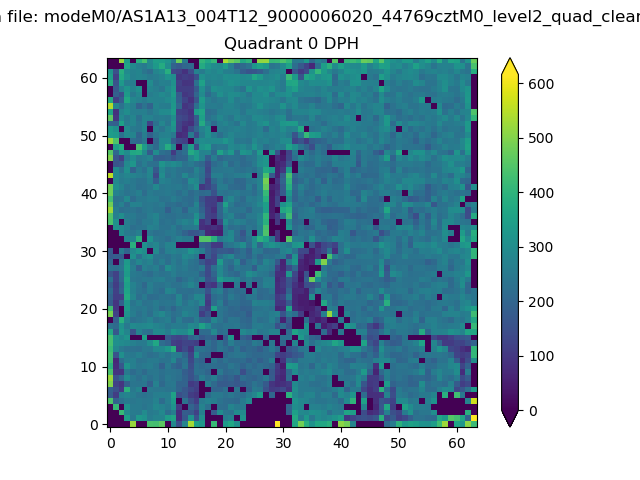 |
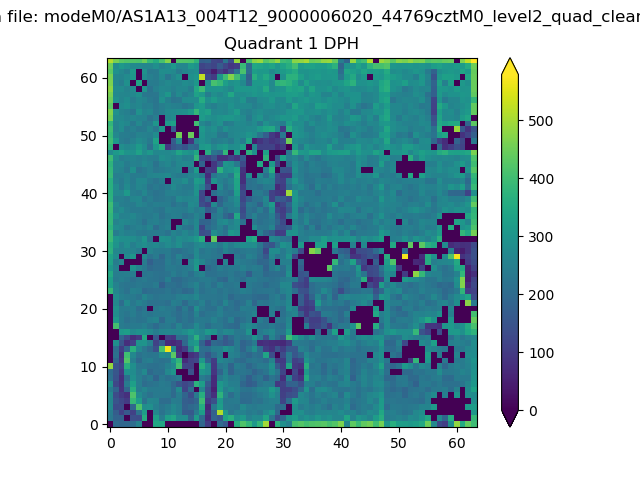 |
Quadrant B |
|---|---|---|---|
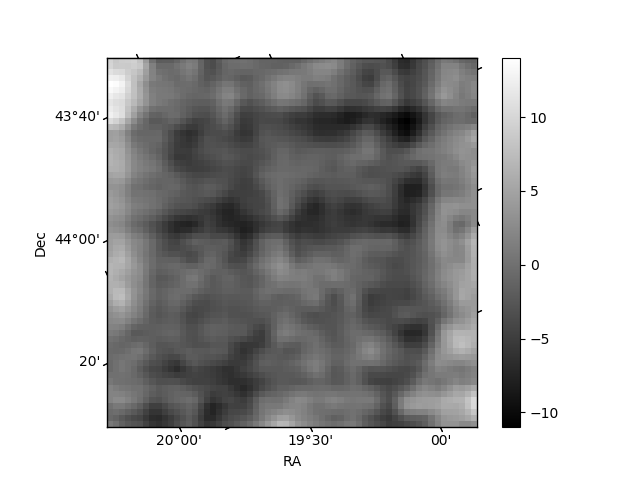
| Quadrant D | 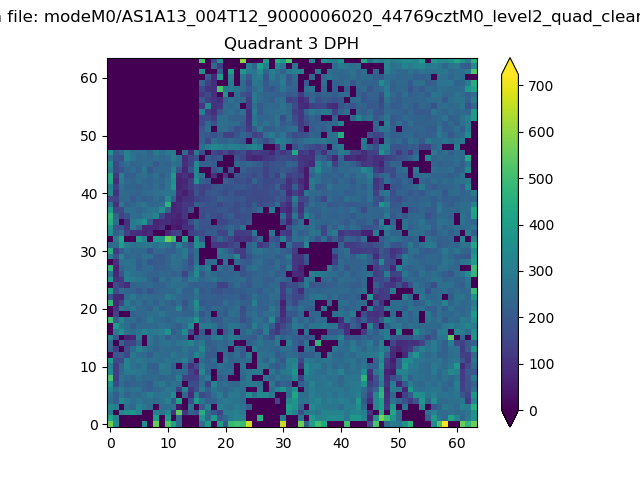 |
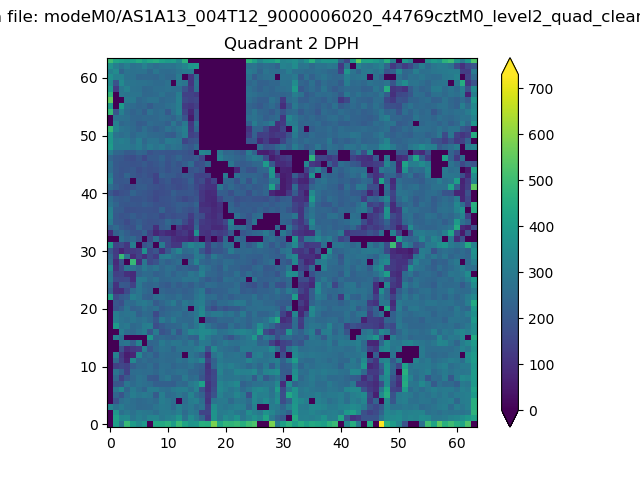 |
Quadrant C |
| Plot type | Count rate plots | Images |
|---|---|---|
| Comparison with Poisson distribution Blue bars denote a histogram of data divided into 1 sec bins. Red curve is a Poisson curve with rate = median count rate of data. |
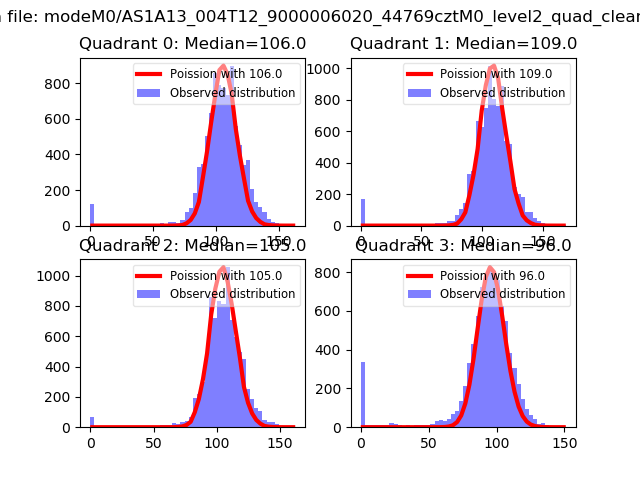 |
 |
| Quadrant-wise count rates Data is divided into 100 sec bins |
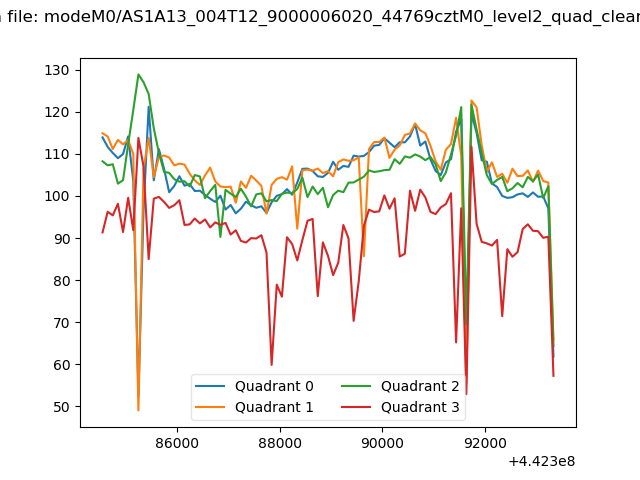 |
|
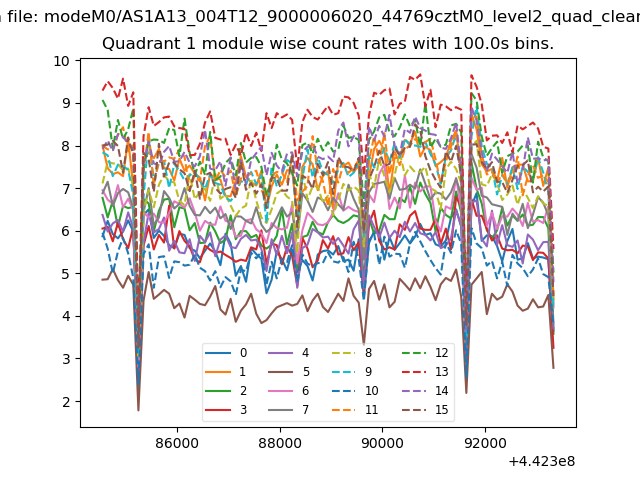
| Module-wise count rates for Quadrant A Data is divided into 100 sec bins |
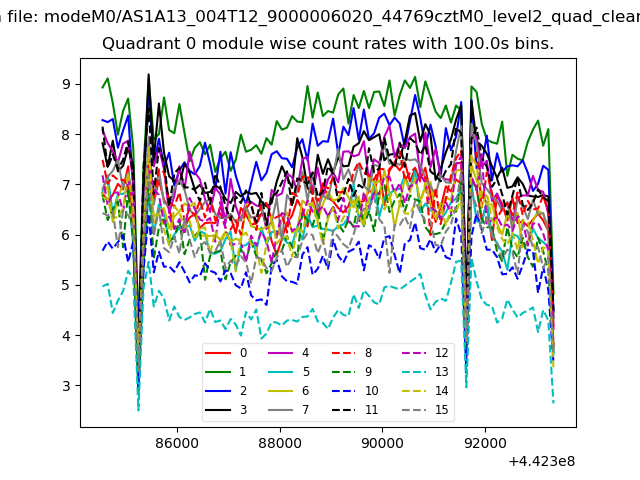 |
 |
| Module-wise count rates for Quadrant B Data is divided into 100 sec bins |
 |
 |
| Module-wise count rates for Quadrant C Data is divided into 100 sec bins |
 |
 |
| Module-wise count rates for Quadrant D Data is divided into 100 sec bins |
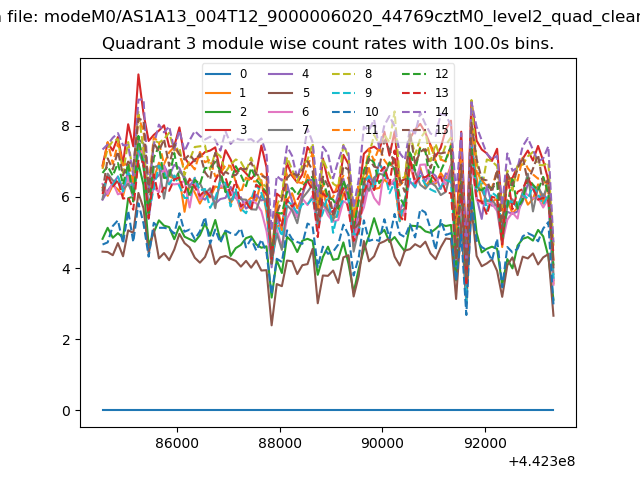 |
 |
| Parameter | Plot |
|---|---|
| CZT HV Monitor | 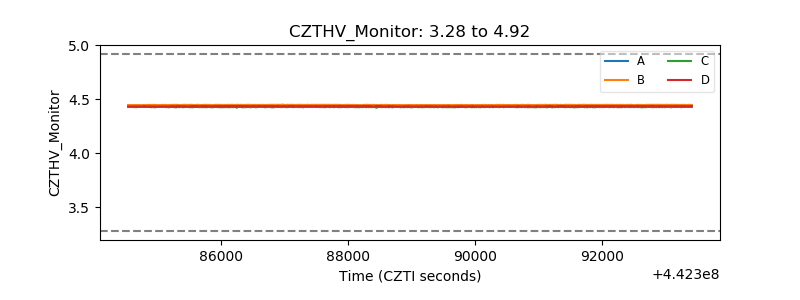 |
| D_VDD | 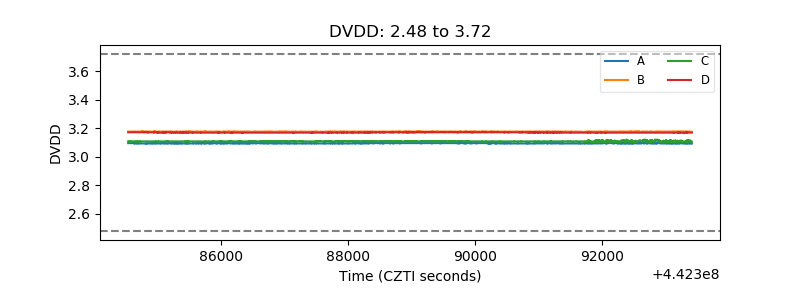 |
| Temperature 1 | 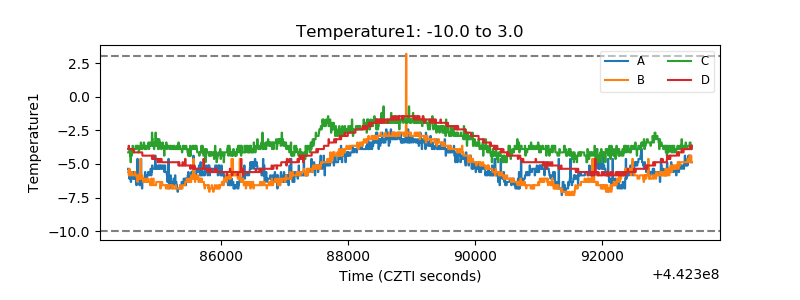 |
| Veto HV Monitor | 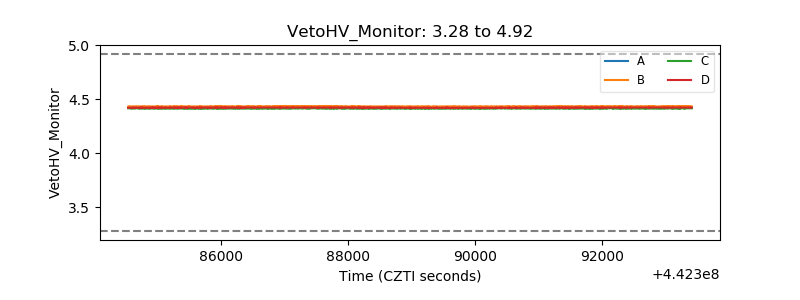 |
| Veto LLD | 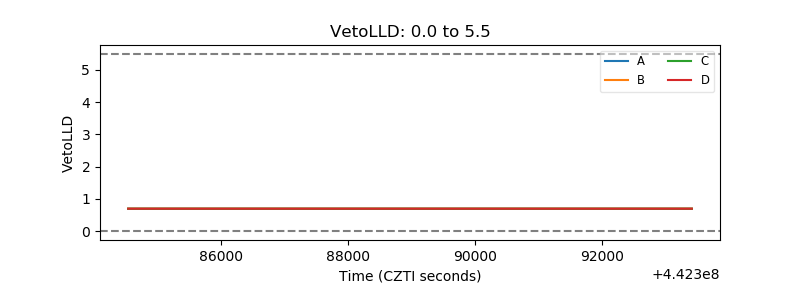 |
| Alpha Counter | 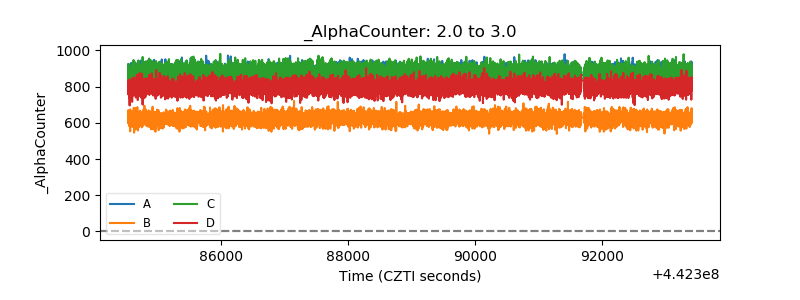 |
| _CPM_Rate | 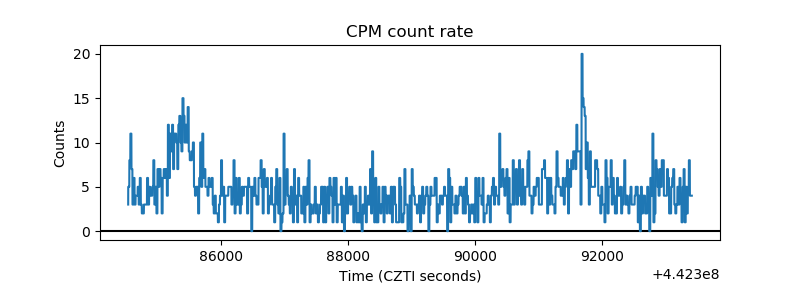 |
| CZT Counter | 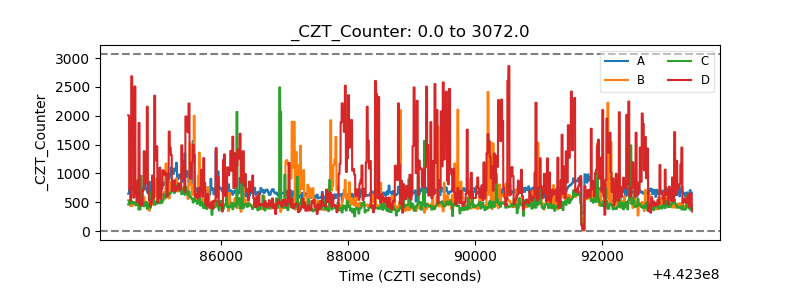 |
| +2.5 Volts monitor | 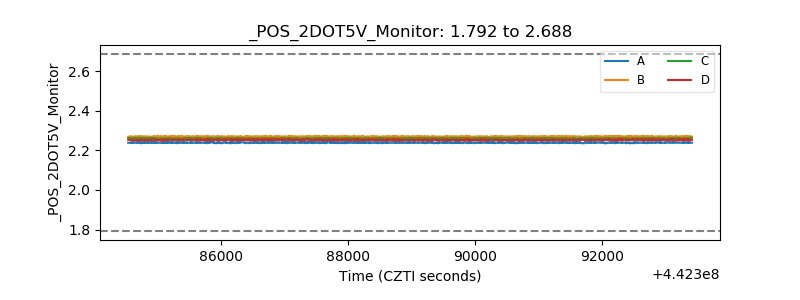 |
| +5 Volts monitor | 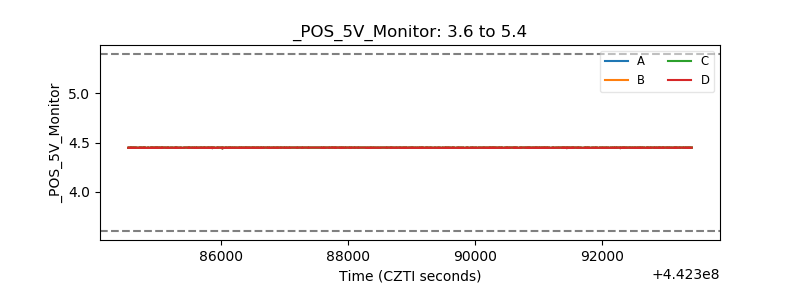 |
| _ROLL_ROT | 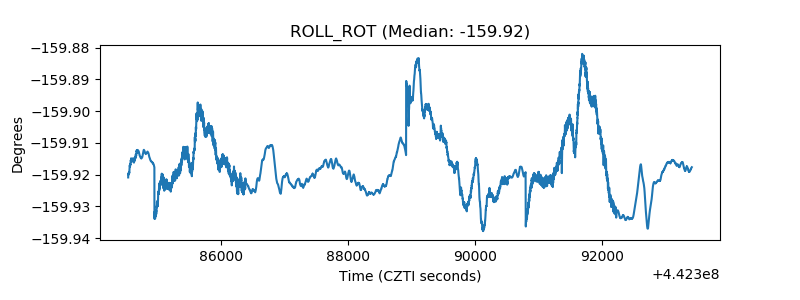 |
| _Roll_DEC | 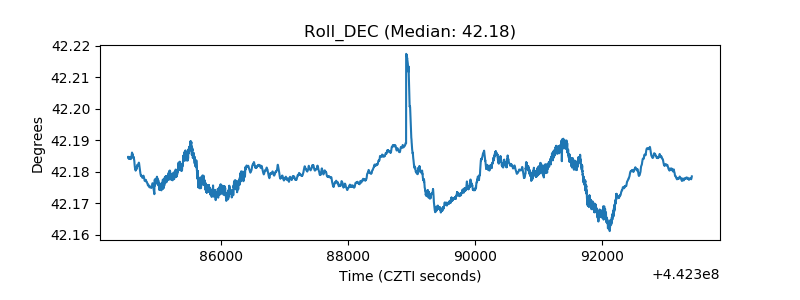 |
| _Roll_RA | 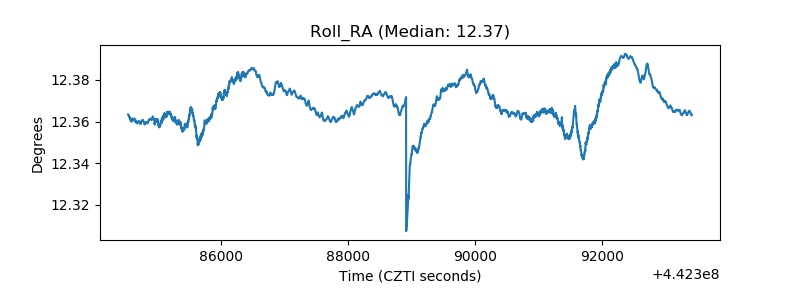 |
| Veto Counter | 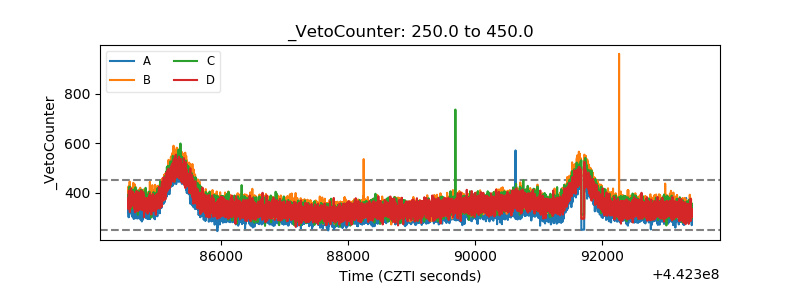 |