| Param | Original file | Final file |
|---|---|---|
| Filename | modeM0/AS1A13_004T12_9000006020_44773cztM0_level2.fits | modeM0/AS1A13_004T12_9000006020_44773cztM0_level2_quad_clean.evt |
| Size (bytes) | 565,320,960 | 123,966,720 |
| Size | 539.1 MB | 118.2 MB |
| Events in quadrant A | 6,123,133 | 817,724 |
| Events in quadrant B | 4,748,460 | 829,163 |
| Events in quadrant C | 3,723,787 | 822,331 |
| Events in quadrant D | 5,722,917 | 740,224 |
| Mode SS | |||
|---|---|---|---|
| Quadrant | BADHDUFLAG | Total packets | Discarded packets |
| A | 0 | 156 | 0 |
| B | 0 | 156 | 0 |
| C | 0 | 156 | 0 |
| D | 0 | 156 | 0 |
| Mode M0 | |||
|---|---|---|---|
| Quadrant | BADHDUFLAG | Total packets | Discarded packets |
| A | 0 | 24861 | 2 |
| B | 0 | 19362 | 2 |
| C | 0 | 16657 | 2 |
| D | 0 | 22162 | 2 |
| Mode M9 | |||
|---|---|---|---|
| Quadrant | BADHDUFLAG | Total packets | Discarded packets |
| A | 0 | 16 | 0 |
| B | 0 | 16 | 0 |
| C | 0 | 16 | 0 |
| D | 0 | 16 | 0 |
| Quadrant | Total seconds | Saturated seconds | Saturation percentage |
|---|---|---|---|
| A | 7838 | 302 | 3.853024% |
| B | 7839 | 393 | 5.013395% |
| C | 7839 | 100 | 1.275673% |
| D | 7839 | 385 | 4.911341% |
Noise dominated data is calculated using 1-second bins in cleaned event files. If a bin has >2000 counts, and if more than 50% of those come from <1% of pixels, then it is considered to be noise-dominated and hence unusable.
| Quadrant | # 1 sec bins | Bins with >0 counts | Bins with >2000 counts | High rate bins dominated by noise | Noise dominated (total time) | Noise dominated (detector-on time) | Marked lightcurve |
|---|---|---|---|---|---|---|---|
| A | 9263 | 7838 | 31 | 31 | 0.33% | 0.40% | 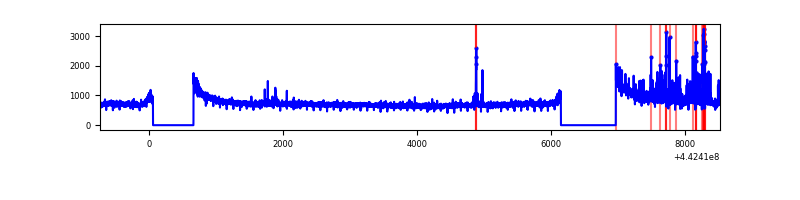 |
| B | 9264 | 7839 | 158 | 158 | 1.71% | 2.02% | 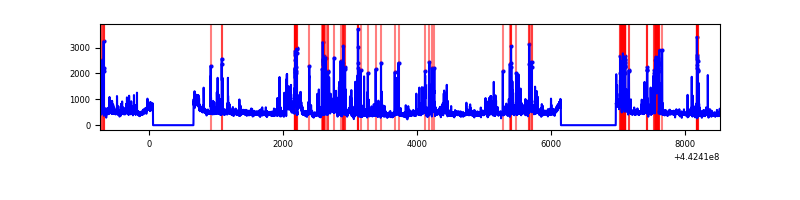 |
| C | 9264 | 7841 | 20 | 20 | 0.22% | 0.26% | 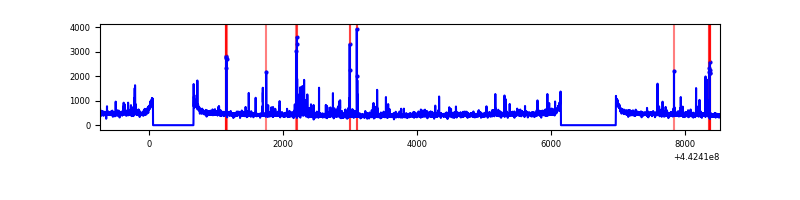 |
| D | 9264 | 7840 | 262 | 262 | 2.83% | 3.34% | 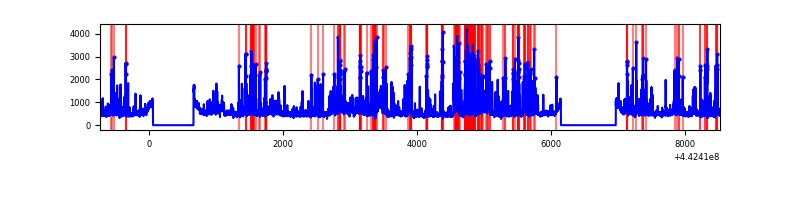 |
Top three noisy pixels from each quadrant. If the there are fewer than three noisy pixels in the level2.evt file, extra rows are filled as -1
| Pixel properties | Quadrant properties | ||||||
|---|---|---|---|---|---|---|---|
| Quadrant | DetID | PixID | Counts | Sigma | Mean | Median | Sigma |
| A | 10 | 83 | 2378505 | 12742.95 | 889 | 869 | 186.6 |
| A | 15 | 223 | 209301 | 1117.09 | 889 | 869 | 186.6 |
| A | 13 | 248 | 83799 | 444.46 | 889 | 869 | 186.6 |
| B | 0 | 189 | 760811 | 4361.61 | 875 | 846 | 174.2 |
| B | 5 | 255 | 167201 | 954.75 | 875 | 846 | 174.2 |
| B | 5 | 172 | 163470 | 933.34 | 875 | 846 | 174.2 |
| C | 14 | 254 | 165827 | 794.64 | 875 | 876 | 207.6 |
| C | 2 | 14 | 37784 | 177.8 | 875 | 876 | 207.6 |
| C | 12 | 249 | 25871 | 120.41 | 875 | 876 | 207.6 |
| D | 5 | 235 | 799943 | 3689.34 | 869 | 842 | 216.6 |
| D | 11 | 241 | 493439 | 2274.25 | 869 | 842 | 216.6 |
| D | 2 | 249 | 453585 | 2090.25 | 869 | 842 | 216.6 |
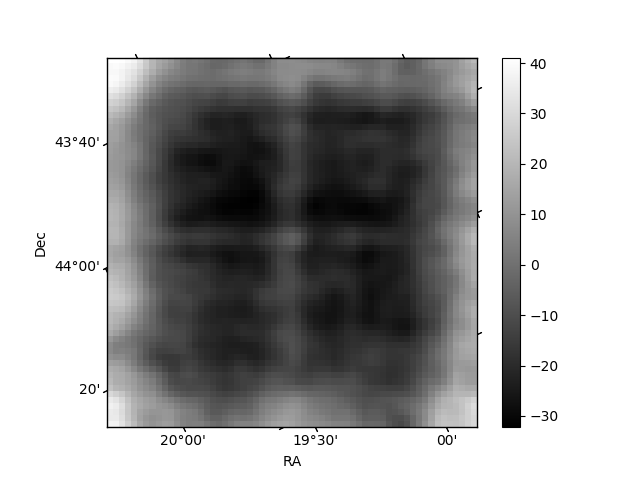
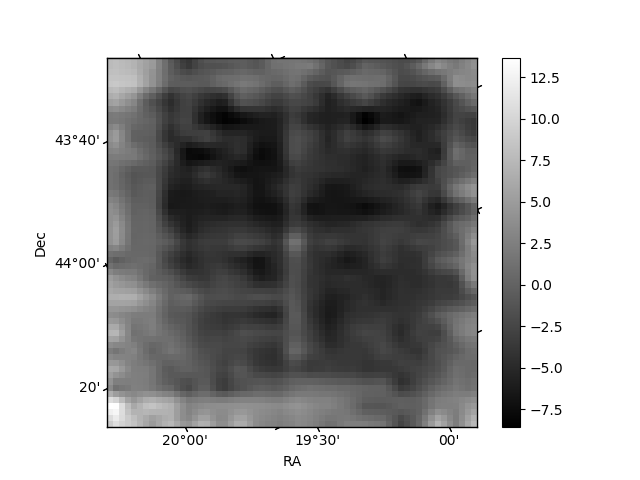
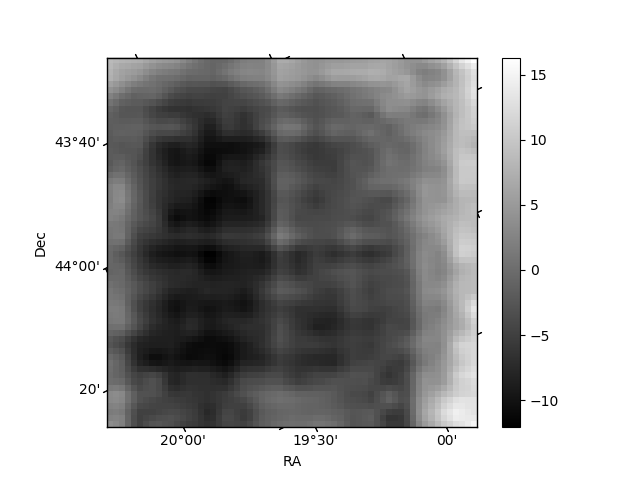
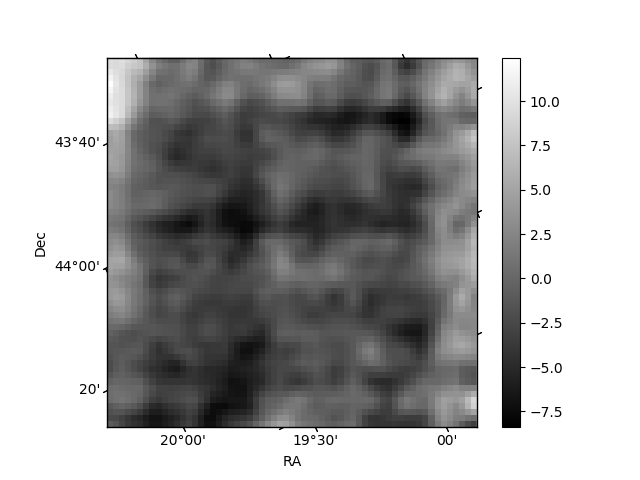
Histogram calculated using DETX and DETY for each event in the final _common_clean file
| Quadrant A | 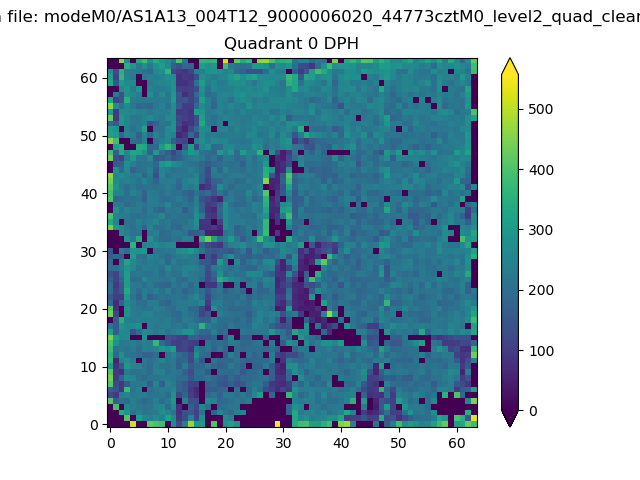 |
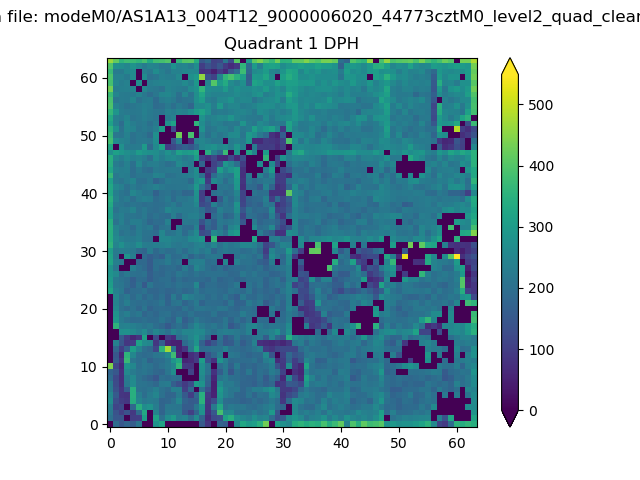 |
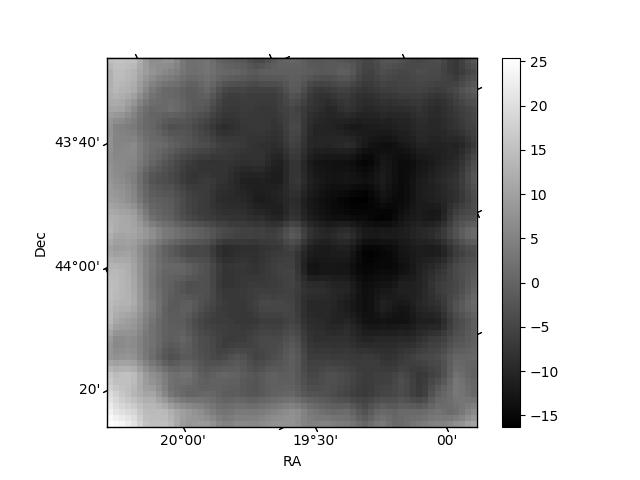
Quadrant B |
|---|---|---|---|
| Quadrant D | 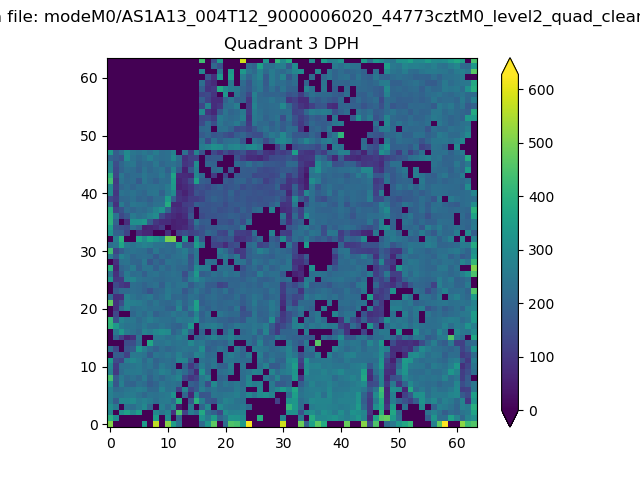 |
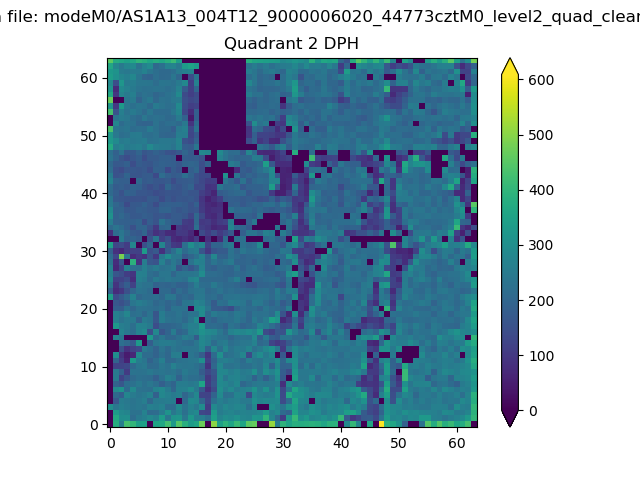 |
Quadrant C |
| Plot type | Count rate plots | Images |
|---|---|---|
| Comparison with Poisson distribution Blue bars denote a histogram of data divided into 1 sec bins. Red curve is a Poisson curve with rate = median count rate of data. |
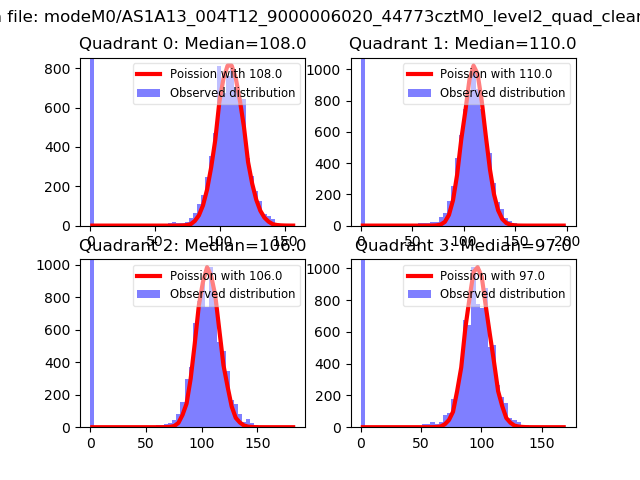 |
 |
| Quadrant-wise count rates Data is divided into 100 sec bins |
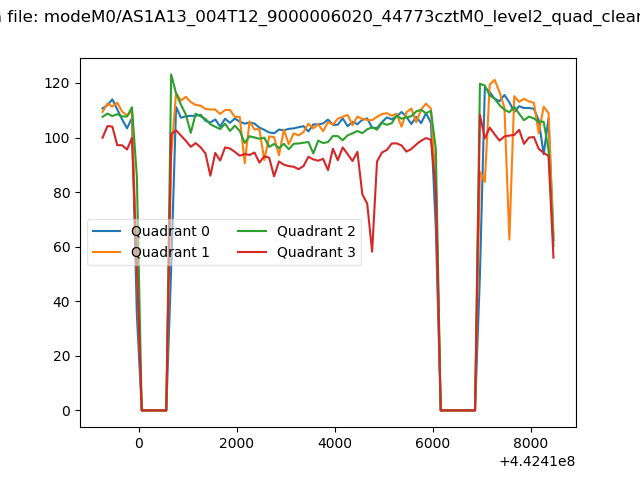 |
|
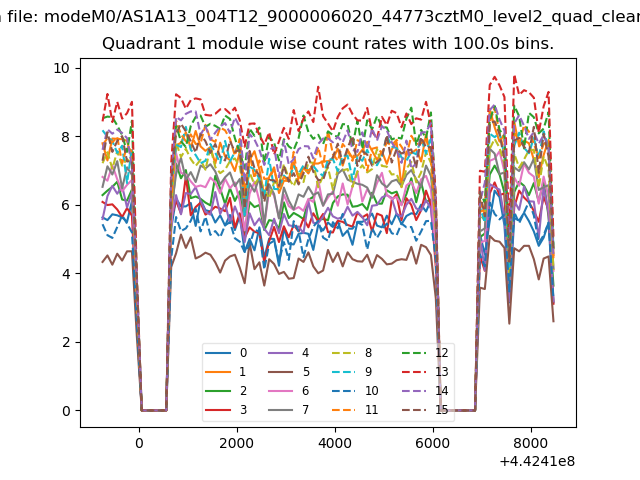
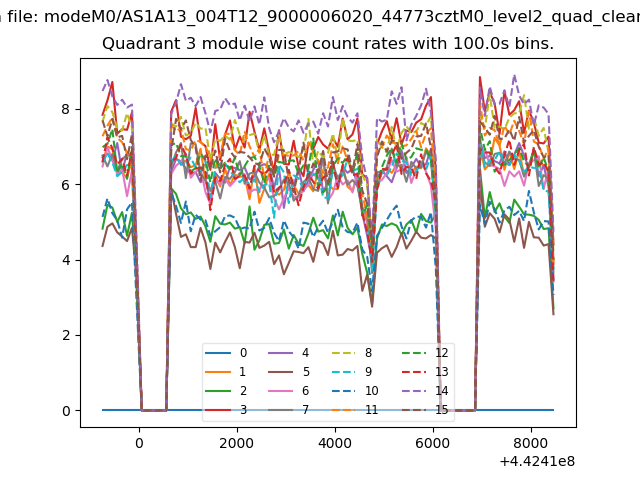
| Module-wise count rates for Quadrant A Data is divided into 100 sec bins |
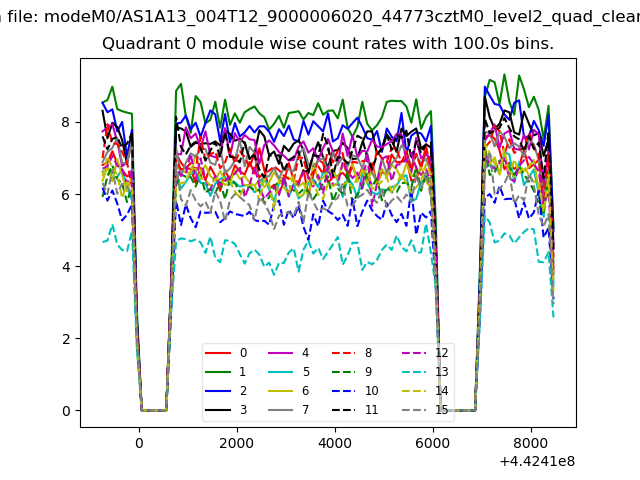 |
 |
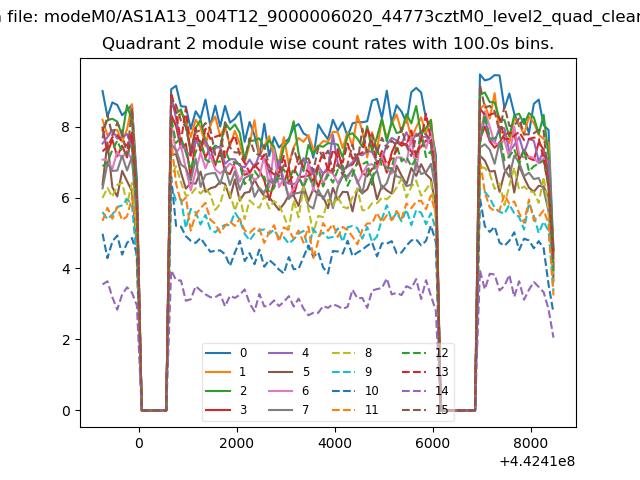
| Module-wise count rates for Quadrant B Data is divided into 100 sec bins |
 |
 |
| Module-wise count rates for Quadrant C Data is divided into 100 sec bins |
 |
 |
| Module-wise count rates for Quadrant D Data is divided into 100 sec bins |
 |
 |
| Parameter | Plot |
|---|---|
| CZT HV Monitor | 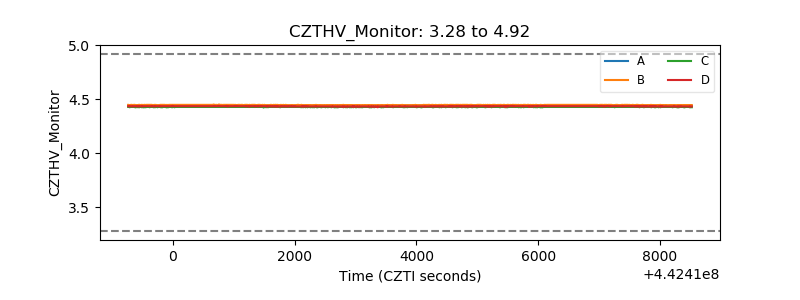 |
| D_VDD | 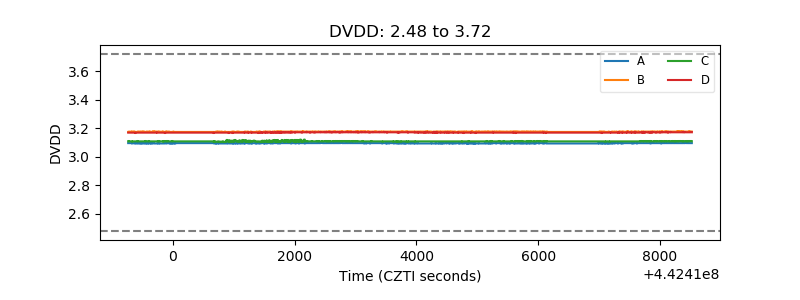 |
| Temperature 1 | 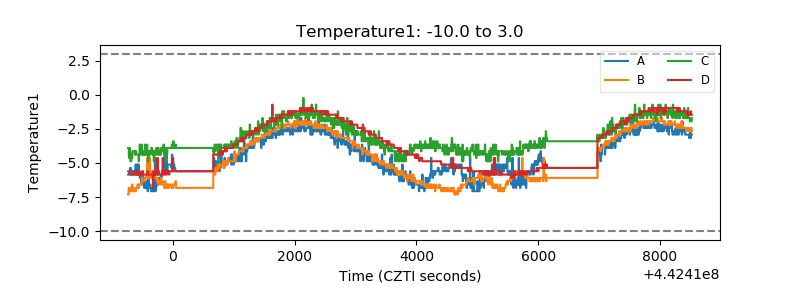 |
| Veto HV Monitor | 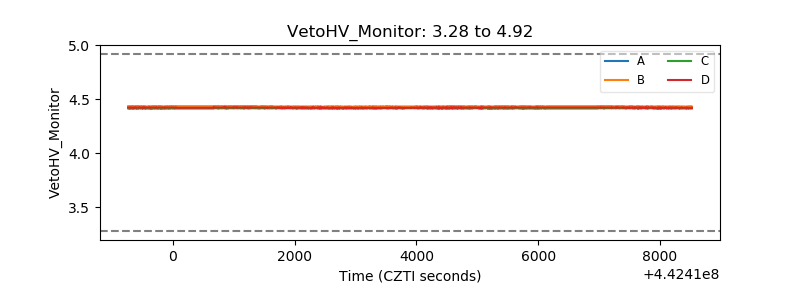 |
| Veto LLD | 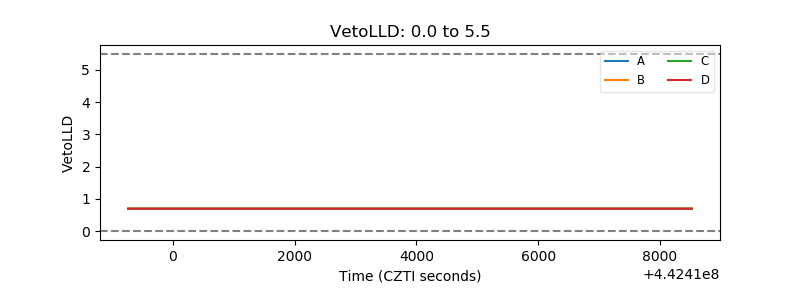 |
| Alpha Counter | 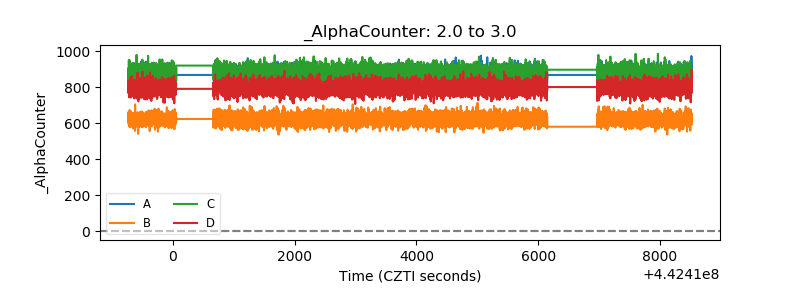 |
| _CPM_Rate | 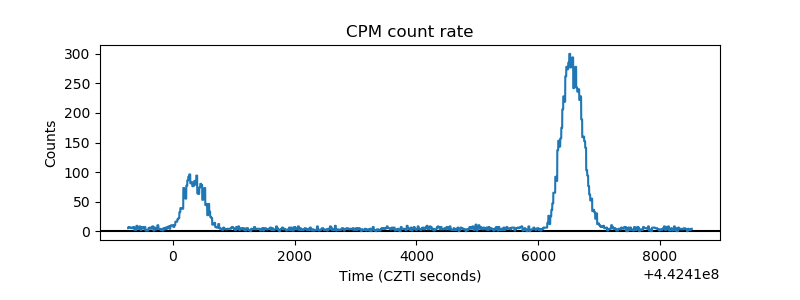 |
| CZT Counter | 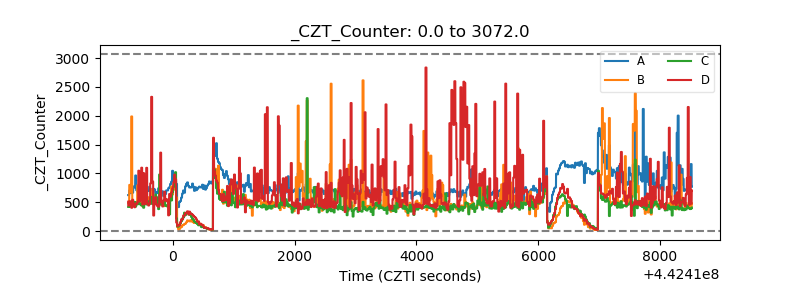 |
| +2.5 Volts monitor | 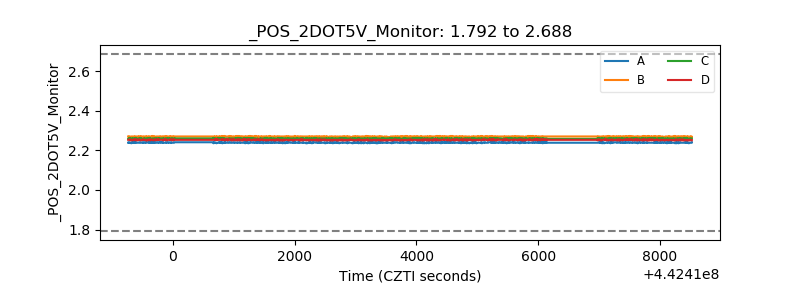 |
| +5 Volts monitor | 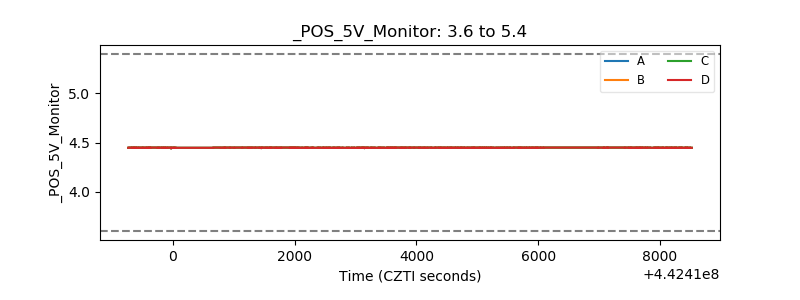 |
| _ROLL_ROT | 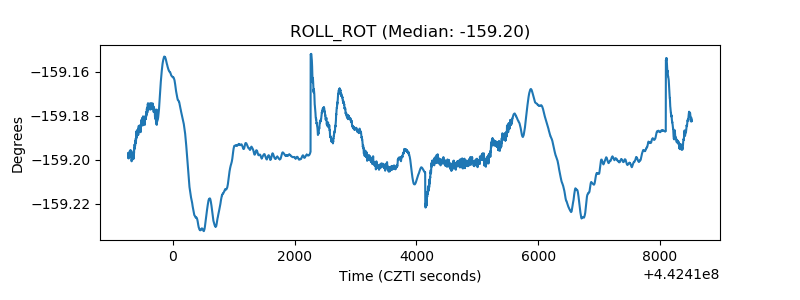 |
| _Roll_DEC | 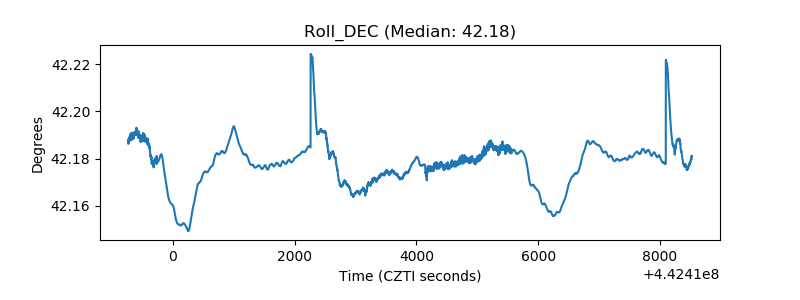 |
| _Roll_RA | 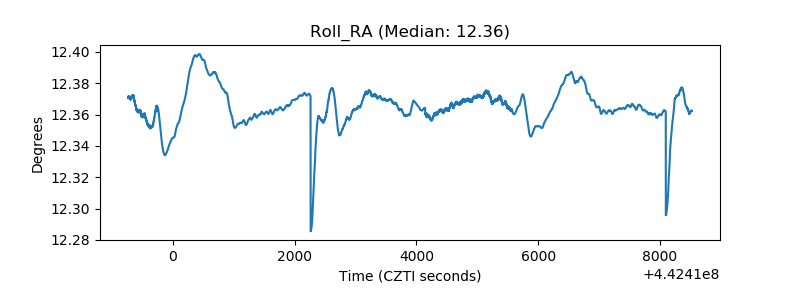 |
| Veto Counter | 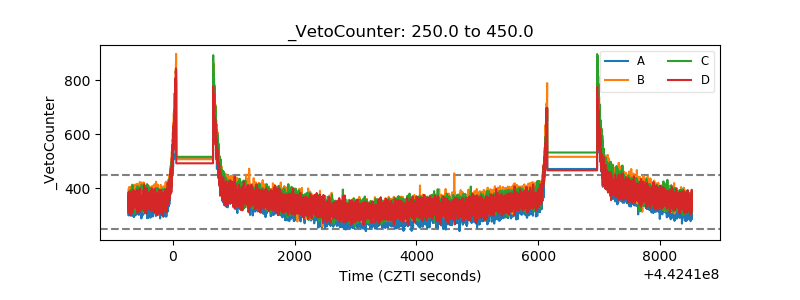 |