| Param | Original file | Final file |
|---|---|---|
| Filename | modeM0/AS1A13_004T12_9000006020_44774cztM0_level2.fits | modeM0/AS1A13_004T12_9000006020_44774cztM0_level2_quad_clean.evt |
| Size (bytes) | 509,993,280 | 93,355,200 |
| Size | 486.4 MB | 89.0 MB |
| Events in quadrant A | 6,760,589 | 565,874 |
| Events in quadrant B | 4,239,907 | 627,464 |
| Events in quadrant C | 2,751,354 | 636,764 |
| Events in quadrant D | 4,659,493 | 576,124 |
| Mode SS | |||
|---|---|---|---|
| Quadrant | BADHDUFLAG | Total packets | Discarded packets |
| A | 0 | 122 | 0 |
| B | 0 | 122 | 0 |
| C | 0 | 122 | 0 |
| D | 0 | 122 | 0 |
| Mode M0 | |||
|---|---|---|---|
| Quadrant | BADHDUFLAG | Total packets | Discarded packets |
| A | 0 | 24685 | 1 |
| B | 0 | 16618 | 1 |
| C | 0 | 12655 | 1 |
| D | 0 | 17923 | 1 |
| Mode M9 | |||
|---|---|---|---|
| Quadrant | BADHDUFLAG | Total packets | Discarded packets |
| A | 0 | 10 | 0 |
| B | 0 | 10 | 0 |
| C | 0 | 10 | 0 |
| D | 0 | 10 | 0 |
| Quadrant | Total seconds | Saturated seconds | Saturation percentage |
|---|---|---|---|
| A | 6018 | 986 | 16.384181% |
| B | 6018 | 456 | 7.577268% |
| C | 6018 | 53 | 0.880691% |
| D | 6019 | 258 | 4.286426% |
Noise dominated data is calculated using 1-second bins in cleaned event files. If a bin has >2000 counts, and if more than 50% of those come from <1% of pixels, then it is considered to be noise-dominated and hence unusable.
| Quadrant | # 1 sec bins | Bins with >0 counts | Bins with >2000 counts | High rate bins dominated by noise | Noise dominated (total time) | Noise dominated (detector-on time) | Marked lightcurve |
|---|---|---|---|---|---|---|---|
| A | 7023 | 6018 | 740 | 740 | 10.54% | 12.30% | 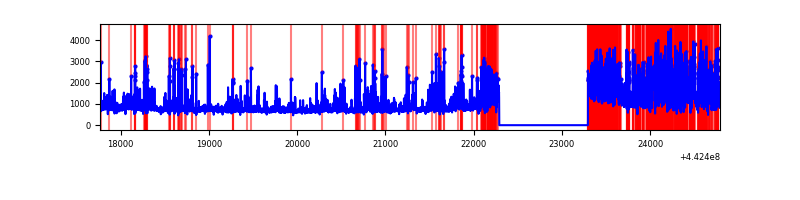 |
| B | 7023 | 6018 | 337 | 337 | 4.80% | 5.60% | 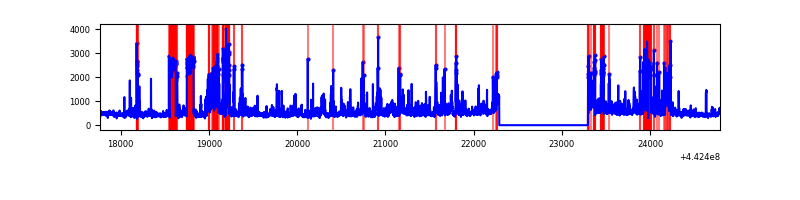 |
| C | 7023 | 6019 | 19 | 19 | 0.27% | 0.32% | 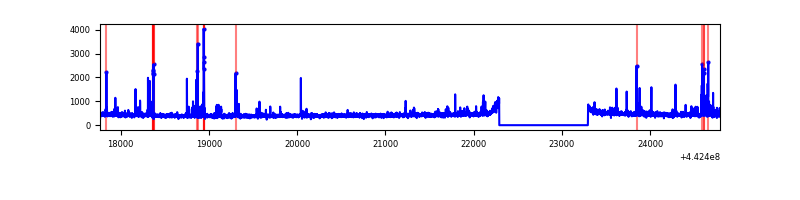 |
| D | 7024 | 6020 | 221 | 221 | 3.15% | 3.67% | 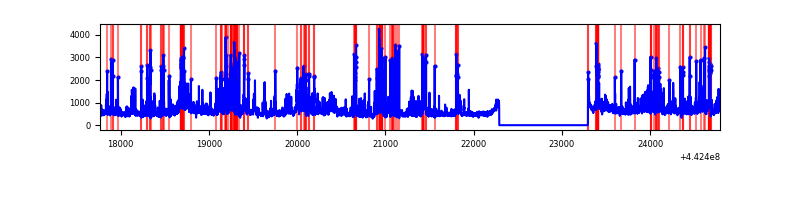 |
Top three noisy pixels from each quadrant. If the there are fewer than three noisy pixels in the level2.evt file, extra rows are filled as -1
| Pixel properties | Quadrant properties | ||||||
|---|---|---|---|---|---|---|---|
| Quadrant | DetID | PixID | Counts | Sigma | Mean | Median | Sigma |
| A | 15 | 223 | 2463055 | 19235.52 | 619 | 605 | 128.0 |
| A | 10 | 83 | 1754699 | 13702.17 | 619 | 605 | 128.0 |
| A | 13 | 248 | 107115 | 832.01 | 619 | 605 | 128.0 |
| B | 0 | 189 | 1012510 | 8015.89 | 634 | 615 | 126.2 |
| B | 4 | 171 | 379397 | 3000.58 | 634 | 615 | 126.2 |
| B | 5 | 255 | 142977 | 1127.74 | 634 | 615 | 126.2 |
| C | 14 | 254 | 169736 | 1116.42 | 646 | 648 | 151.5 |
| C | 12 | 249 | 32322 | 209.13 | 646 | 648 | 151.5 |
| C | 0 | 207 | 10247 | 63.38 | 646 | 648 | 151.5 |
| D | 13 | 249 | 448865 | 2780.89 | 642 | 622 | 161.2 |
| D | 11 | 241 | 410984 | 2545.88 | 642 | 622 | 161.2 |
| D | 13 | 174 | 358422 | 2219.79 | 642 | 622 | 161.2 |
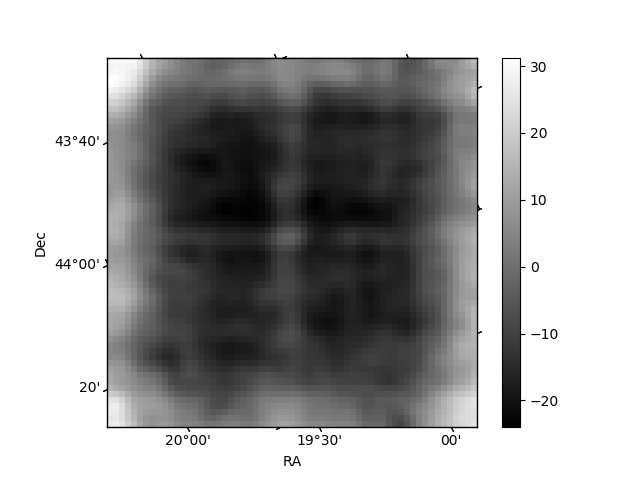
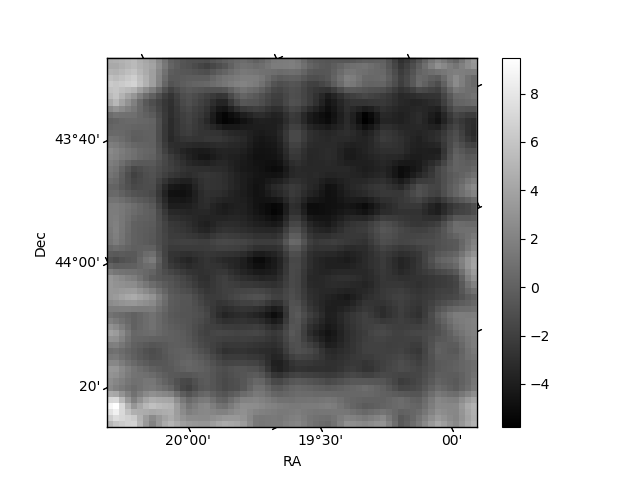
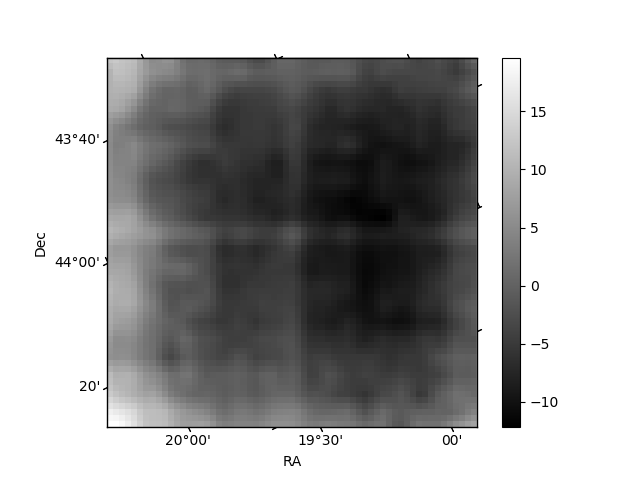
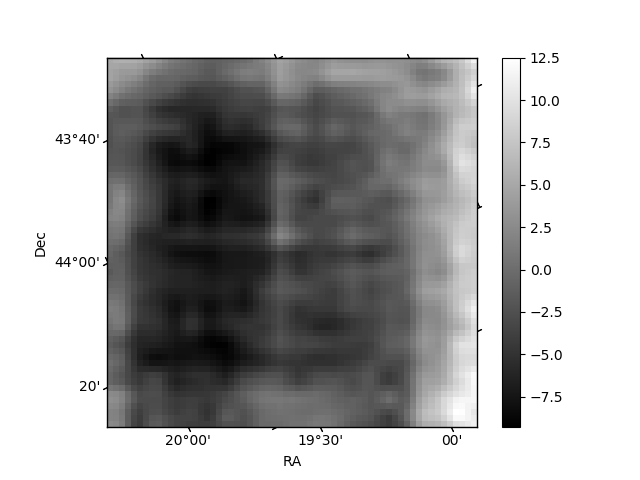
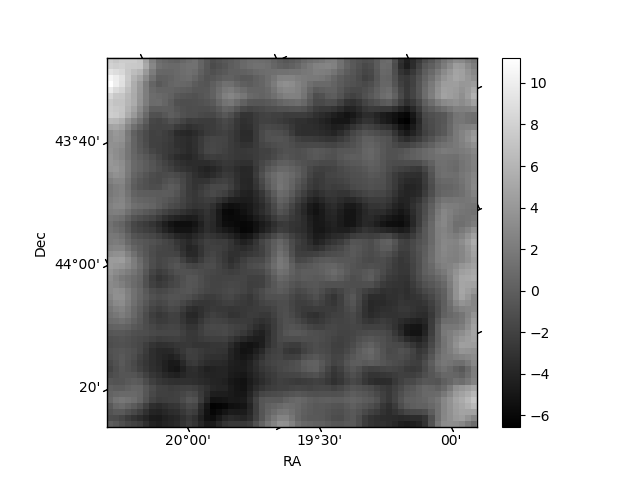
Histogram calculated using DETX and DETY for each event in the final _common_clean file
| Quadrant A | 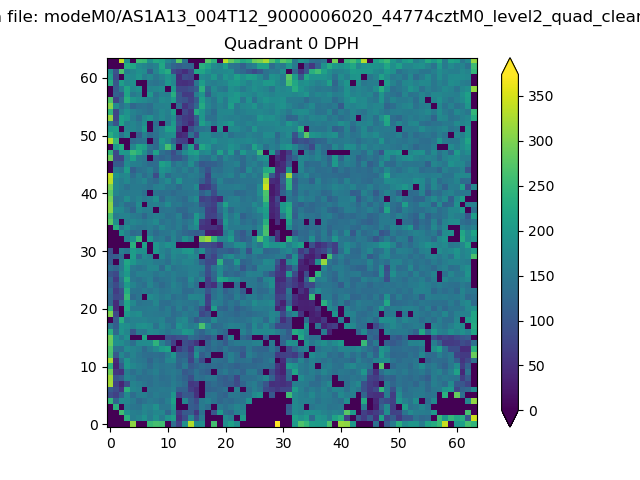 |
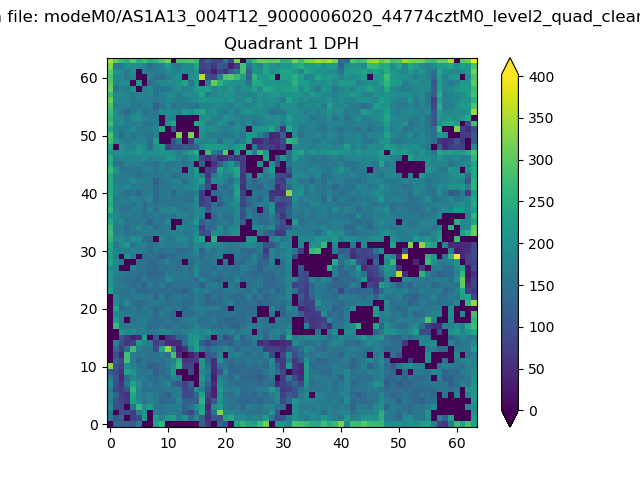 |
Quadrant B |
|---|---|---|---|
| Quadrant D | 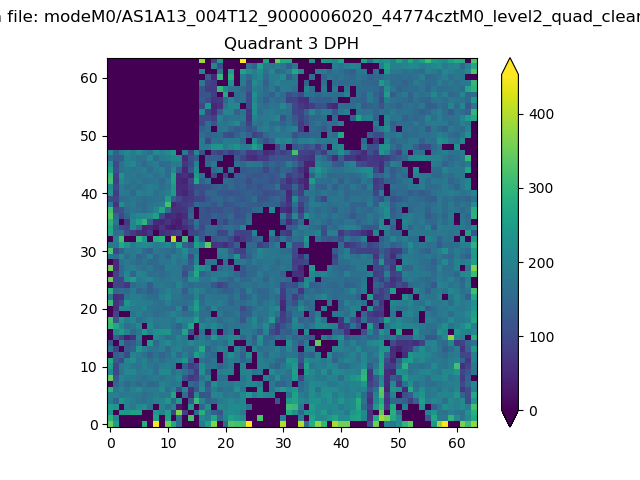 |
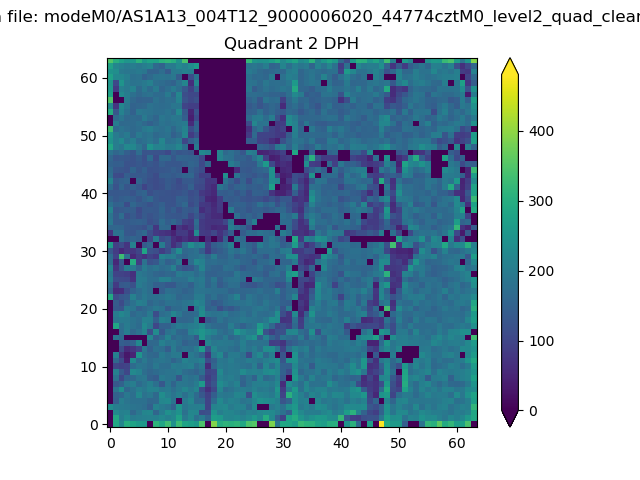 |
Quadrant C |
| Plot type | Count rate plots | Images |
|---|---|---|
| Comparison with Poisson distribution Blue bars denote a histogram of data divided into 1 sec bins. Red curve is a Poisson curve with rate = median count rate of data. |
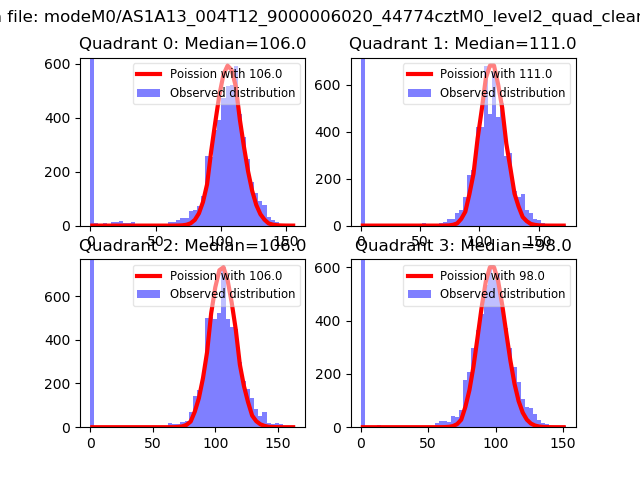 |
 |
| Quadrant-wise count rates Data is divided into 100 sec bins |
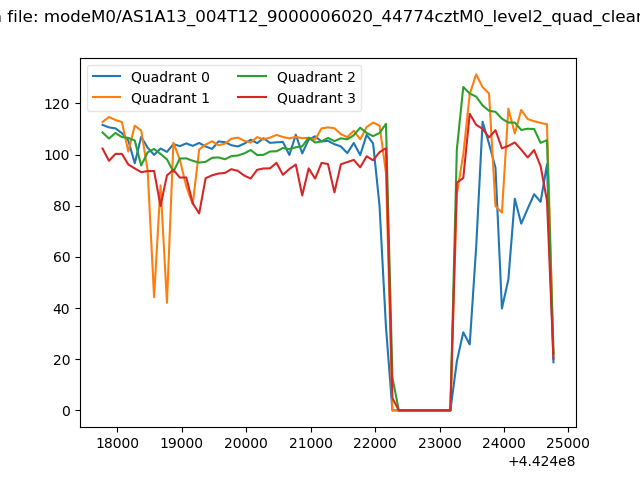 |
|
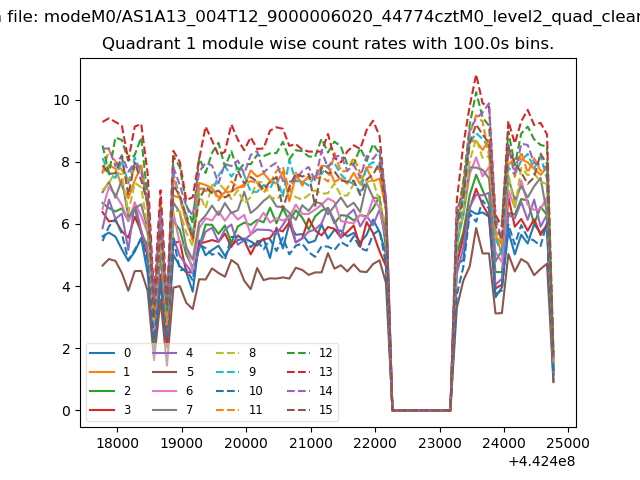
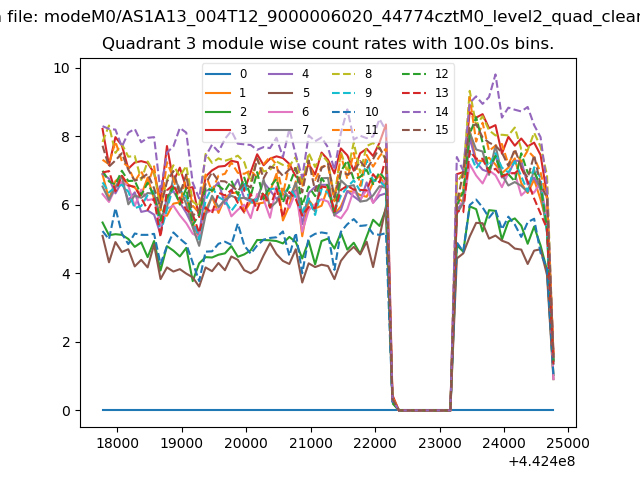
| Module-wise count rates for Quadrant A Data is divided into 100 sec bins |
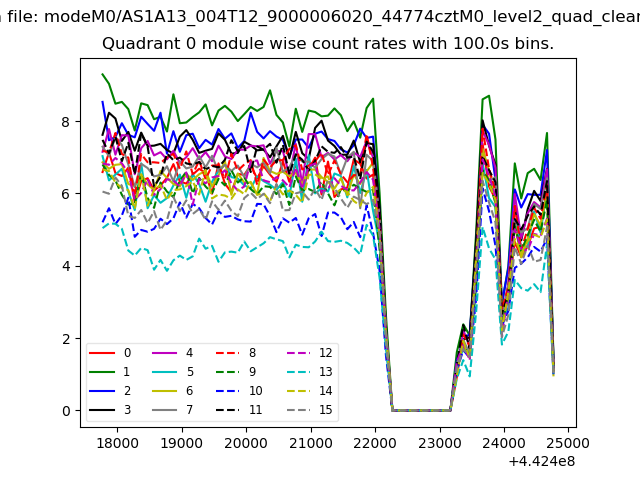 |
 |
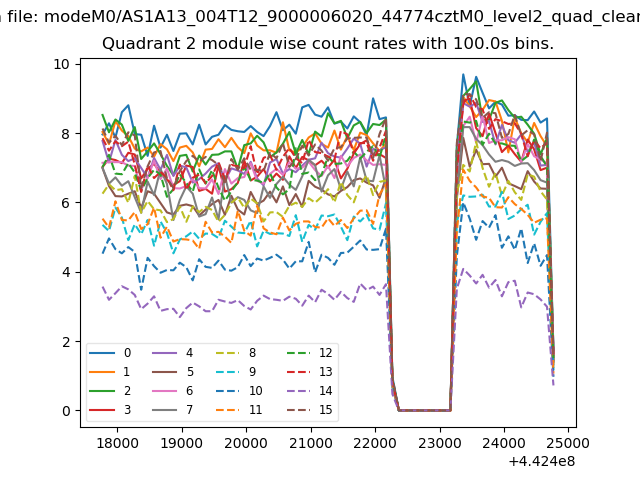
| Module-wise count rates for Quadrant B Data is divided into 100 sec bins |
 |
 |
| Module-wise count rates for Quadrant C Data is divided into 100 sec bins |
 |
 |
| Module-wise count rates for Quadrant D Data is divided into 100 sec bins |
 |
 |
| Parameter | Plot |
|---|---|
| CZT HV Monitor | 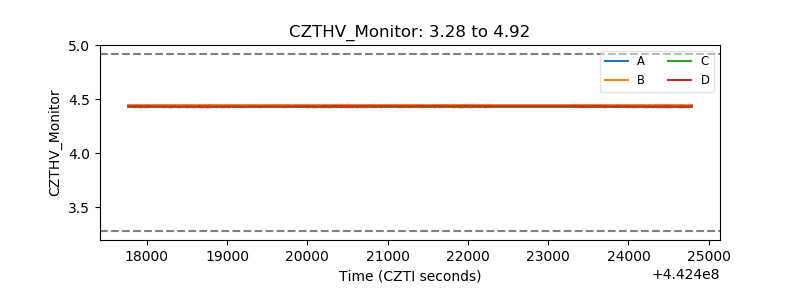 |
| D_VDD | 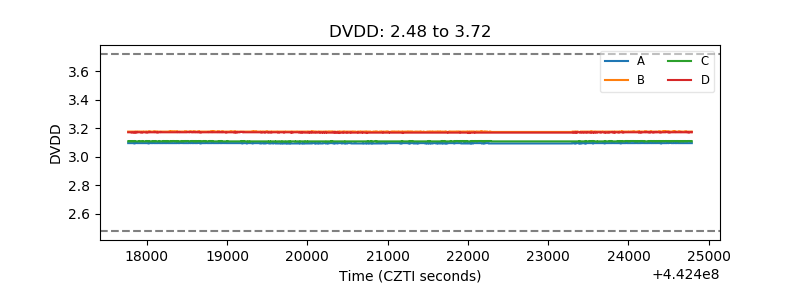 |
| Temperature 1 | 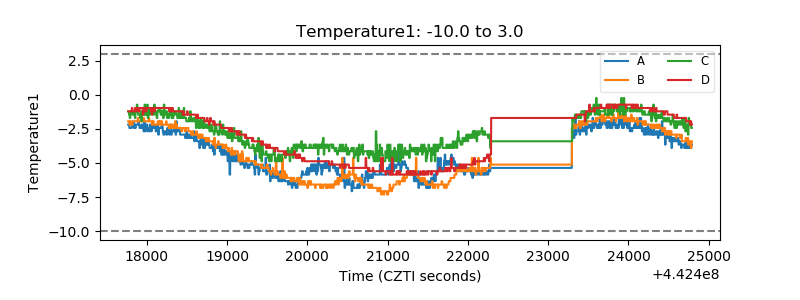 |
| Veto HV Monitor |  |
| Veto LLD | 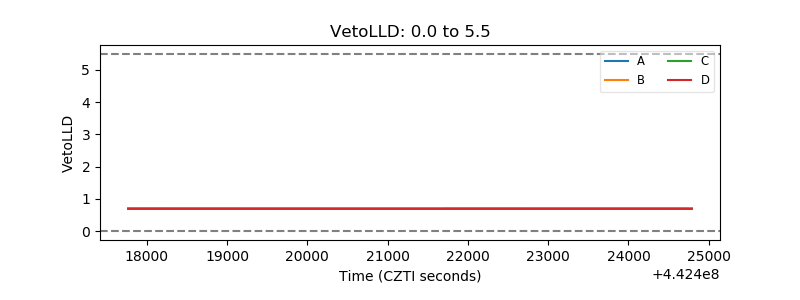 |
| Alpha Counter | 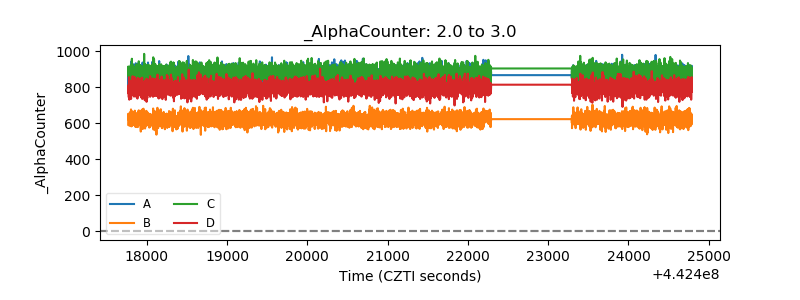 |
| _CPM_Rate |  |
| CZT Counter | 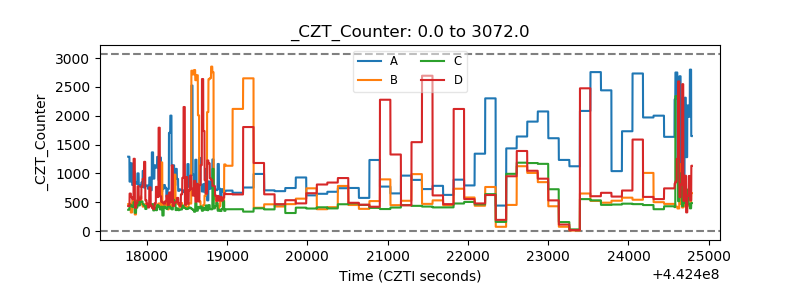 |
| +2.5 Volts monitor | 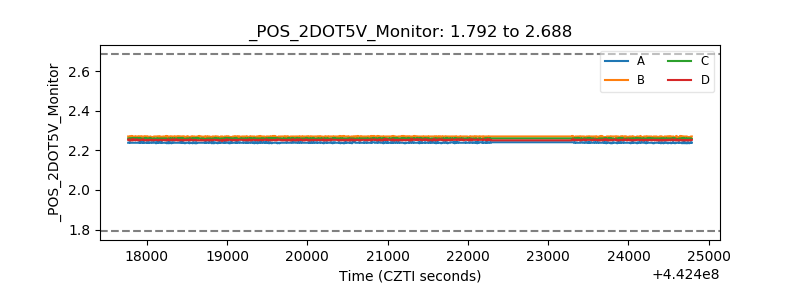 |
| +5 Volts monitor | 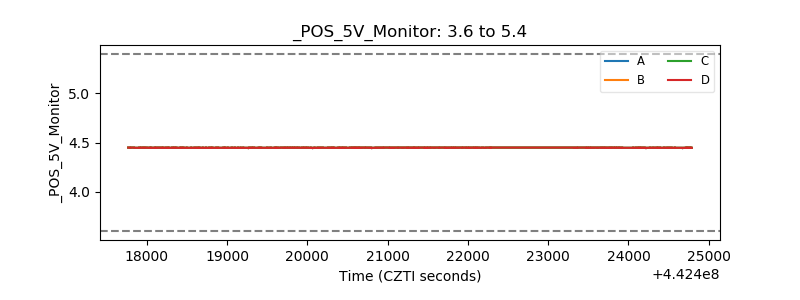 |
| _ROLL_ROT | 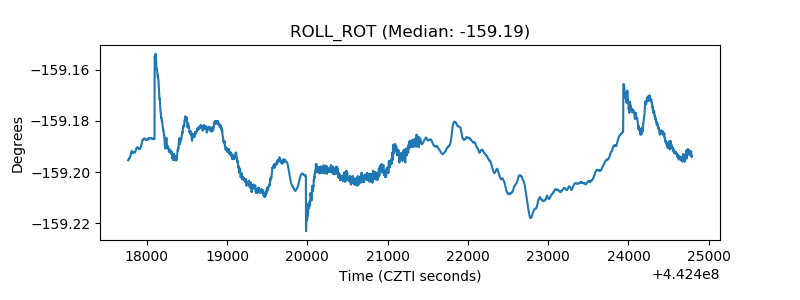 |
| _Roll_DEC | 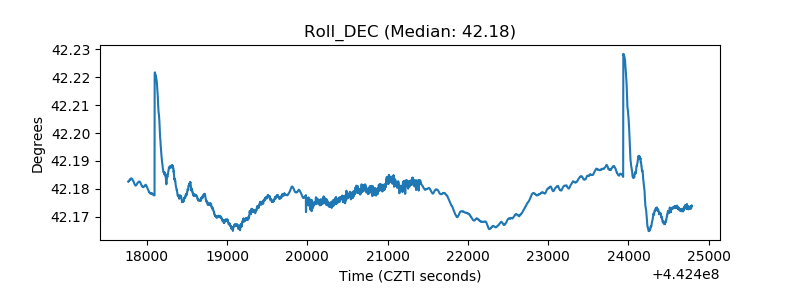 |
| _Roll_RA | 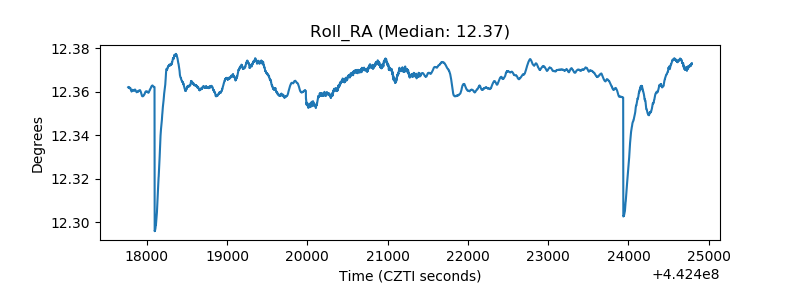 |
| Veto Counter | 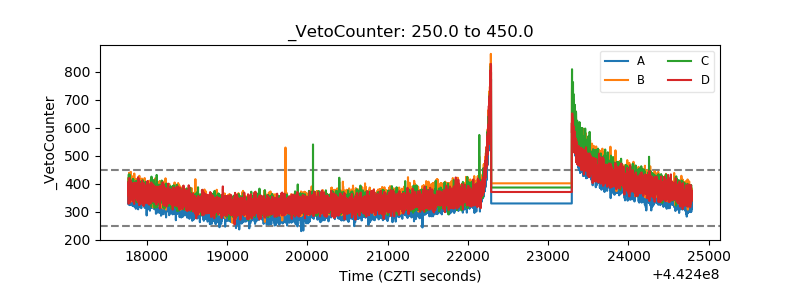 |