| Param | Original file | Final file |
|---|---|---|
| Filename | modeM0/AS1A13_004T12_9000006020_44778cztM0_level2.fits | modeM0/AS1A13_004T12_9000006020_44778cztM0_level2_quad_clean.evt |
| Size (bytes) | 570,605,760 | 91,972,800 |
| Size | 544.2 MB | 87.7 MB |
| Events in quadrant A | 6,679,146 | 622,843 |
| Events in quadrant B | 4,055,274 | 654,034 |
| Events in quadrant C | 2,774,685 | 675,007 |
| Events in quadrant D | 7,166,488 | 430,866 |
| Mode SS | |||
|---|---|---|---|
| Quadrant | BADHDUFLAG | Total packets | Discarded packets |
| A | 0 | 116 | 0 |
| B | 0 | 116 | 0 |
| C | 0 | 116 | 0 |
| D | 0 | 116 | 0 |
| Mode M0 | |||
|---|---|---|---|
| Quadrant | BADHDUFLAG | Total packets | Discarded packets |
| A | 0 | 23900 | 1 |
| B | 0 | 15932 | 1 |
| C | 0 | 12223 | 1 |
| D | 0 | 25279 | 1 |
| Mode M9 | |||
|---|---|---|---|
| Quadrant | BADHDUFLAG | Total packets | Discarded packets |
| A | 0 | 12 | 0 |
| B | 0 | 12 | 0 |
| C | 0 | 12 | 0 |
| D | 0 | 12 | 0 |
| Quadrant | Total seconds | Saturated seconds | Saturation percentage |
|---|---|---|---|
| A | 5753 | 631 | 10.968191% |
| B | 5754 | 454 | 7.890163% |
| C | 5754 | 54 | 0.938478% |
| D | 5754 | 1822 | 31.664929% |
Noise dominated data is calculated using 1-second bins in cleaned event files. If a bin has >2000 counts, and if more than 50% of those come from <1% of pixels, then it is considered to be noise-dominated and hence unusable.
| Quadrant | # 1 sec bins | Bins with >0 counts | Bins with >2000 counts | High rate bins dominated by noise | Noise dominated (total time) | Noise dominated (detector-on time) | Marked lightcurve |
|---|---|---|---|---|---|---|---|
| A | 6948 | 5754 | 459 | 459 | 6.61% | 7.98% | 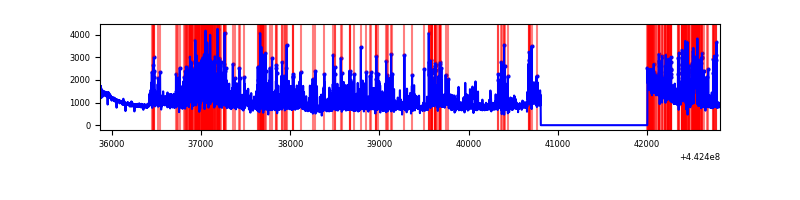 |
| B | 6949 | 5754 | 338 | 338 | 4.86% | 5.87% | 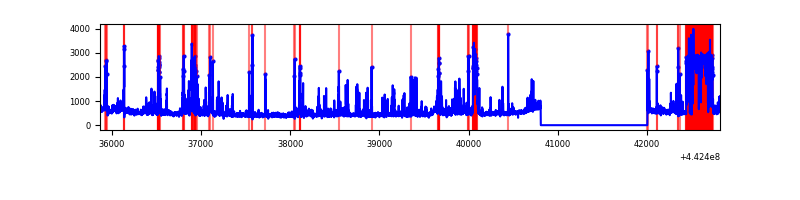 |
| C | 6949 | 5755 | 9 | 9 | 0.13% | 0.16% | 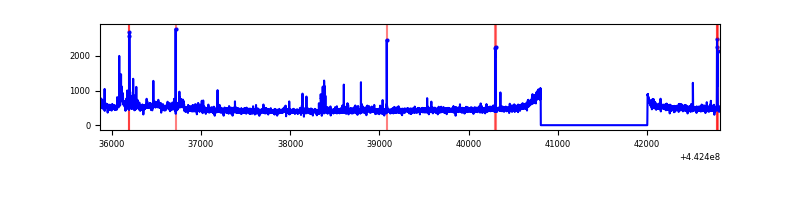 |
| D | 6949 | 5754 | 1569 | 1569 | 22.58% | 27.27% | 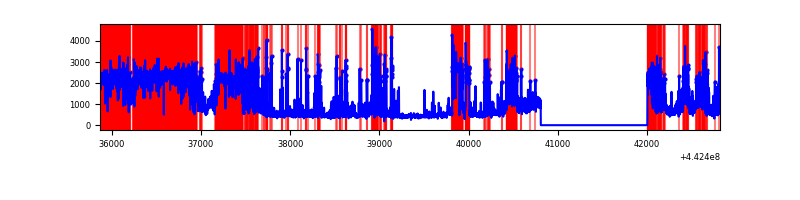 |
Top three noisy pixels from each quadrant. If the there are fewer than three noisy pixels in the level2.evt file, extra rows are filled as -1
| Pixel properties | Quadrant properties | ||||||
|---|---|---|---|---|---|---|---|
| Quadrant | DetID | PixID | Counts | Sigma | Mean | Median | Sigma |
| A | 15 | 223 | 1853848 | 14071.51 | 642 | 628 | 131.7 |
| A | 10 | 83 | 1825062 | 13852.93 | 642 | 628 | 131.7 |
| A | 13 | 248 | 413147 | 3132.26 | 642 | 628 | 131.7 |
| B | 4 | 171 | 645627 | 5113.88 | 645 | 624 | 126.1 |
| B | 0 | 189 | 374807 | 2966.69 | 645 | 624 | 126.1 |
| B | 5 | 255 | 206677 | 1633.68 | 645 | 624 | 126.1 |
| C | 2 | 16 | 71476 | 456.36 | 666 | 670 | 155.2 |
| C | 3 | 233 | 47068 | 299.05 | 666 | 670 | 155.2 |
| C | 2 | 14 | 21095 | 131.64 | 666 | 670 | 155.2 |
| D | 13 | 174 | 1908051 | 13798.33 | 551 | 535 | 138.2 |
| D | 1 | 52 | 1361727 | 9846.4 | 551 | 535 | 138.2 |
| D | 2 | 249 | 514362 | 3716.85 | 551 | 535 | 138.2 |
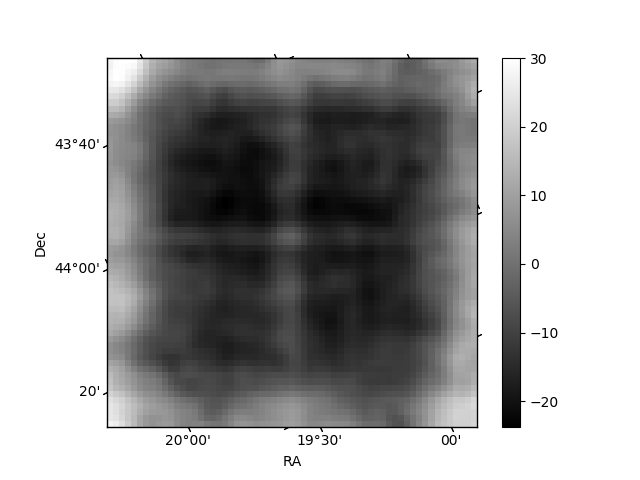
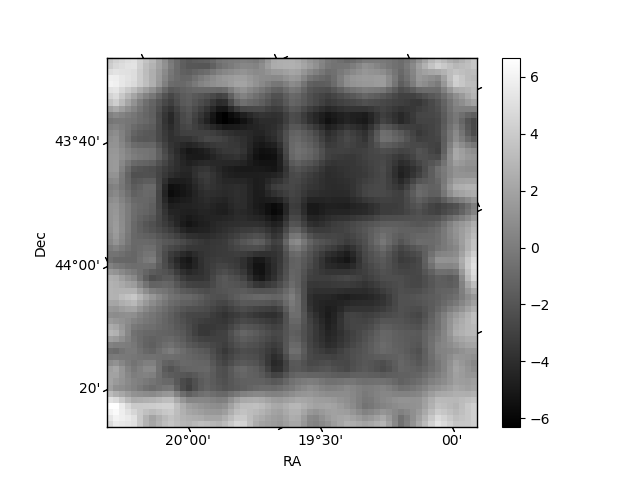
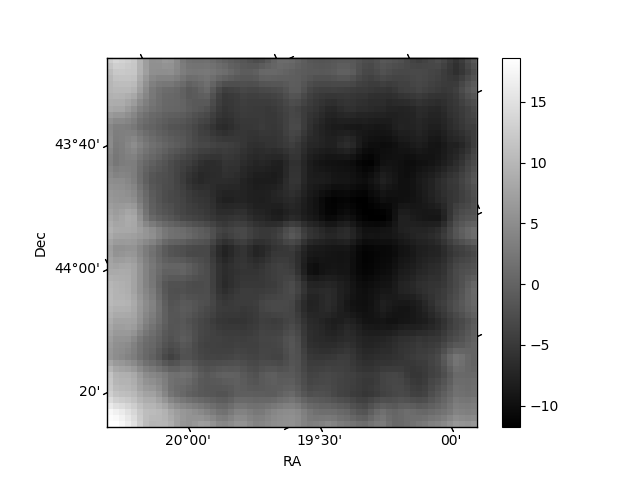
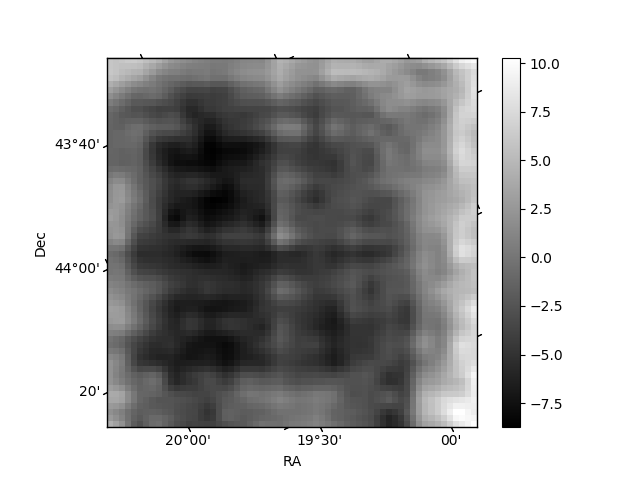
Histogram calculated using DETX and DETY for each event in the final _common_clean file
| Quadrant A | 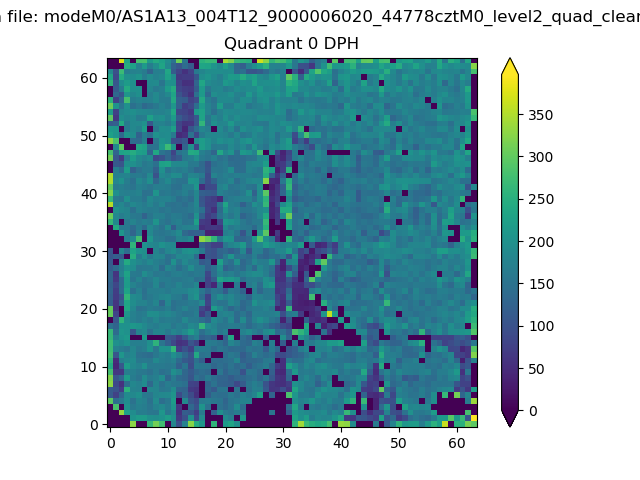 |
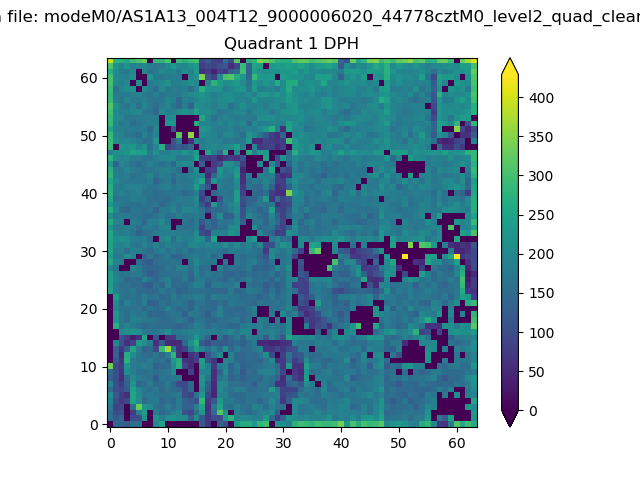 |
Quadrant B |
|---|---|---|---|
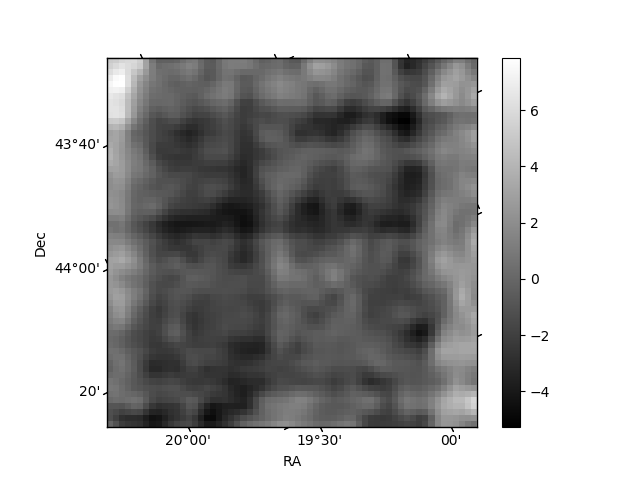
| Quadrant D | 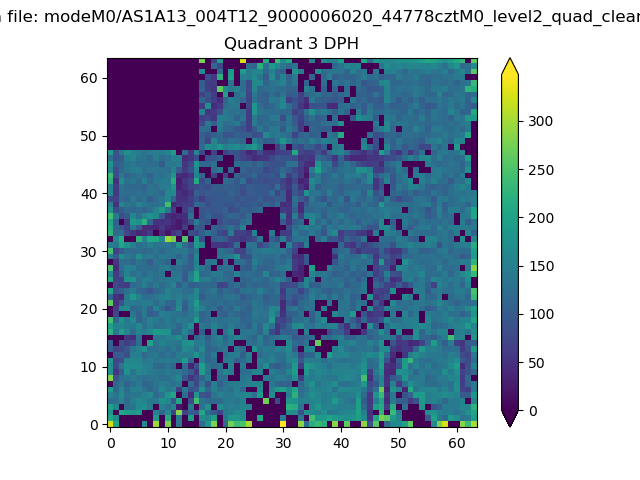 |
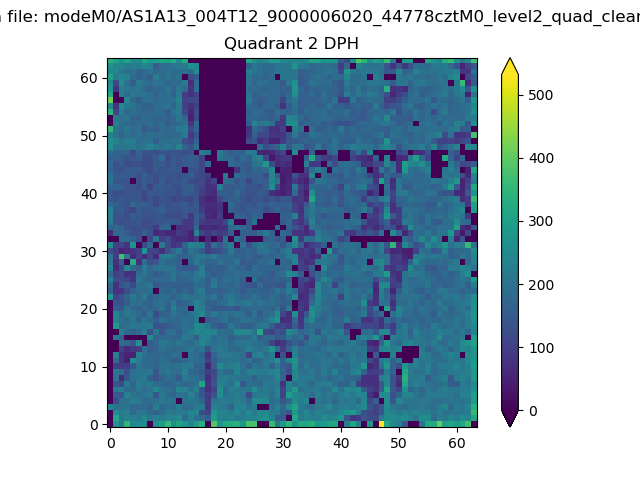 |
Quadrant C |
| Plot type | Count rate plots | Images |
|---|---|---|
| Comparison with Poisson distribution Blue bars denote a histogram of data divided into 1 sec bins. Red curve is a Poisson curve with rate = median count rate of data. |
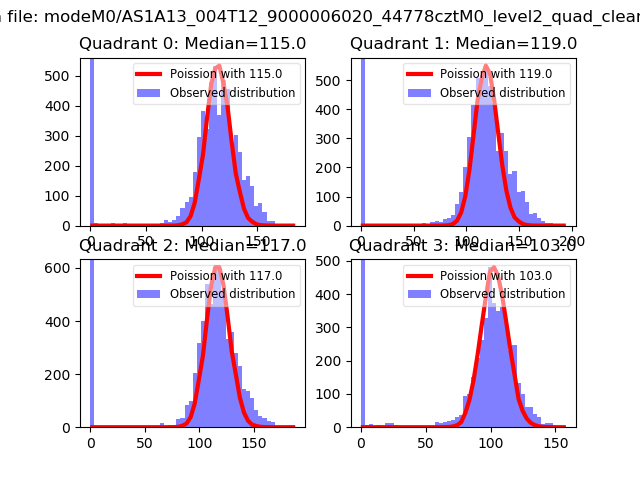 |
 |
| Quadrant-wise count rates Data is divided into 100 sec bins |
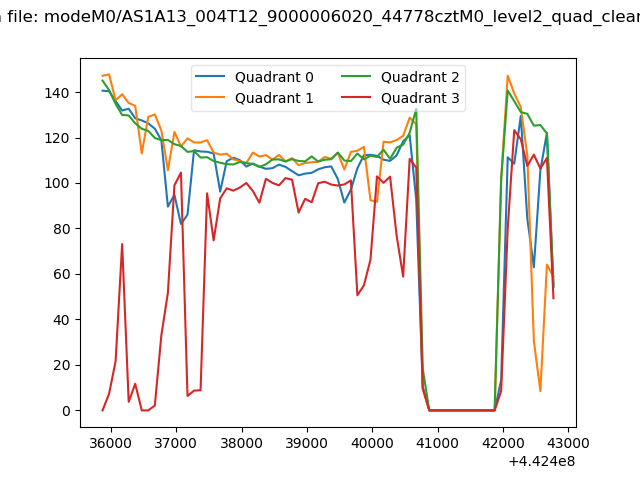 |
|
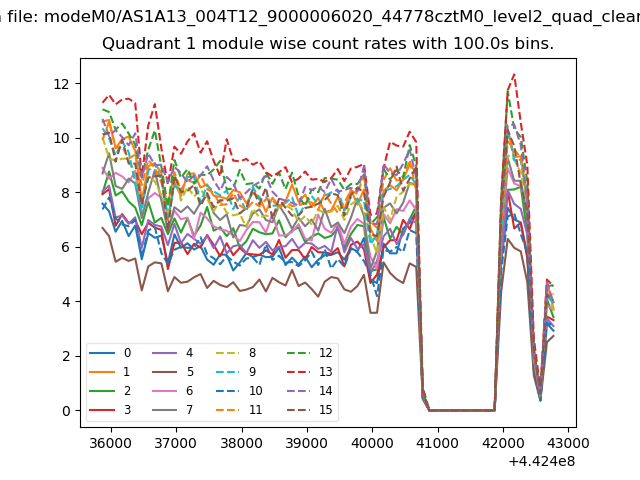
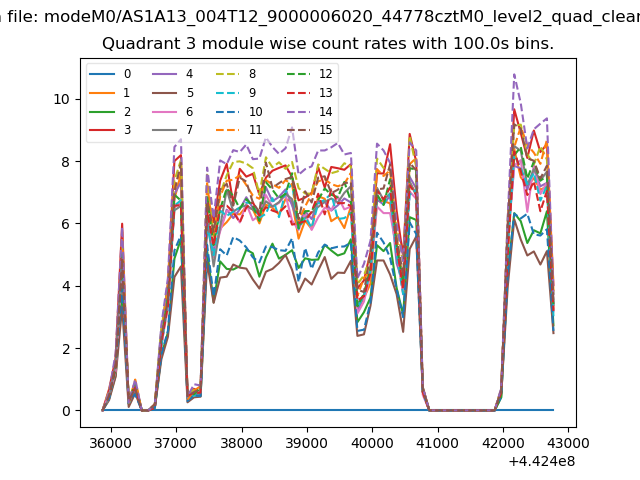
| Module-wise count rates for Quadrant A Data is divided into 100 sec bins |
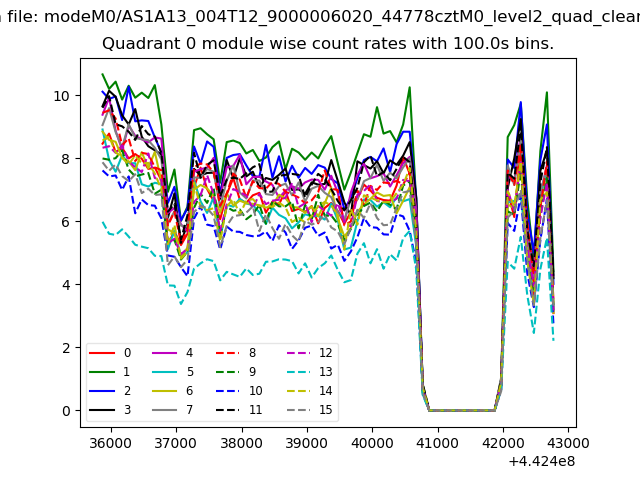 |
 |
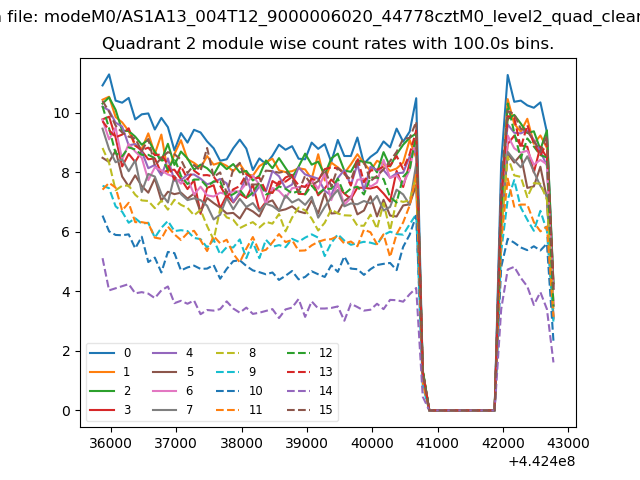
| Module-wise count rates for Quadrant B Data is divided into 100 sec bins |
 |
 |
| Module-wise count rates for Quadrant C Data is divided into 100 sec bins |
 |
 |
| Module-wise count rates for Quadrant D Data is divided into 100 sec bins |
 |
 |
| Parameter | Plot |
|---|---|
| CZT HV Monitor | 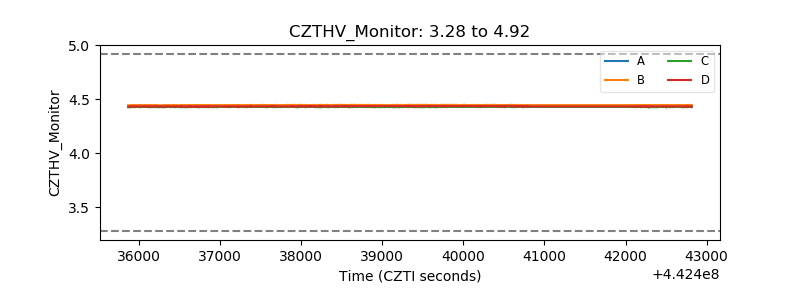 |
| D_VDD | 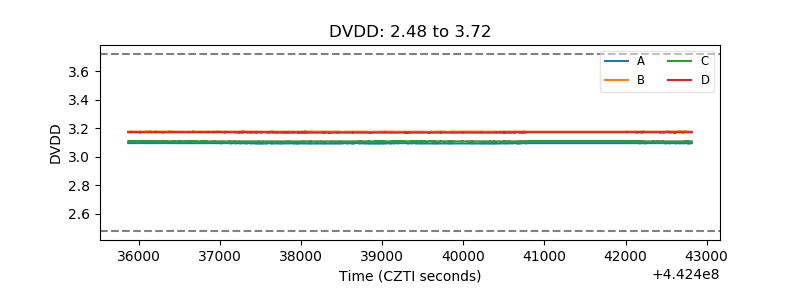 |
| Temperature 1 | 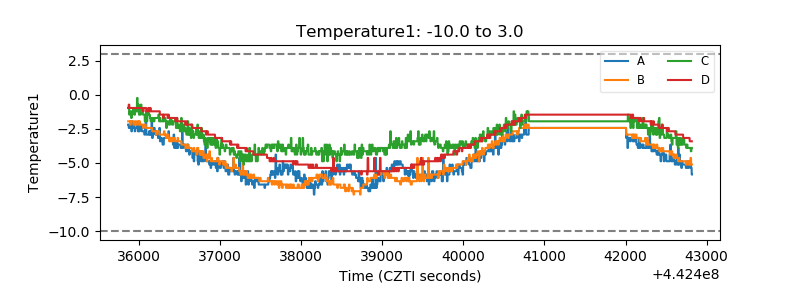 |
| Veto HV Monitor |  |
| Veto LLD | 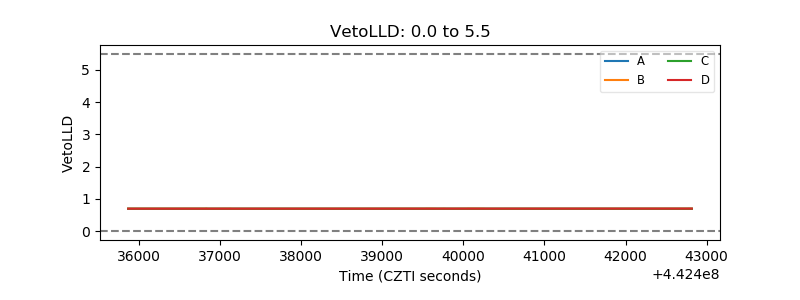 |
| Alpha Counter | 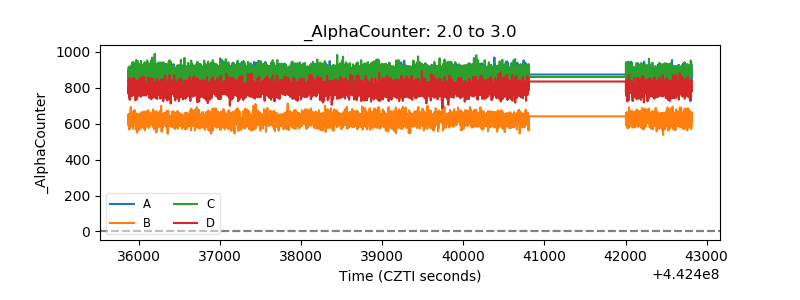 |
| _CPM_Rate |  |
| CZT Counter | 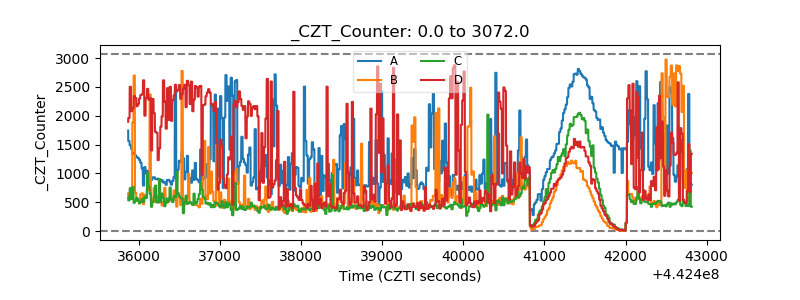 |
| +2.5 Volts monitor | 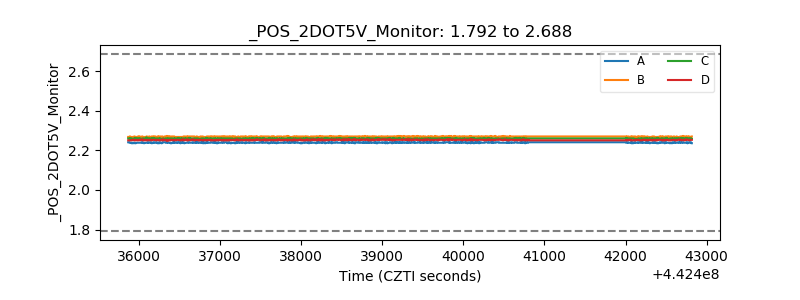 |
| +5 Volts monitor | 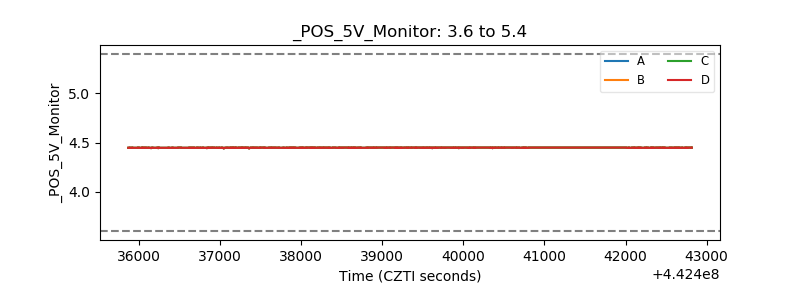 |
| _ROLL_ROT | 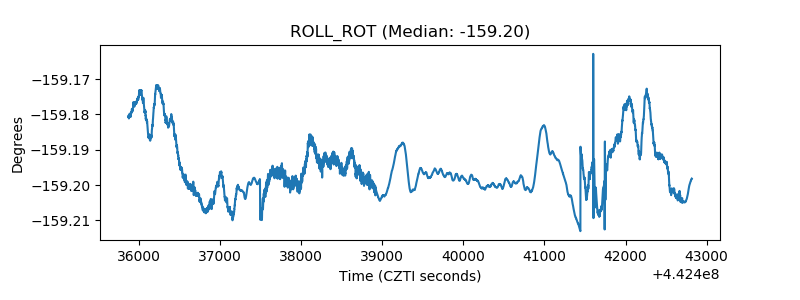 |
| _Roll_DEC | 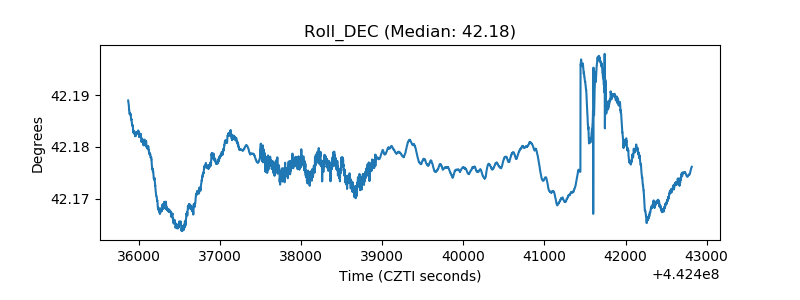 |
| _Roll_RA | 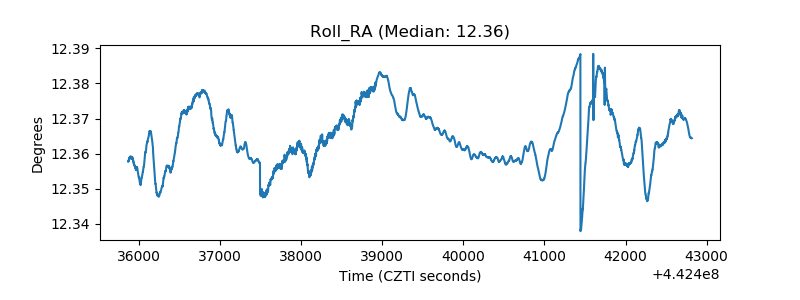 |
| Veto Counter | 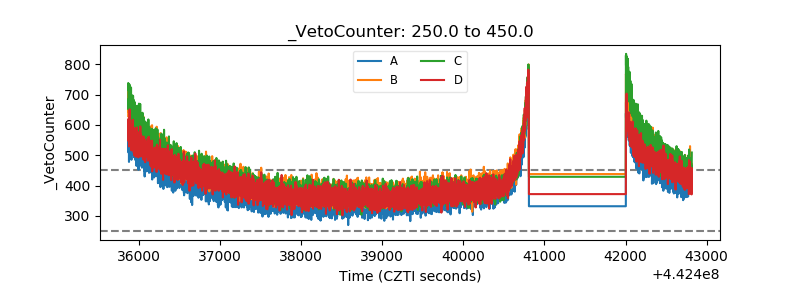 |