| Param | Original file | Final file |
|---|---|---|
| Filename | modeM0/AS1A13_004T13_9000006022_44778cztM0_level2.fits | modeM0/AS1A13_004T13_9000006022_44778cztM0_level2_quad_clean.evt |
| Size (bytes) | 25,560,000 | 4,536,000 |
| Size | 24.4 MB | 4.3 MB |
| Events in quadrant A | 278,499 | 28,956 |
| Events in quadrant B | 153,896 | 31,838 |
| Events in quadrant C | 122,202 | 29,522 |
| Events in quadrant D | 366,666 | 19,823 |
| Mode M0 | |||
|---|---|---|---|
| Quadrant | BADHDUFLAG | Total packets | Discarded packets |
| A | 0 | 1024 | 0 |
| B | 0 | 627 | 0 |
| C | 0 | 552 | 0 |
| D | 0 | 1278 | 1 |
| Mode SS | |||
|---|---|---|---|
| Quadrant | BADHDUFLAG | Total packets | Discarded packets |
| A | 0 | 6 | 0 |
| B | 0 | 6 | 0 |
| C | 0 | 6 | 0 |
| D | 0 | 6 | 0 |
| Quadrant | Total seconds | Saturated seconds | Saturation percentage |
|---|---|---|---|
| A | 275 | 16 | 5.818182% |
| B | 275 | 0 | 0.000000% |
| C | 275 | 0 | 0.000000% |
| D | 274 | 70 | 25.547445% |
Noise dominated data is calculated using 1-second bins in cleaned event files. If a bin has >2000 counts, and if more than 50% of those come from <1% of pixels, then it is considered to be noise-dominated and hence unusable.
| Quadrant | # 1 sec bins | Bins with >0 counts | Bins with >2000 counts | High rate bins dominated by noise | Noise dominated (total time) | Noise dominated (detector-on time) | Marked lightcurve |
|---|---|---|---|---|---|---|---|
| A | 275 | 275 | 15 | 15 | 5.45% | 5.45% | 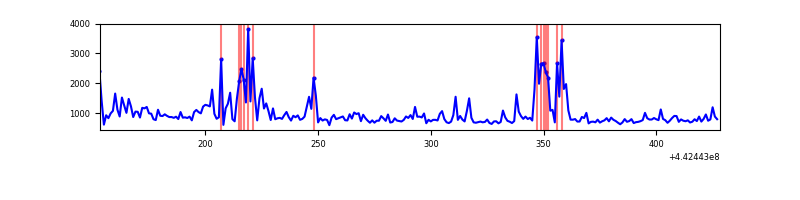 |
| B | 275 | 275 | 0 | 0 | 0.00% | 0.00% | 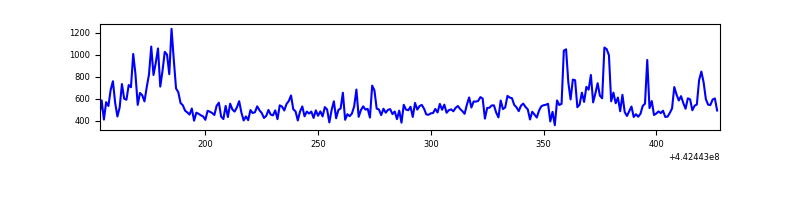 |
| C | 275 | 275 | 0 | 0 | 0.00% | 0.00% | 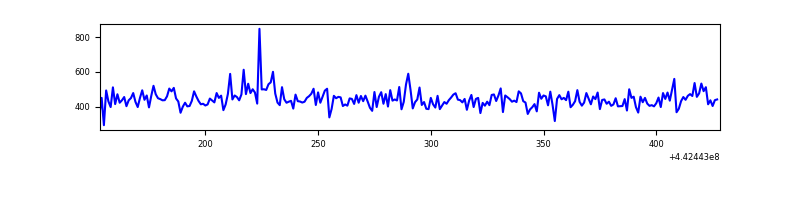 |
| D | 274 | 274 | 73 | 73 | 26.64% | 26.64% | 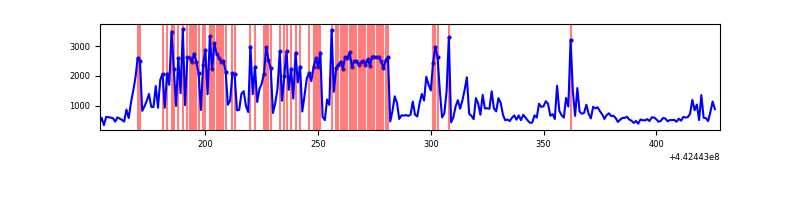 |
Top three noisy pixels from each quadrant. If the there are fewer than three noisy pixels in the level2.evt file, extra rows are filled as -1
| Pixel properties | Quadrant properties | ||||||
|---|---|---|---|---|---|---|---|
| Quadrant | DetID | PixID | Counts | Sigma | Mean | Median | Sigma |
| A | 15 | 223 | 76782 | 9523.36 | 29 | 28 | 8.1 |
| A | 10 | 83 | 69874 | 8666.24 | 29 | 28 | 8.1 |
| A | 13 | 248 | 13622 | 1686.69 | 29 | 28 | 8.1 |
| B | 4 | 171 | 28217 | 3553.14 | 30 | 29 | 7.9 |
| B | 5 | 172 | 2531 | 315.38 | 30 | 29 | 7.9 |
| B | 0 | 190 | 2283 | 284.12 | 30 | 29 | 7.9 |
| C | 3 | 233 | 2373 | 258.2 | 30 | 30 | 9.1 |
| C | 13 | 61 | 203 | 19.07 | 30 | 30 | 9.1 |
| C | 12 | 16 | 153 | 13.55 | 30 | 30 | 9.1 |
| D | 2 | 249 | 141871 | 16385.88 | 26 | 25 | 8.7 |
| D | 1 | 52 | 55473 | 6405.28 | 26 | 25 | 8.7 |
| D | 13 | 249 | 27839 | 3213.04 | 26 | 25 | 8.7 |
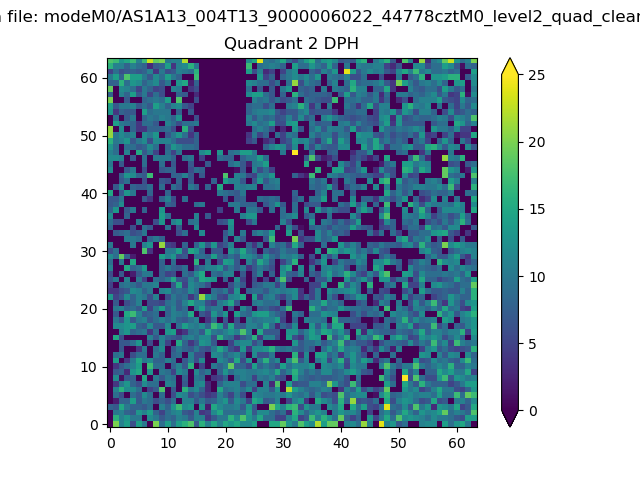
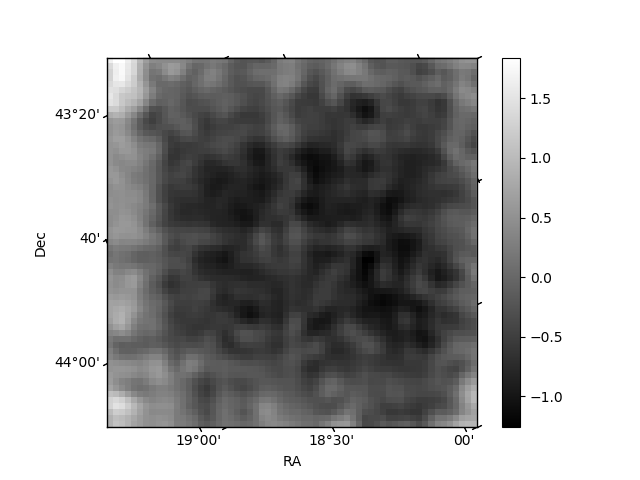
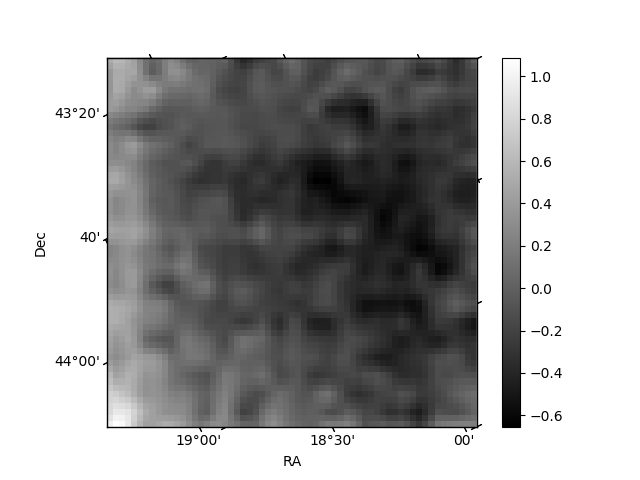
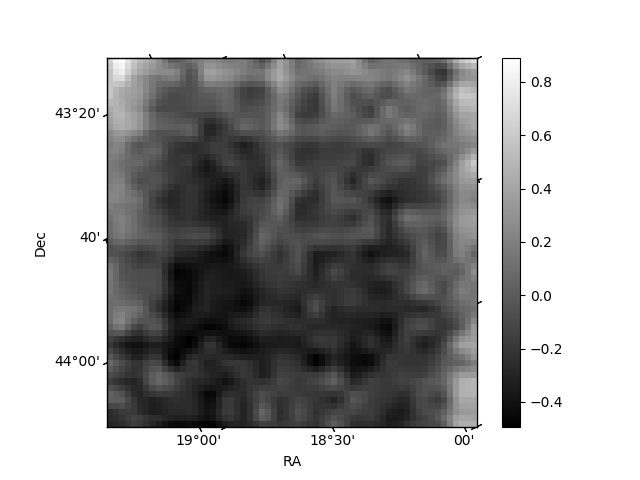
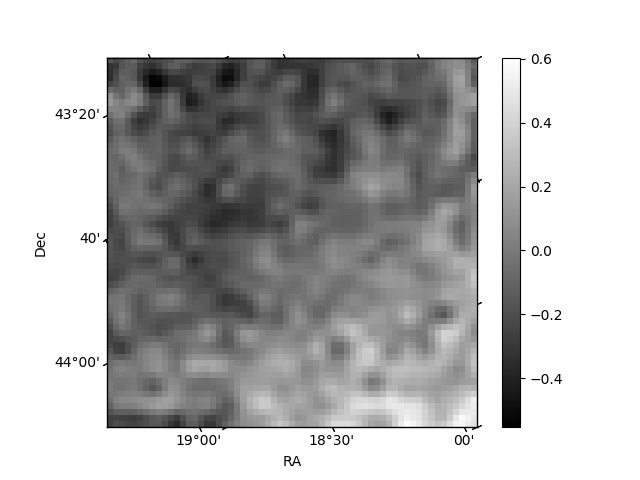
Histogram calculated using DETX and DETY for each event in the final _common_clean file
| Quadrant A | 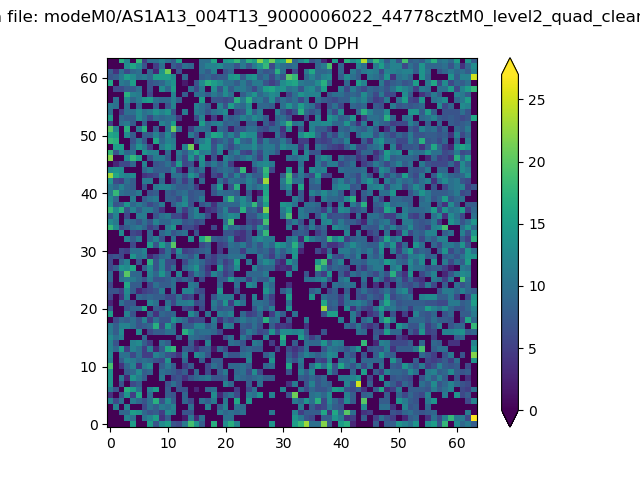 |
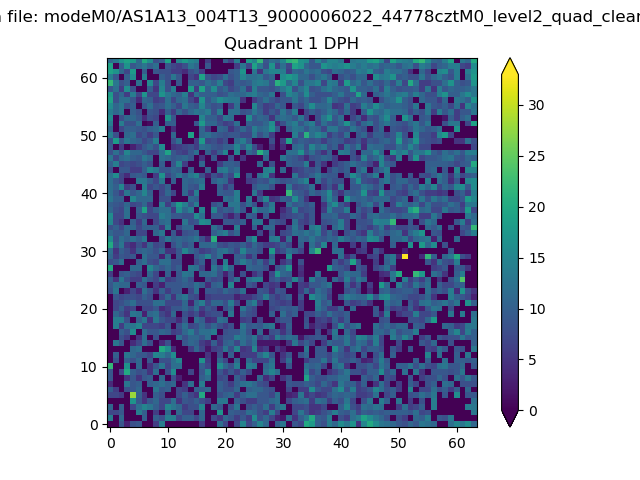 |
Quadrant B |
|---|---|---|---|
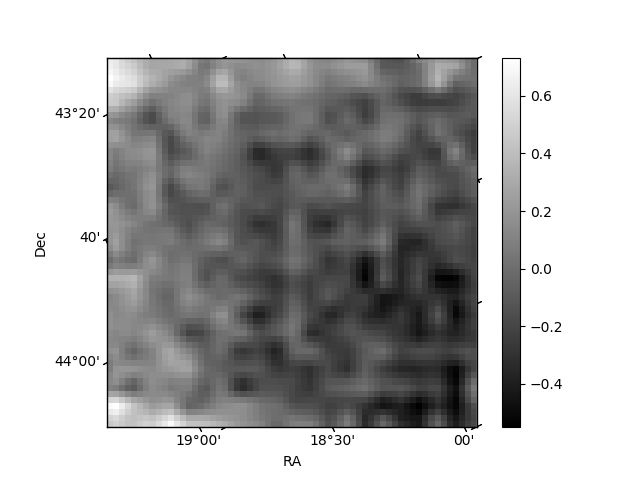
| Quadrant D | 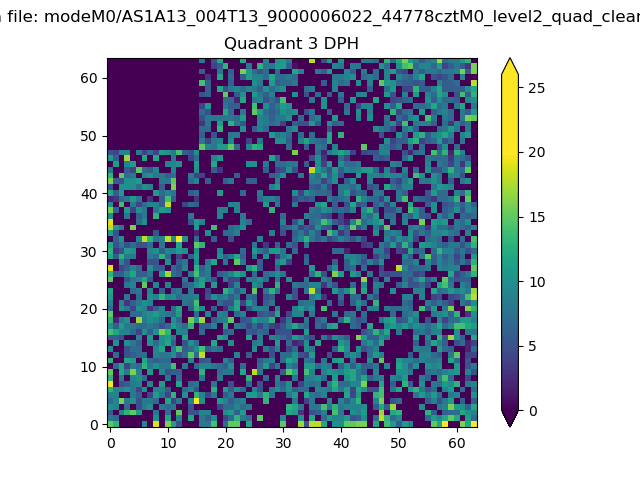 |
 |
Quadrant C |
| Plot type | Count rate plots | Images |
|---|---|---|
| Comparison with Poisson distribution Blue bars denote a histogram of data divided into 1 sec bins. Red curve is a Poisson curve with rate = median count rate of data. |
 |
 |
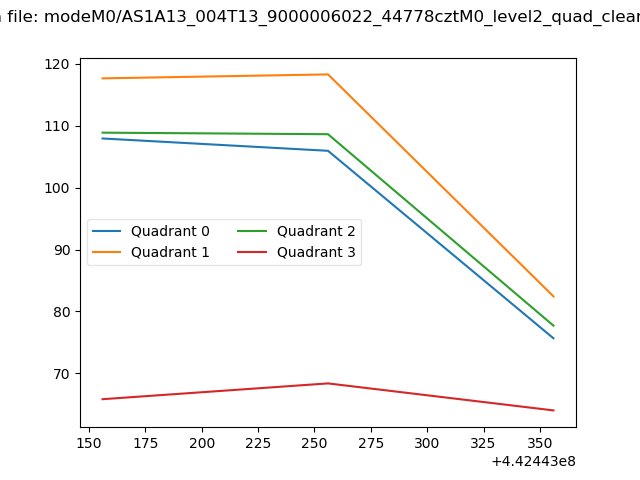
| Quadrant-wise count rates Data is divided into 100 sec bins |
 |
|
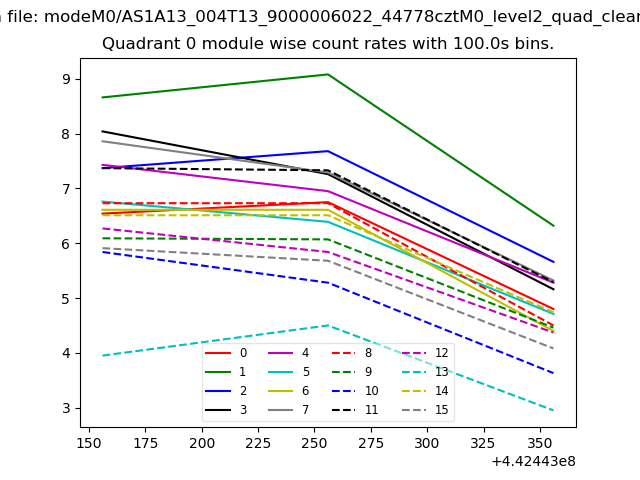
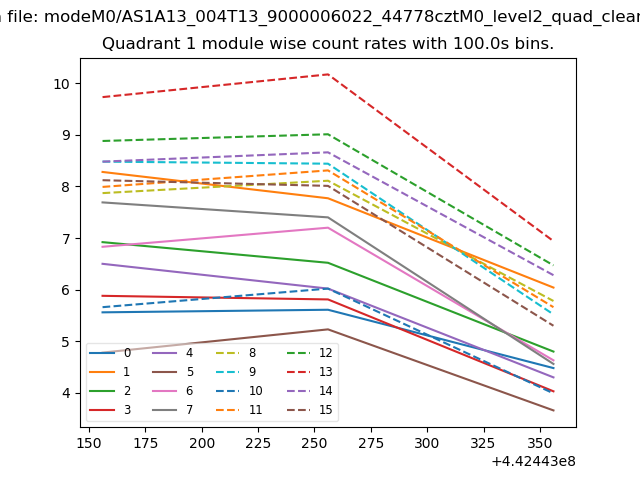
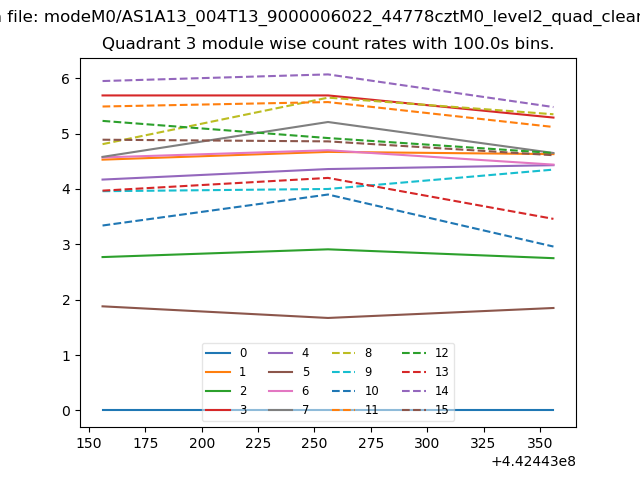
| Module-wise count rates for Quadrant A Data is divided into 100 sec bins |
 |
 |
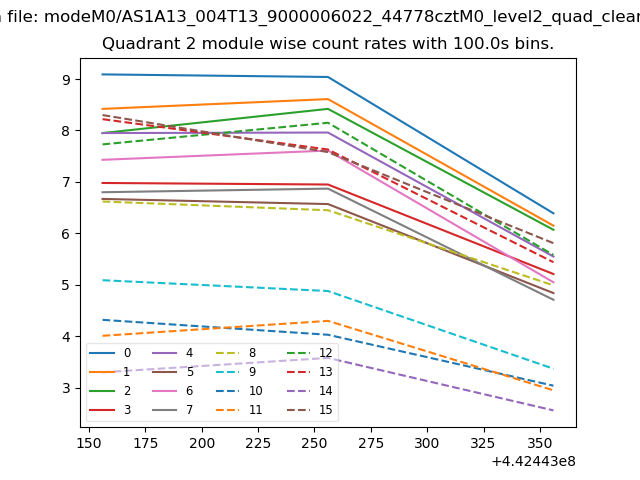
| Module-wise count rates for Quadrant B Data is divided into 100 sec bins |
 |
 |
| Module-wise count rates for Quadrant C Data is divided into 100 sec bins |
 |
 |
| Module-wise count rates for Quadrant D Data is divided into 100 sec bins |
 |
 |
| Parameter | Plot |
|---|---|
| CZT HV Monitor | 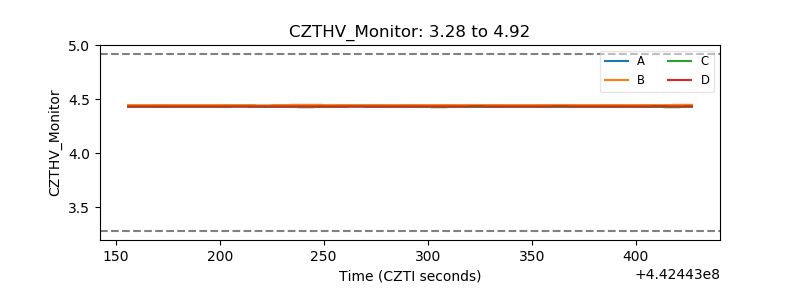 |
| D_VDD | 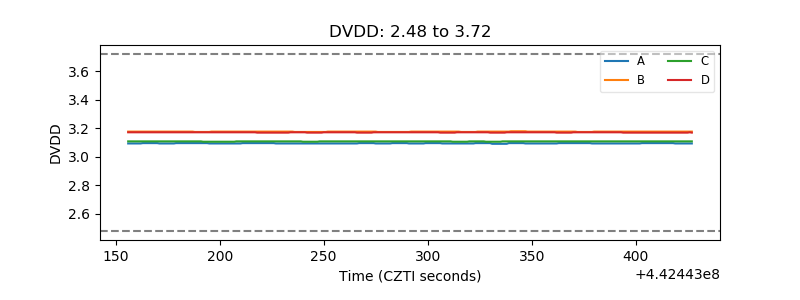 |
| Temperature 1 | 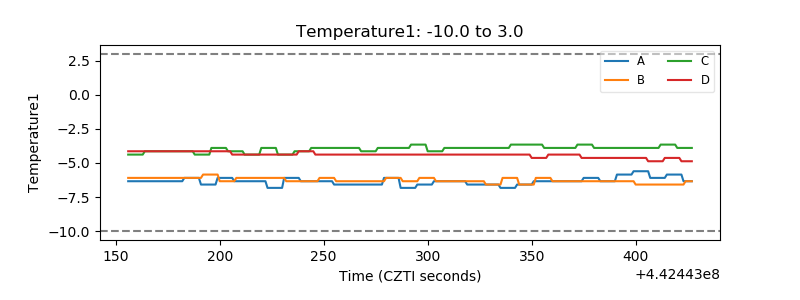 |
| Veto HV Monitor | 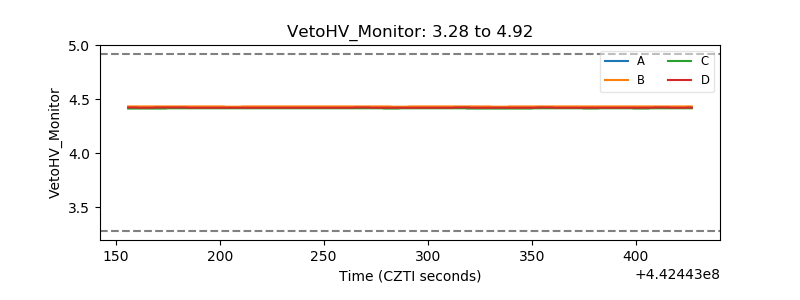 |
| Veto LLD | 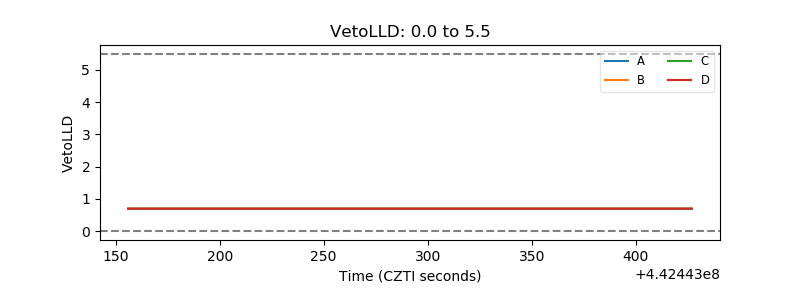 |
| Alpha Counter | 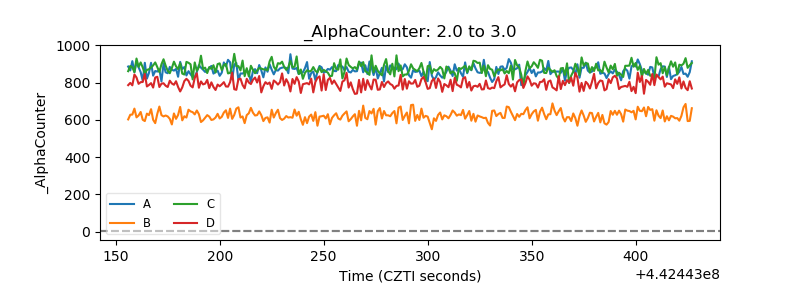 |
| _CPM_Rate | 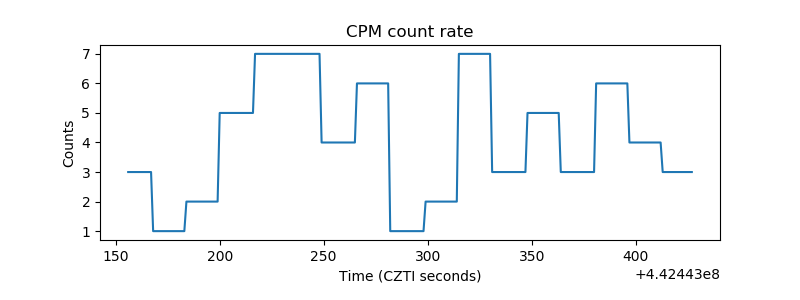 |
| CZT Counter | 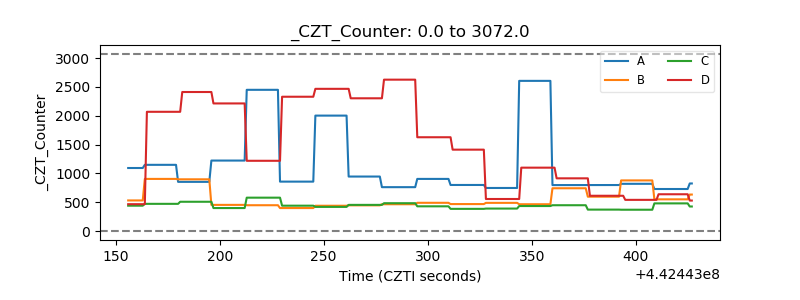 |
| +2.5 Volts monitor | 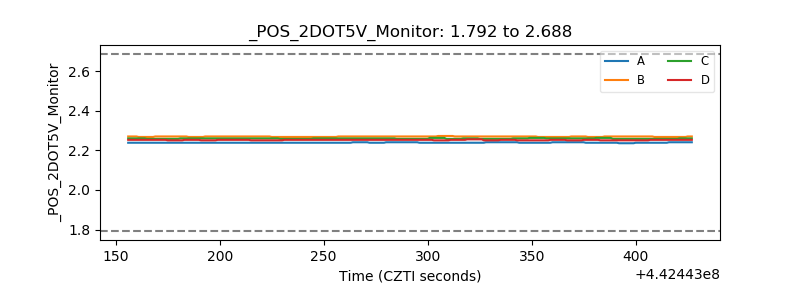 |
| +5 Volts monitor | 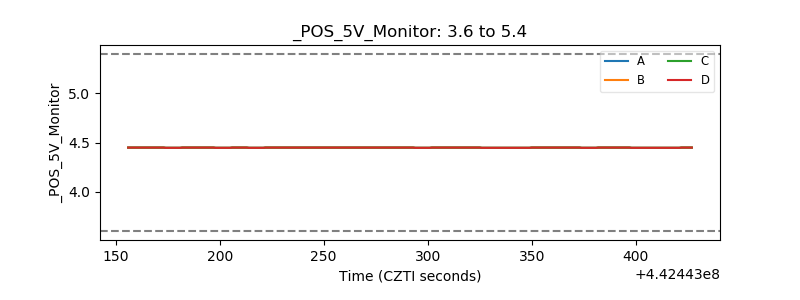 |
| _ROLL_ROT | 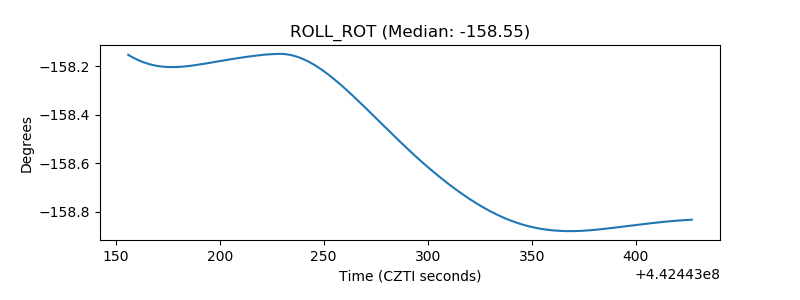 |
| _Roll_DEC | 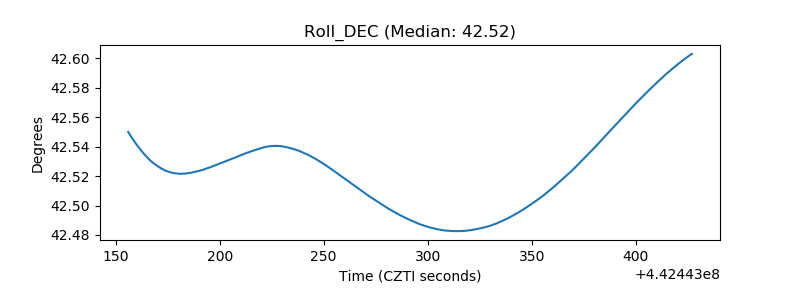 |
| _Roll_RA | 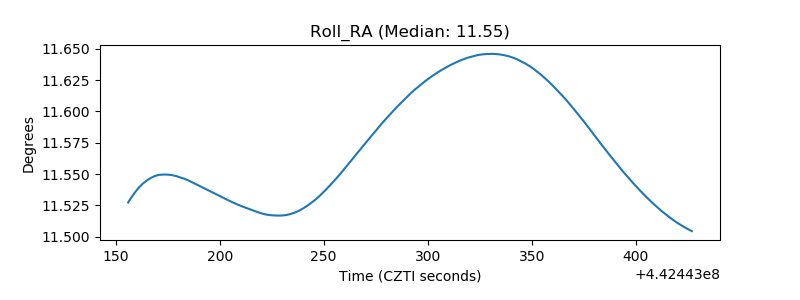 |
| Veto Counter | 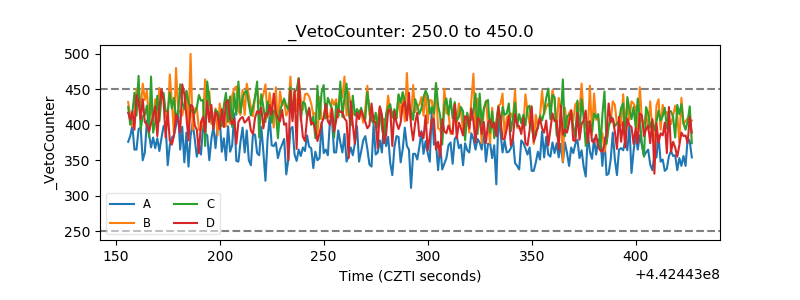 |