| Param | Original file | Final file |
|---|---|---|
| Filename | modeM0/AS1A13_004T13_9000006022_44779cztM0_level2.fits | modeM0/AS1A13_004T13_9000006022_44779cztM0_level2_quad_clean.evt |
| Size (bytes) | 386,801,280 | 87,661,440 |
| Size | 368.9 MB | 83.6 MB |
| Events in quadrant A | 4,779,542 | 568,335 |
| Events in quadrant B | 3,112,291 | 609,900 |
| Events in quadrant C | 2,352,738 | 592,696 |
| Events in quadrant D | 3,665,637 | 515,761 |
| Mode M9 | |||
|---|---|---|---|
| Quadrant | BADHDUFLAG | Total packets | Discarded packets |
| A | 0 | 12 | 0 |
| B | 0 | 12 | 0 |
| C | 0 | 12 | 0 |
| D | 0 | 12 | 0 |
| Mode M0 | |||
|---|---|---|---|
| Quadrant | BADHDUFLAG | Total packets | Discarded packets |
| A | 0 | 18409 | 1 |
| B | 0 | 12750 | 1 |
| C | 0 | 10839 | 1 |
| D | 0 | 14538 | 1 |
| Mode SS | |||
|---|---|---|---|
| Quadrant | BADHDUFLAG | Total packets | Discarded packets |
| A | 0 | 108 | 0 |
| B | 0 | 108 | 0 |
| C | 0 | 108 | 0 |
| D | 0 | 108 | 0 |
| Quadrant | Total seconds | Saturated seconds | Saturation percentage |
|---|---|---|---|
| A | 5246 | 327 | 6.233321% |
| B | 5246 | 105 | 2.001525% |
| C | 5246 | 18 | 0.343119% |
| D | 5246 | 302 | 5.756767% |
Noise dominated data is calculated using 1-second bins in cleaned event files. If a bin has >2000 counts, and if more than 50% of those come from <1% of pixels, then it is considered to be noise-dominated and hence unusable.
| Quadrant | # 1 sec bins | Bins with >0 counts | Bins with >2000 counts | High rate bins dominated by noise | Noise dominated (total time) | Noise dominated (detector-on time) | Marked lightcurve |
|---|---|---|---|---|---|---|---|
| A | 6457 | 5247 | 252 | 252 | 3.90% | 4.80% | 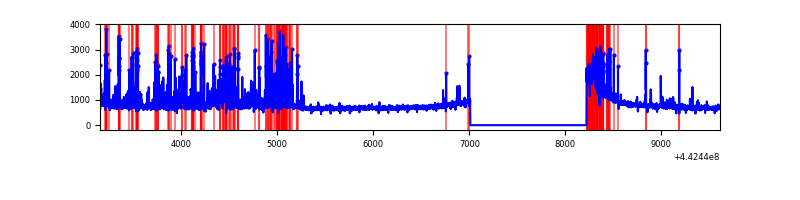 |
| B | 6457 | 5247 | 53 | 53 | 0.82% | 1.01% | 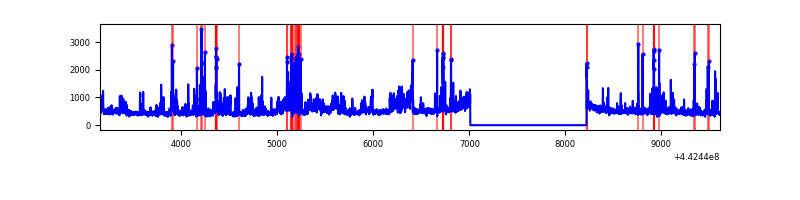 |
| C | 6457 | 5247 | 7 | 7 | 0.11% | 0.13% | 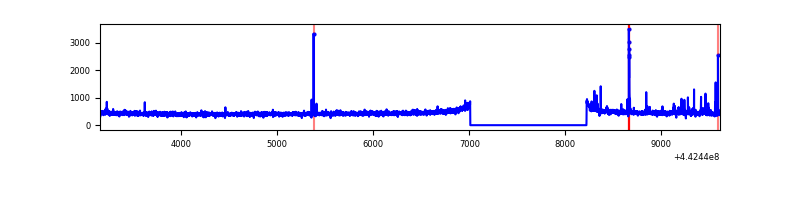 |
| D | 6457 | 5247 | 281 | 281 | 4.35% | 5.36% | 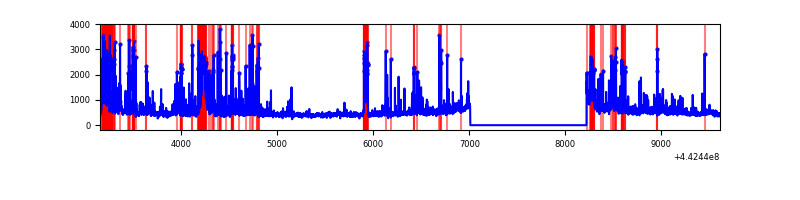 |
Top three noisy pixels from each quadrant. If the there are fewer than three noisy pixels in the level2.evt file, extra rows are filled as -1
| Pixel properties | Quadrant properties | ||||||
|---|---|---|---|---|---|---|---|
| Quadrant | DetID | PixID | Counts | Sigma | Mean | Median | Sigma |
| A | 10 | 83 | 1481224 | 12424.09 | 573 | 562 | 119.2 |
| A | 15 | 223 | 808850 | 6782.27 | 573 | 562 | 119.2 |
| A | 13 | 248 | 226846 | 1898.73 | 573 | 562 | 119.2 |
| B | 0 | 189 | 473059 | 4091.91 | 589 | 572 | 115.5 |
| B | 5 | 255 | 113791 | 980.52 | 589 | 572 | 115.5 |
| B | 0 | 190 | 77994 | 670.5 | 589 | 572 | 115.5 |
| C | 14 | 254 | 44753 | 320.95 | 585 | 588 | 137.6 |
| C | 12 | 2 | 10646 | 73.09 | 585 | 588 | 137.6 |
| C | 3 | 233 | 9260 | 63.02 | 585 | 588 | 137.6 |
| D | 2 | 249 | 399680 | 2795.09 | 567 | 549 | 142.8 |
| D | 1 | 52 | 391162 | 2735.44 | 567 | 549 | 142.8 |
| D | 1 | 47 | 135594 | 945.71 | 567 | 549 | 142.8 |
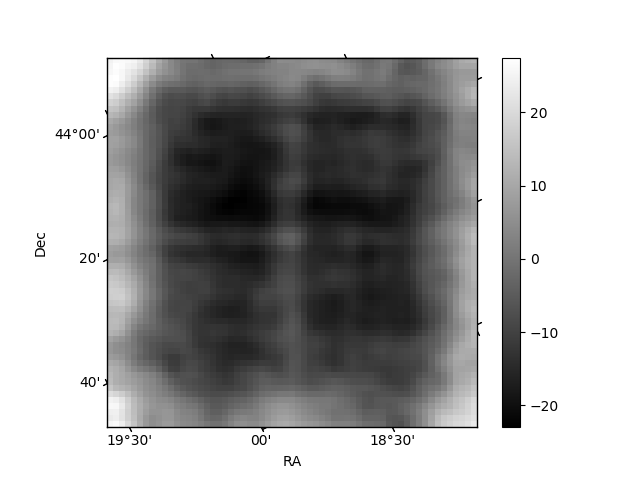
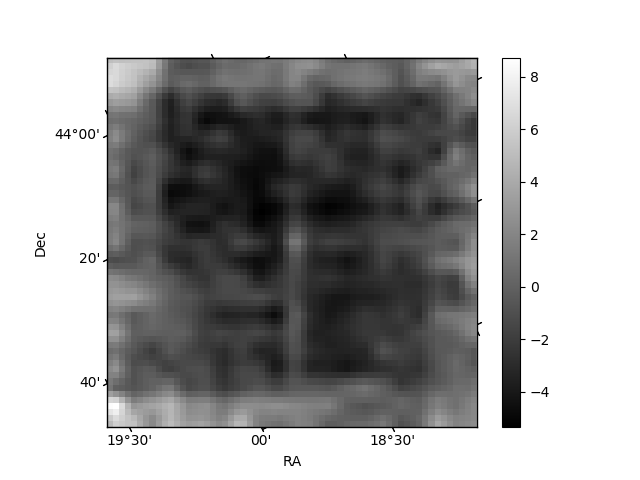
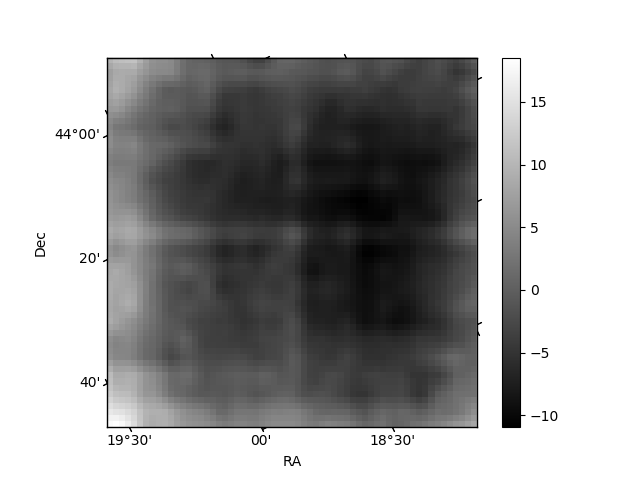
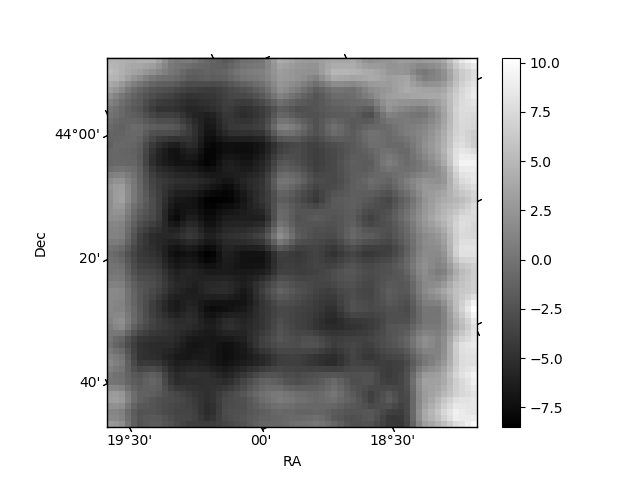
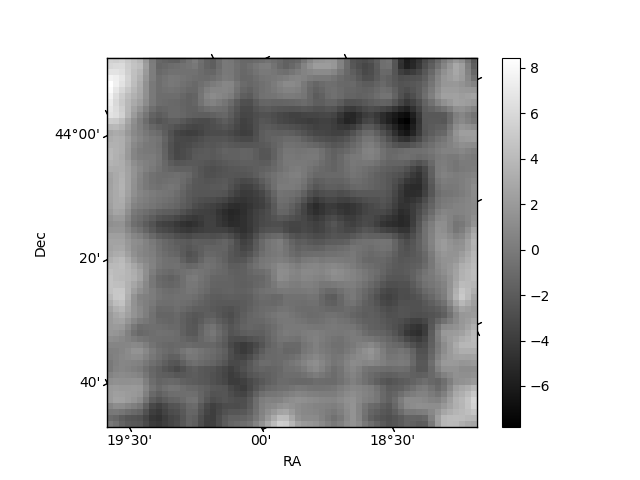
Histogram calculated using DETX and DETY for each event in the final _common_clean file
| Quadrant A | 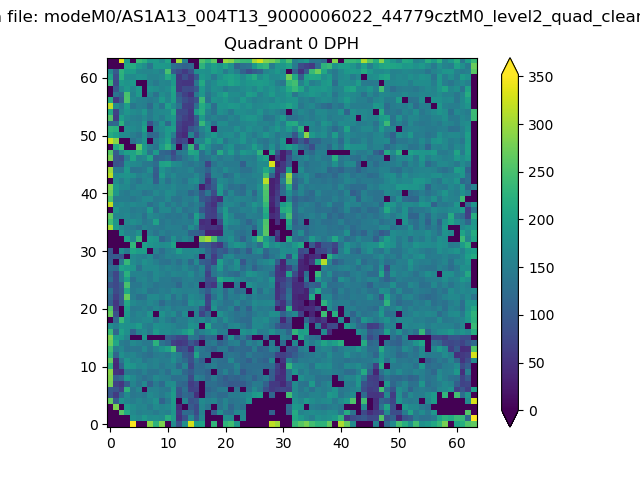 |
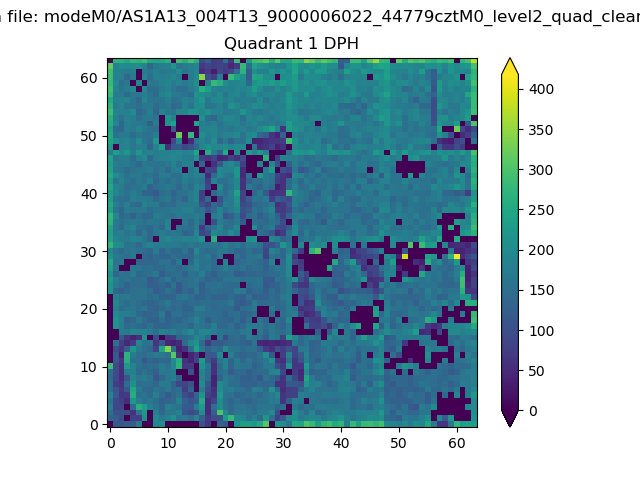 |
Quadrant B |
|---|---|---|---|
| Quadrant D | 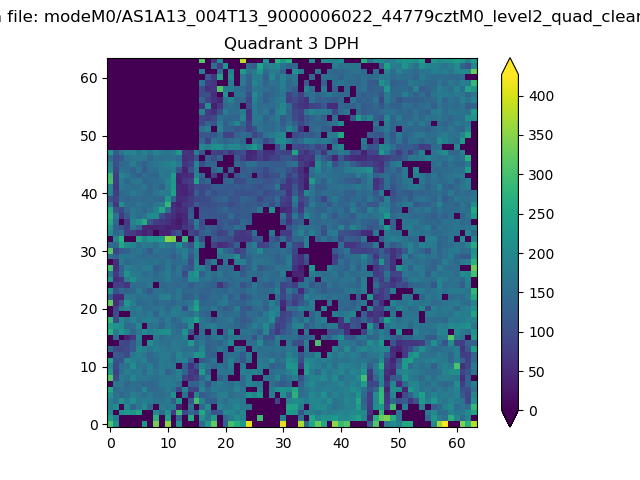 |
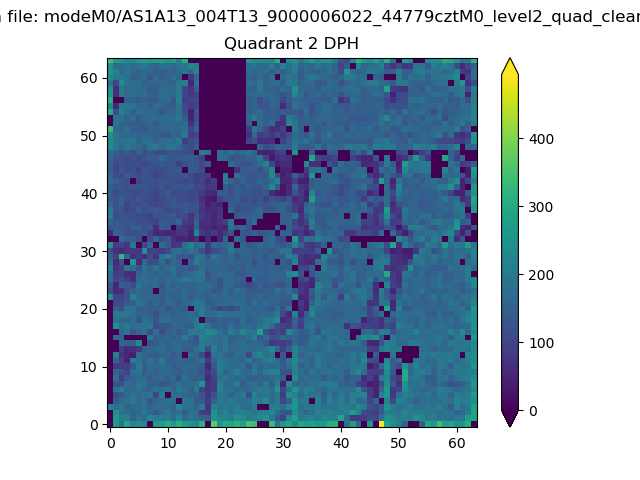 |
Quadrant C |
| Plot type | Count rate plots | Images |
|---|---|---|
| Comparison with Poisson distribution Blue bars denote a histogram of data divided into 1 sec bins. Red curve is a Poisson curve with rate = median count rate of data. |
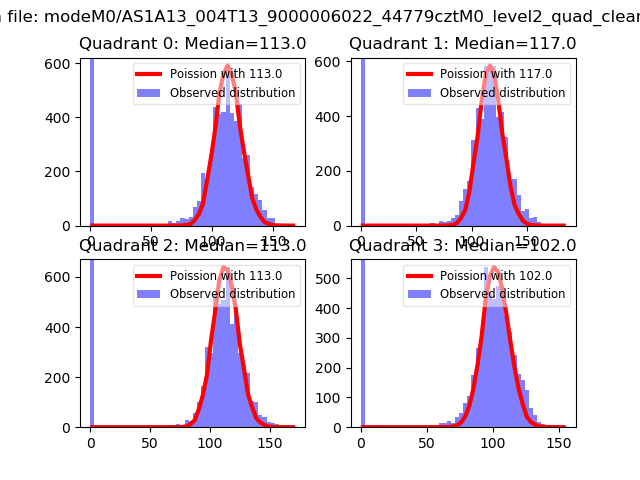 |
 |
| Quadrant-wise count rates Data is divided into 100 sec bins |
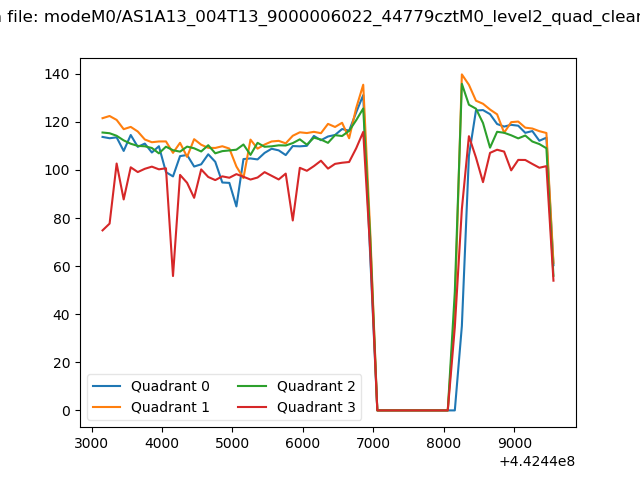 |
|
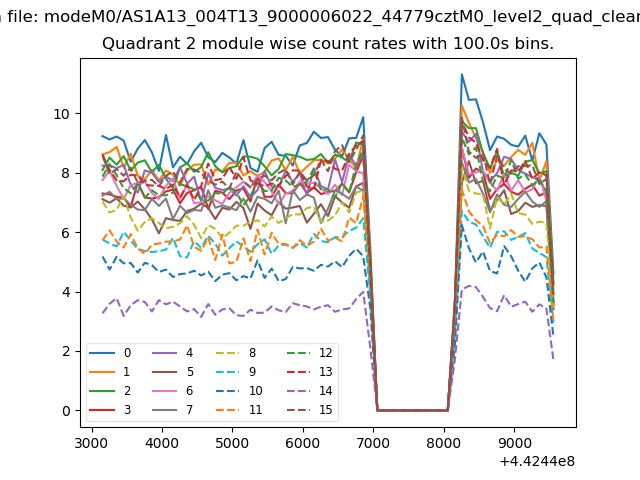
| Module-wise count rates for Quadrant A Data is divided into 100 sec bins |
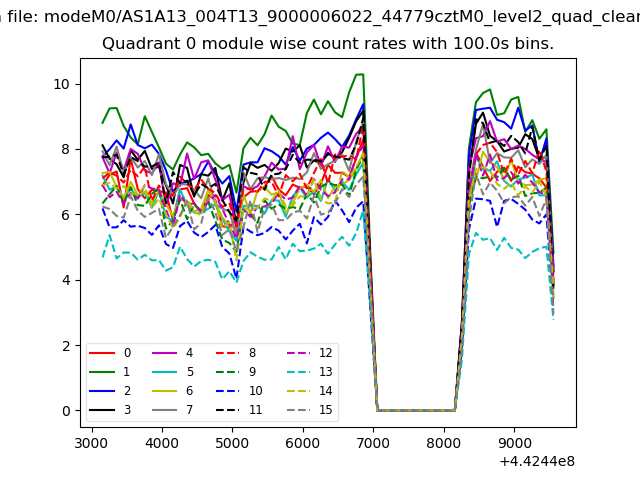 |
 |
| Module-wise count rates for Quadrant B Data is divided into 100 sec bins |
 |
 |
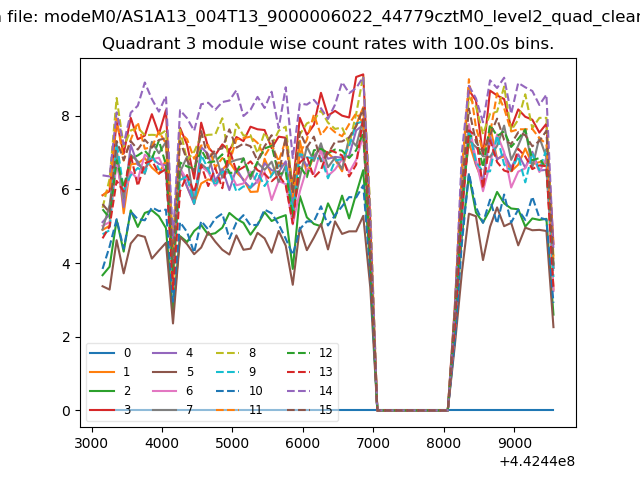
| Module-wise count rates for Quadrant C Data is divided into 100 sec bins |
 |
 |
| Module-wise count rates for Quadrant D Data is divided into 100 sec bins |
 |
 |
| Parameter | Plot |
|---|---|
| CZT HV Monitor | 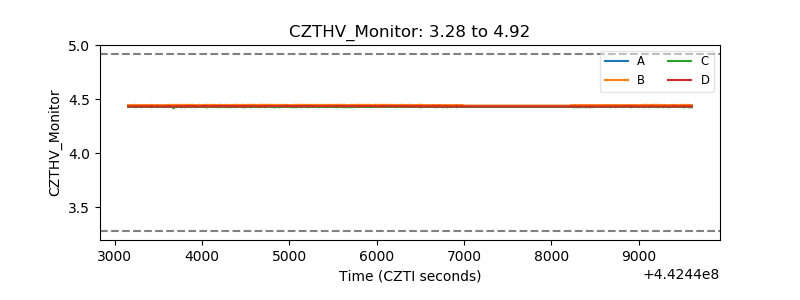 |
| D_VDD | 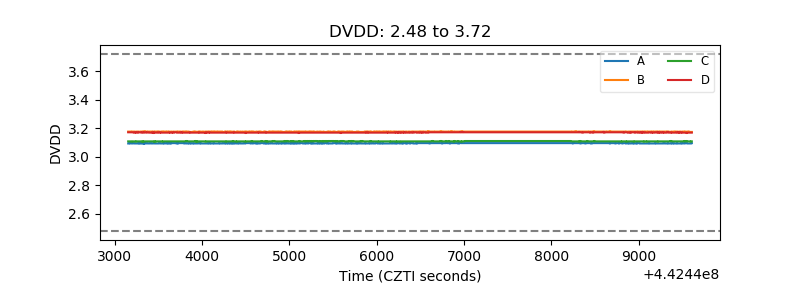 |
| Temperature 1 | 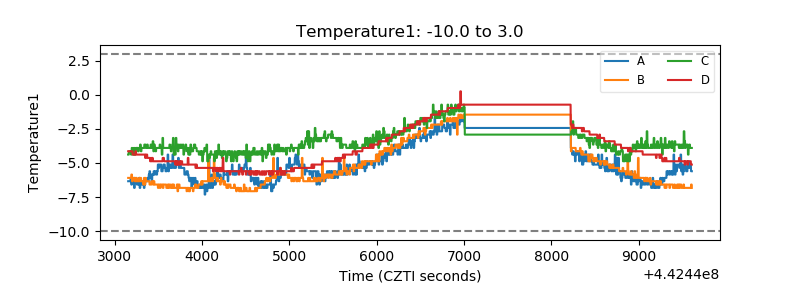 |
| Veto HV Monitor | 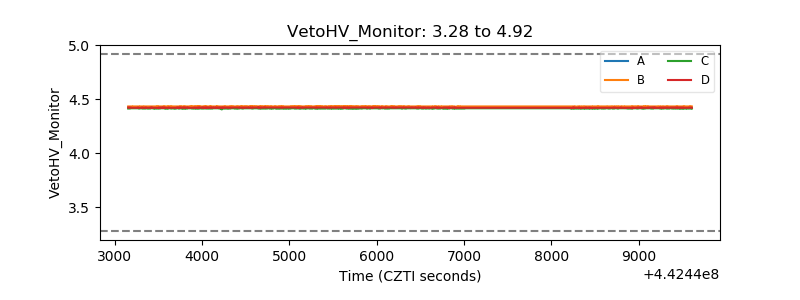 |
| Veto LLD | 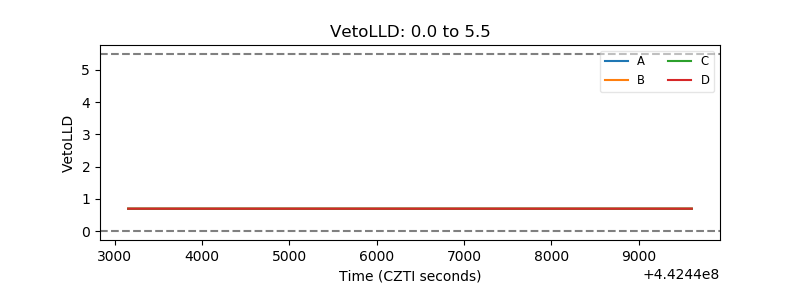 |
| Alpha Counter | 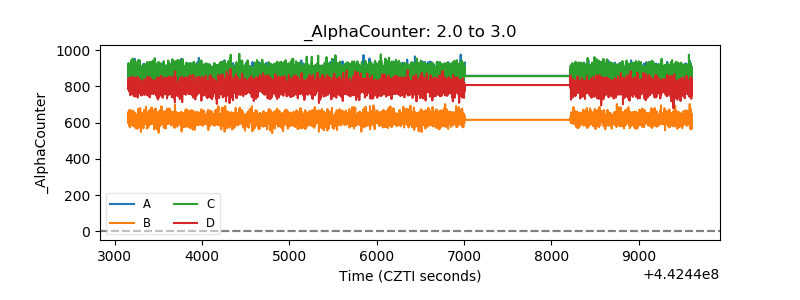 |
| _CPM_Rate | 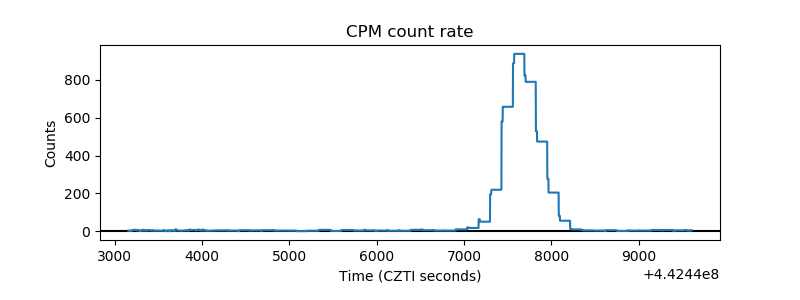 |
| CZT Counter | 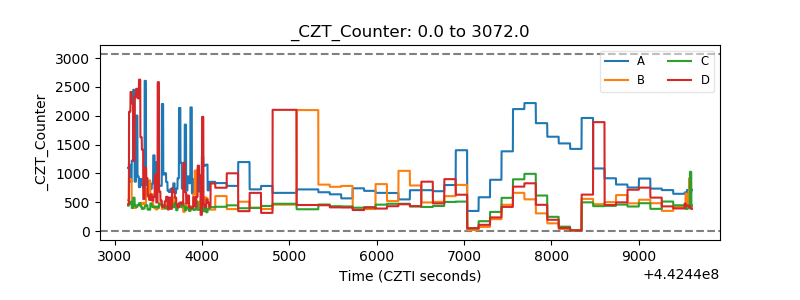 |
| +2.5 Volts monitor | 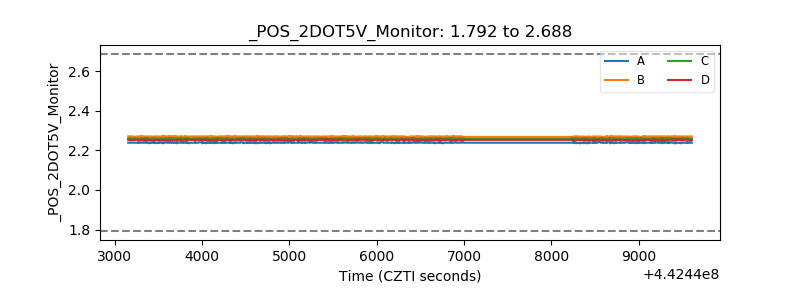 |
| +5 Volts monitor | 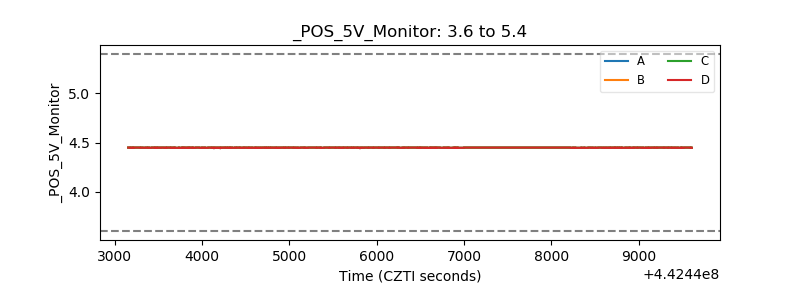 |
| _ROLL_ROT | 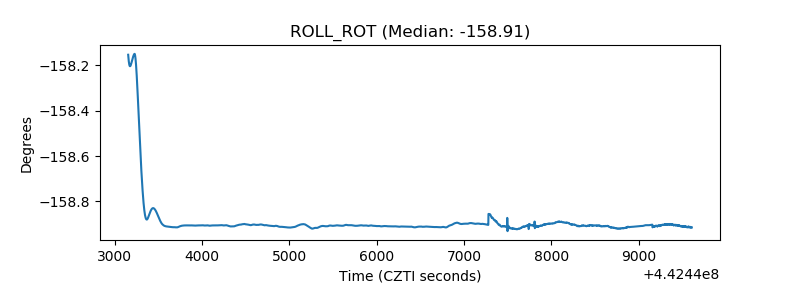 |
| _Roll_DEC | 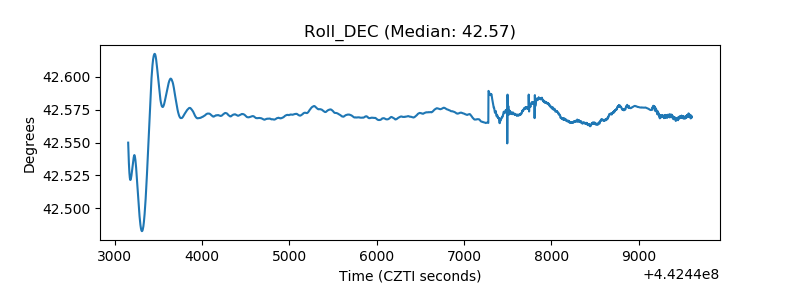 |
| _Roll_RA | 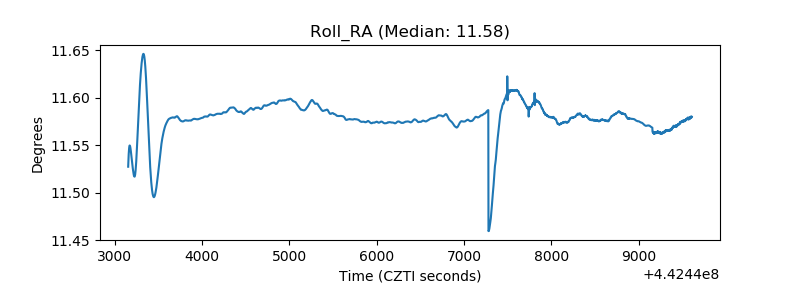 |
| Veto Counter | 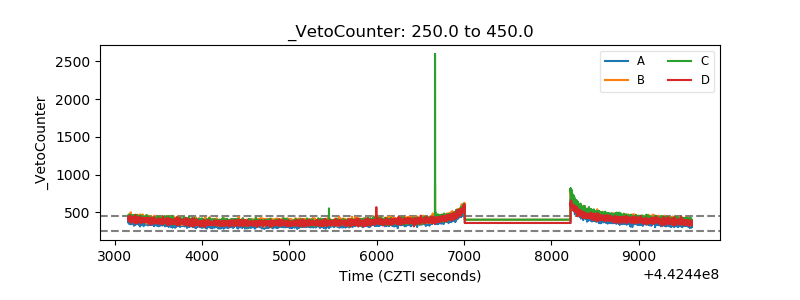 |