| Param | Original file | Final file |
|---|---|---|
| Filename | modeM0/AS1A13_004T13_9000006022_44781cztM0_level2.fits | modeM0/AS1A13_004T13_9000006022_44781cztM0_level2_quad_clean.evt |
| Size (bytes) | 502,603,200 | 112,452,480 |
| Size | 479.3 MB | 107.2 MB |
| Events in quadrant A | 5,375,830 | 745,025 |
| Events in quadrant B | 3,666,352 | 776,779 |
| Events in quadrant C | 3,582,323 | 736,672 |
| Events in quadrant D | 5,431,530 | 654,273 |
| Mode M9 | |||
|---|---|---|---|
| Quadrant | BADHDUFLAG | Total packets | Discarded packets |
| A | 0 | 7 | 0 |
| B | 0 | 7 | 0 |
| C | 0 | 7 | 0 |
| D | 0 | 7 | 0 |
| Mode M0 | |||
|---|---|---|---|
| Quadrant | BADHDUFLAG | Total packets | Discarded packets |
| A | 0 | 22002 | 1 |
| B | 0 | 15877 | 1 |
| C | 0 | 15936 | 1 |
| D | 0 | 21051 | 1 |
| Mode SS | |||
|---|---|---|---|
| Quadrant | BADHDUFLAG | Total packets | Discarded packets |
| A | 0 | 144 | 0 |
| B | 0 | 144 | 0 |
| C | 0 | 144 | 0 |
| D | 0 | 144 | 0 |
| Quadrant | Total seconds | Saturated seconds | Saturation percentage |
|---|---|---|---|
| A | 7066 | 219 | 3.099349% |
| B | 7066 | 149 | 2.108689% |
| C | 7066 | 213 | 3.014435% |
| D | 7066 | 515 | 7.288423% |
Noise dominated data is calculated using 1-second bins in cleaned event files. If a bin has >2000 counts, and if more than 50% of those come from <1% of pixels, then it is considered to be noise-dominated and hence unusable.
| Quadrant | # 1 sec bins | Bins with >0 counts | Bins with >2000 counts | High rate bins dominated by noise | Noise dominated (total time) | Noise dominated (detector-on time) | Marked lightcurve |
|---|---|---|---|---|---|---|---|
| A | 7786 | 7066 | 11 | 11 | 0.14% | 0.16% | 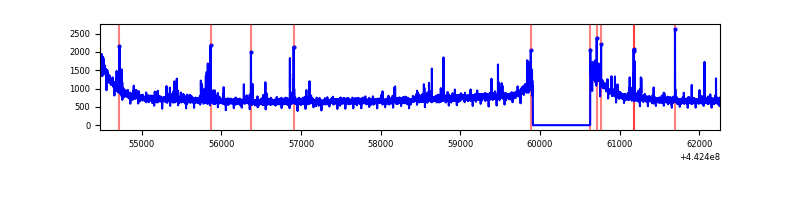 |
| B | 7786 | 7066 | 25 | 25 | 0.32% | 0.35% | 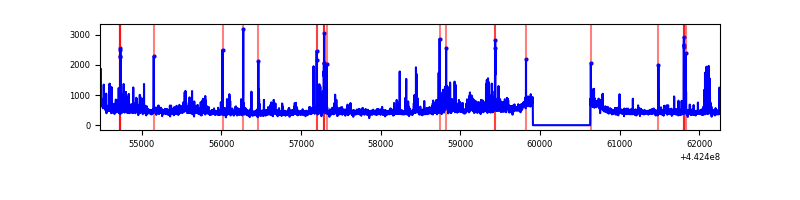 |
| C | 7786 | 7067 | 162 | 162 | 2.08% | 2.29% | 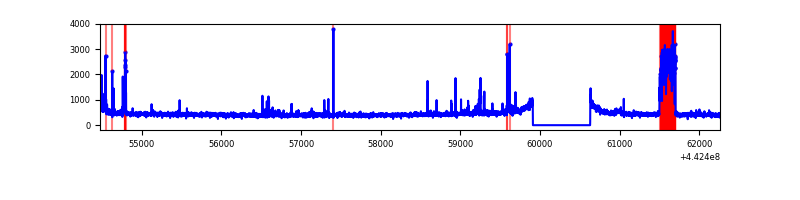 |
| D | 7786 | 7066 | 437 | 437 | 5.61% | 6.18% |  |
Top three noisy pixels from each quadrant. If the there are fewer than three noisy pixels in the level2.evt file, extra rows are filled as -1
| Pixel properties | Quadrant properties | ||||||
|---|---|---|---|---|---|---|---|
| Quadrant | DetID | PixID | Counts | Sigma | Mean | Median | Sigma |
| A | 10 | 83 | 2179919 | 13432.13 | 783 | 764 | 162.2 |
| A | 13 | 248 | 59144 | 359.85 | 783 | 764 | 162.2 |
| A | 7 | 3 | 46668 | 282.95 | 783 | 764 | 162.2 |
| B | 0 | 155 | 182578 | 1167.66 | 790 | 764 | 155.7 |
| B | 5 | 255 | 127907 | 816.55 | 790 | 764 | 155.7 |
| B | 4 | 171 | 64230 | 407.6 | 790 | 764 | 155.7 |
| C | 12 | 2 | 481166 | 2629.99 | 777 | 780 | 182.7 |
| C | 14 | 254 | 42766 | 229.86 | 777 | 780 | 182.7 |
| C | 5 | 128 | 9763 | 49.18 | 777 | 780 | 182.7 |
| D | 5 | 222 | 1143373 | 6036.34 | 749 | 727 | 189.3 |
| D | 13 | 249 | 304509 | 1604.81 | 749 | 727 | 189.3 |
| D | 2 | 249 | 255316 | 1344.94 | 749 | 727 | 189.3 |
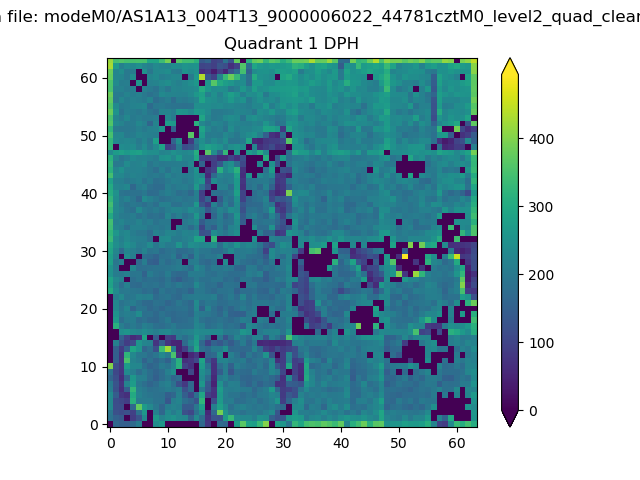
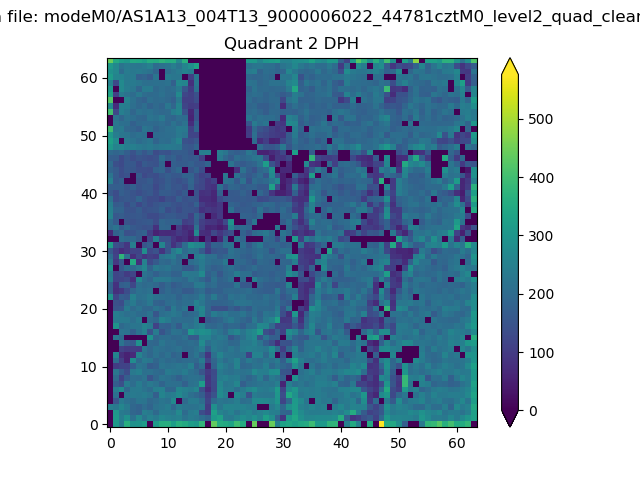
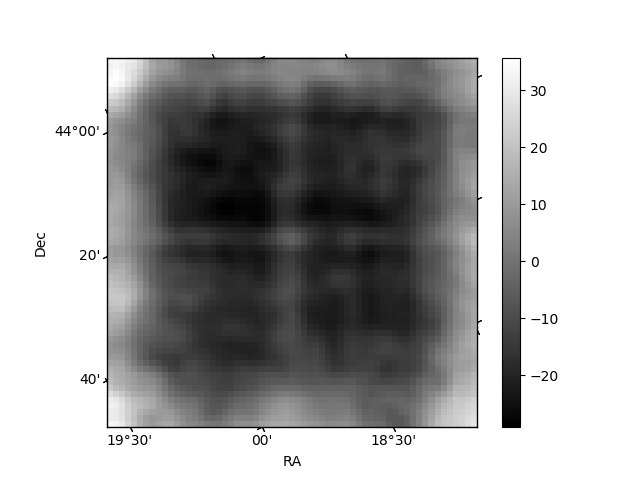
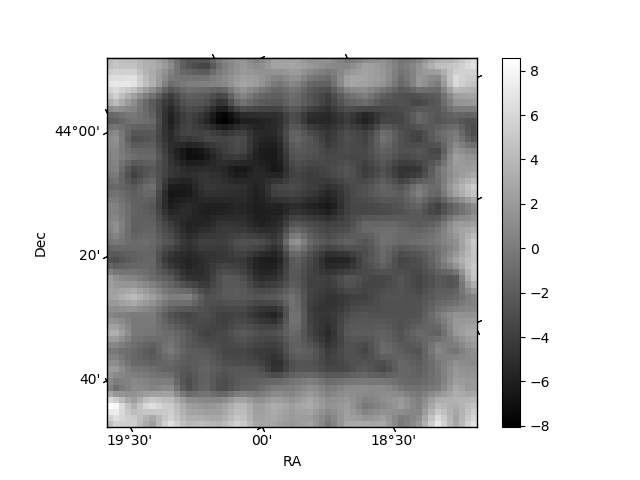
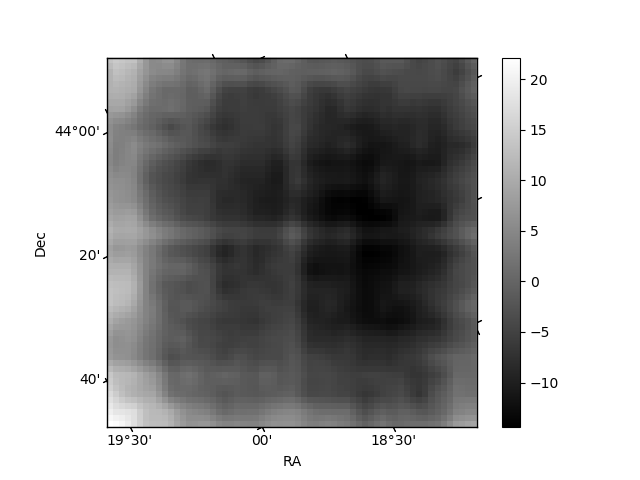
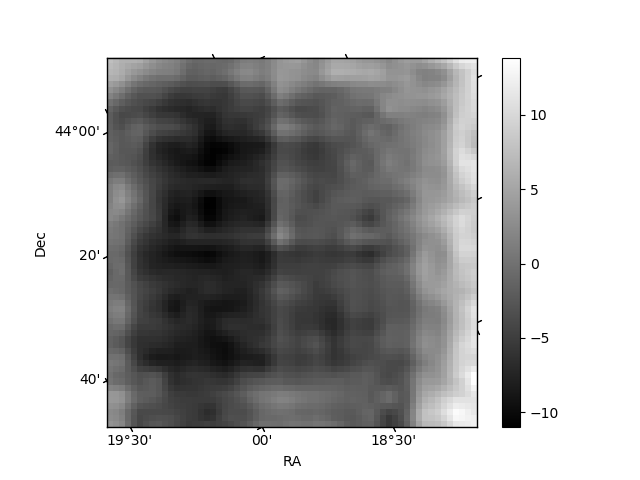
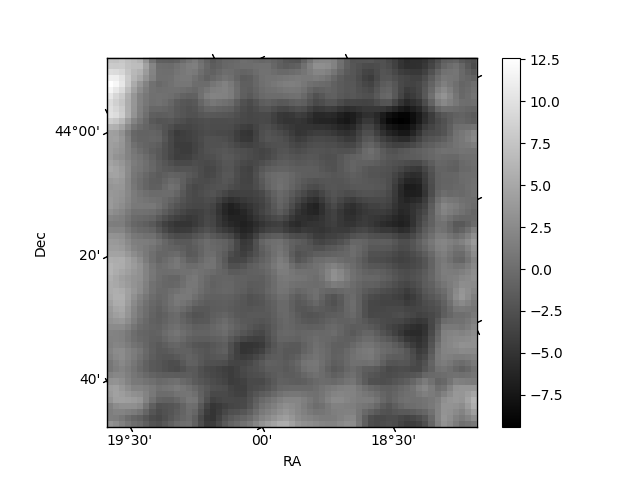
Histogram calculated using DETX and DETY for each event in the final _common_clean file
| Quadrant A | 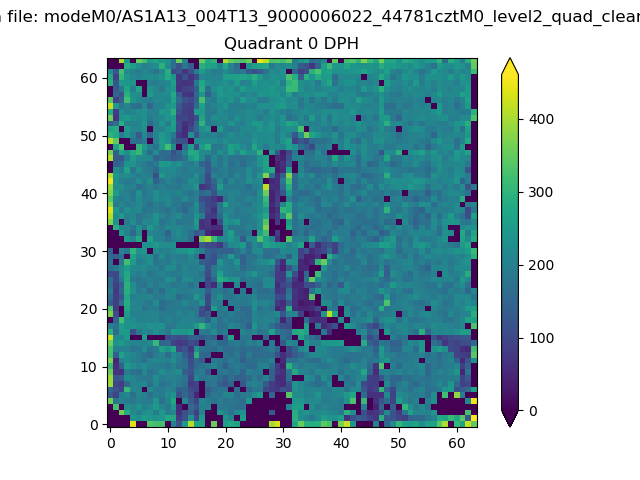 |
 |
Quadrant B |
|---|---|---|---|
| Quadrant D | 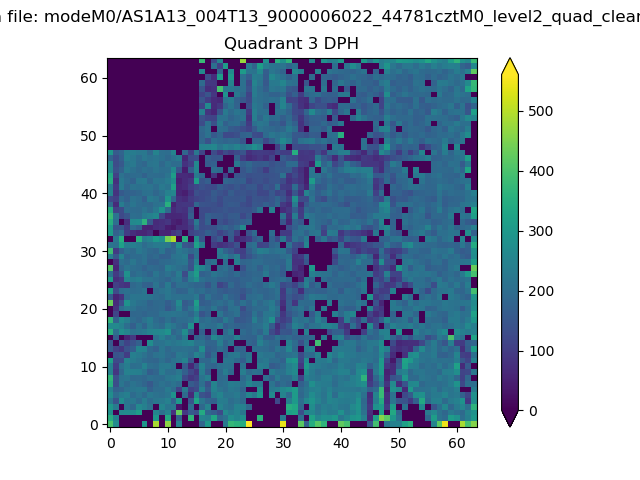 |
 |
Quadrant C |
| Plot type | Count rate plots | Images |
|---|---|---|
| Comparison with Poisson distribution Blue bars denote a histogram of data divided into 1 sec bins. Red curve is a Poisson curve with rate = median count rate of data. |
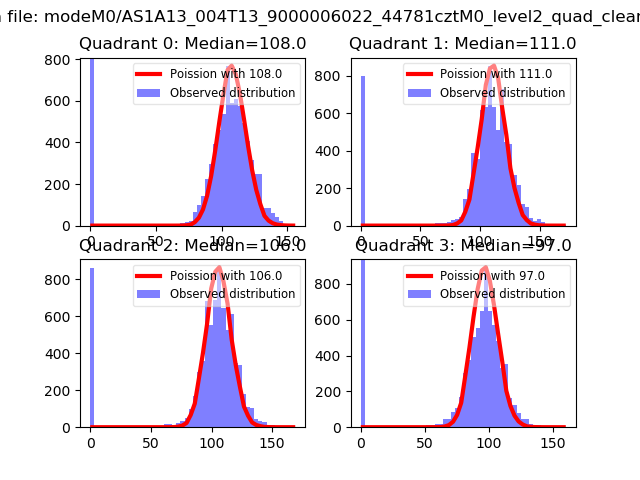 |
 |
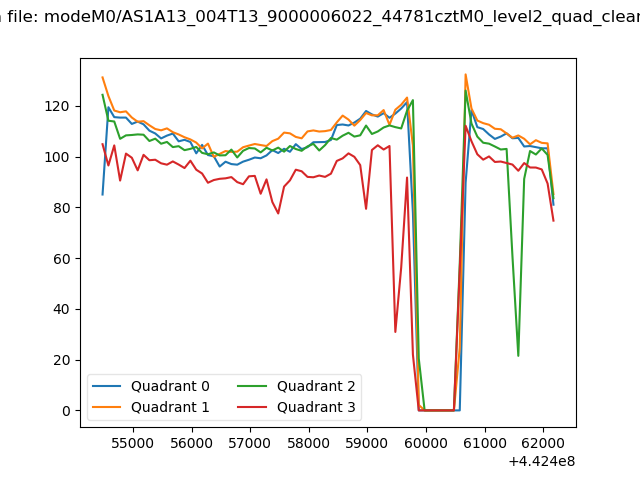
| Quadrant-wise count rates Data is divided into 100 sec bins |
 |
|
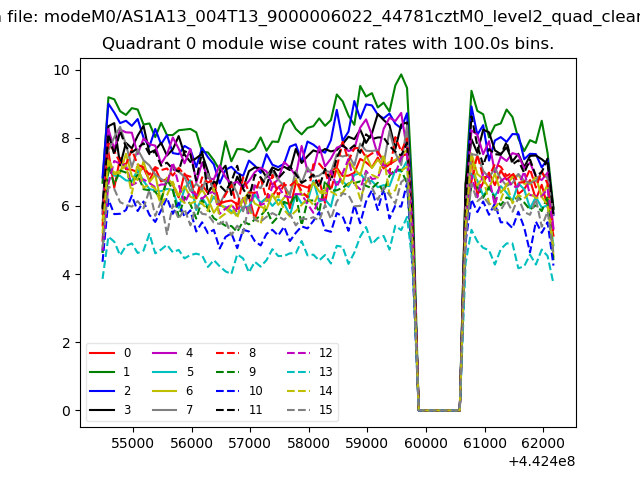
| Module-wise count rates for Quadrant A Data is divided into 100 sec bins |
 |
 |
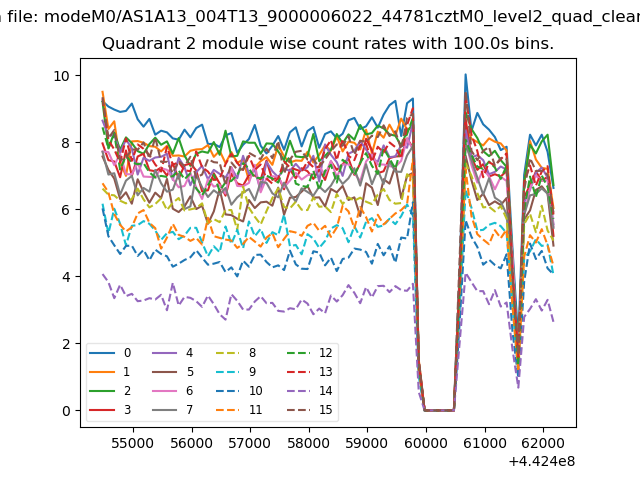
| Module-wise count rates for Quadrant B Data is divided into 100 sec bins |
 |
 |
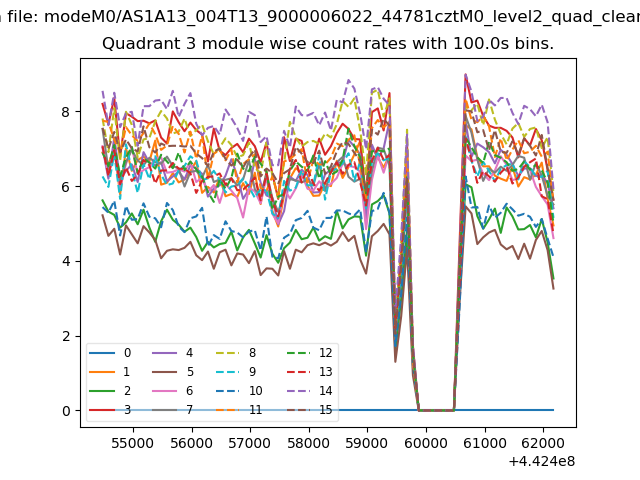
| Module-wise count rates for Quadrant C Data is divided into 100 sec bins |
 |
 |
| Module-wise count rates for Quadrant D Data is divided into 100 sec bins |
 |
 |
| Parameter | Plot |
|---|---|
| CZT HV Monitor |  |
| D_VDD | 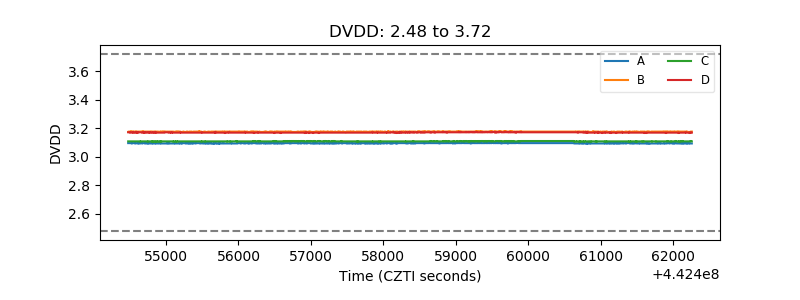 |
| Temperature 1 | 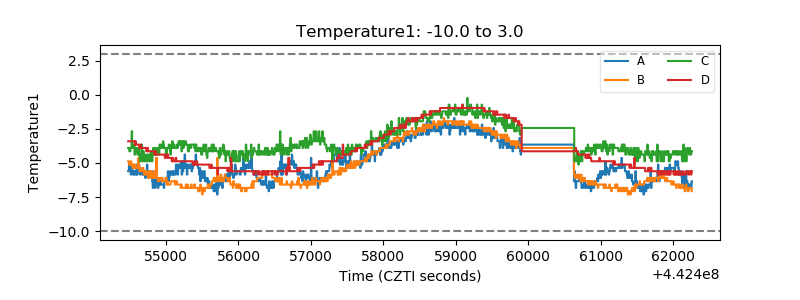 |
| Veto HV Monitor | 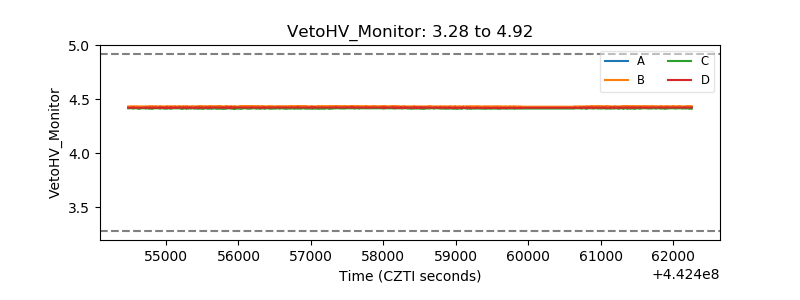 |
| Veto LLD | 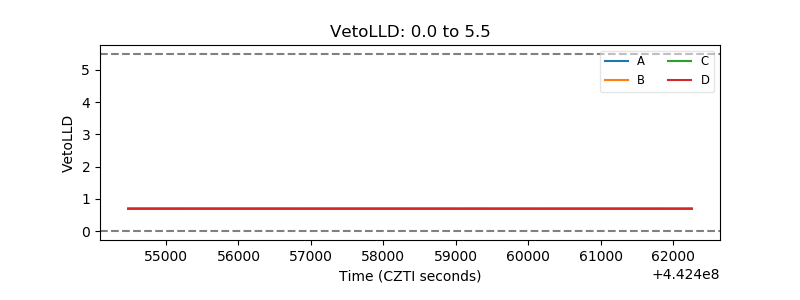 |
| Alpha Counter | 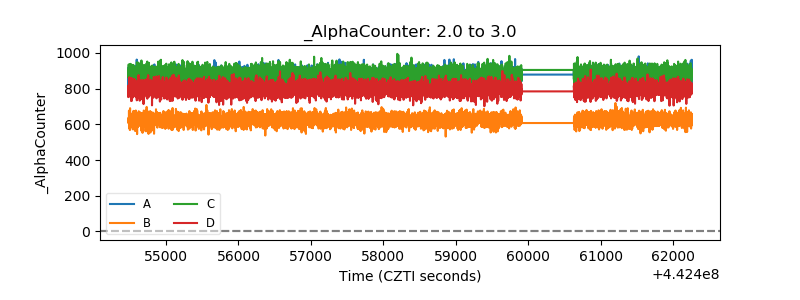 |
| _CPM_Rate | 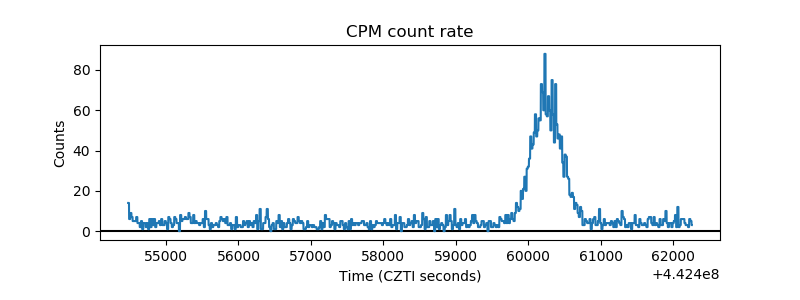 |
| CZT Counter | 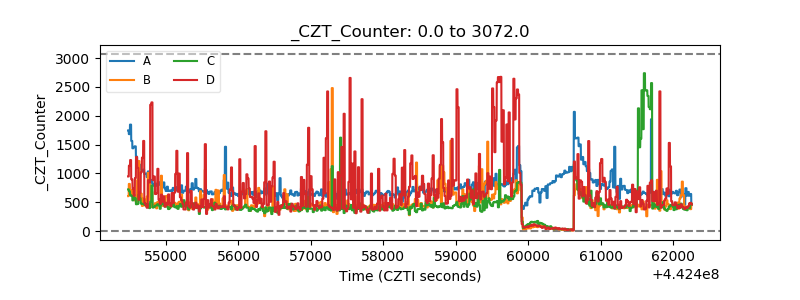 |
| +2.5 Volts monitor | 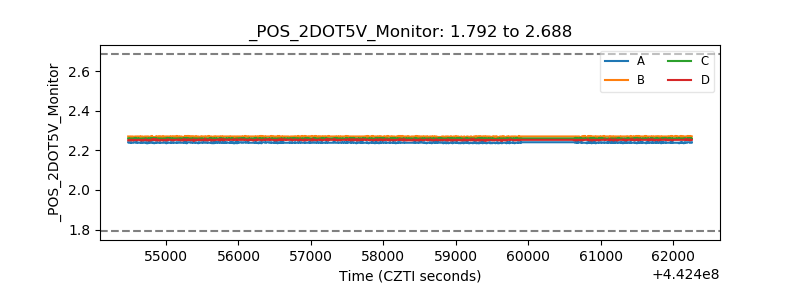 |
| +5 Volts monitor | 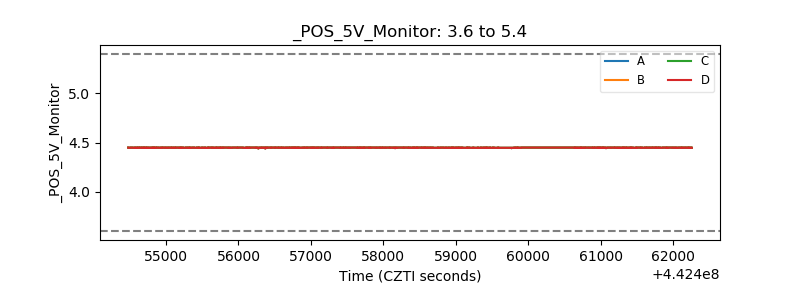 |
| _ROLL_ROT | 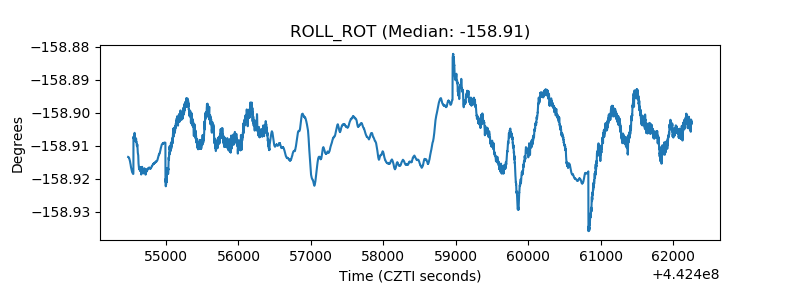 |
| _Roll_DEC | 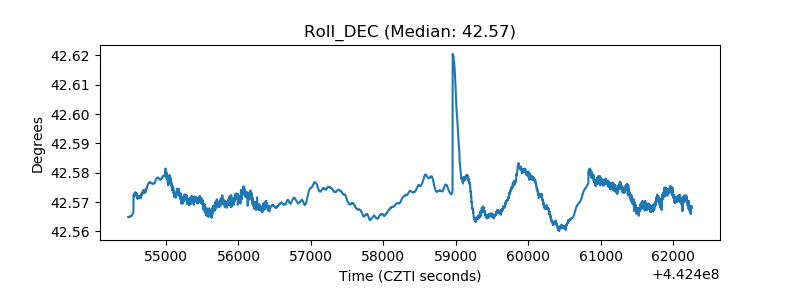 |
| _Roll_RA | 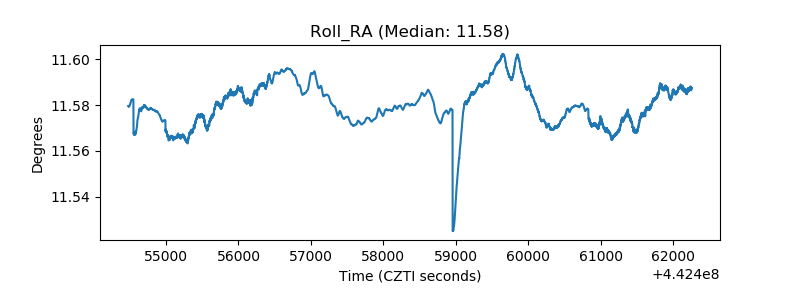 |
| Veto Counter | 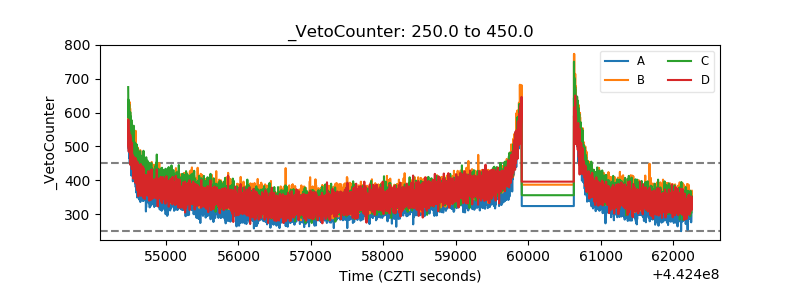 |