| Param | Original file | Final file |
|---|---|---|
| Filename | modeM0/AS1A13_004T13_9000006022_44782cztM0_level2.fits | modeM0/AS1A13_004T13_9000006022_44782cztM0_level2_quad_clean.evt |
| Size (bytes) | 609,419,520 | 126,910,080 |
| Size | 581.2 MB | 121.0 MB |
| Events in quadrant A | 6,775,069 | 804,155 |
| Events in quadrant B | 4,186,796 | 871,147 |
| Events in quadrant C | 4,281,130 | 860,468 |
| Events in quadrant D | 6,674,225 | 732,891 |
| Mode M9 | |||
|---|---|---|---|
| Quadrant | BADHDUFLAG | Total packets | Discarded packets |
| A | 0 | 9 | 0 |
| B | 0 | 9 | 0 |
| C | 0 | 9 | 0 |
| D | 0 | 9 | 0 |
| Mode M0 | |||
|---|---|---|---|
| Quadrant | BADHDUFLAG | Total packets | Discarded packets |
| A | 0 | 27120 | 2 |
| B | 0 | 18320 | 2 |
| C | 0 | 18727 | 2 |
| D | 0 | 25569 | 2 |
| Mode SS | |||
|---|---|---|---|
| Quadrant | BADHDUFLAG | Total packets | Discarded packets |
| A | 0 | 168 | 0 |
| B | 0 | 168 | 0 |
| C | 0 | 168 | 0 |
| D | 0 | 168 | 0 |
| Quadrant | Total seconds | Saturated seconds | Saturation percentage |
|---|---|---|---|
| A | 8262 | 766 | 9.271363% |
| B | 8263 | 427 | 5.167615% |
| C | 8263 | 311 | 3.763766% |
| D | 8263 | 842 | 10.190004% |
Noise dominated data is calculated using 1-second bins in cleaned event files. If a bin has >2000 counts, and if more than 50% of those come from <1% of pixels, then it is considered to be noise-dominated and hence unusable.
| Quadrant | # 1 sec bins | Bins with >0 counts | Bins with >2000 counts | High rate bins dominated by noise | Noise dominated (total time) | Noise dominated (detector-on time) | Marked lightcurve |
|---|---|---|---|---|---|---|---|
| A | 9132 | 8262 | 283 | 283 | 3.10% | 3.43% | 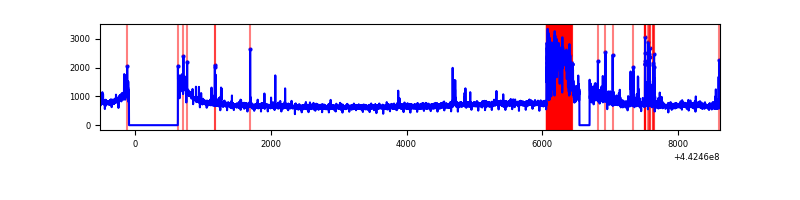 |
| B | 9133 | 8264 | 62 | 62 | 0.68% | 0.75% | 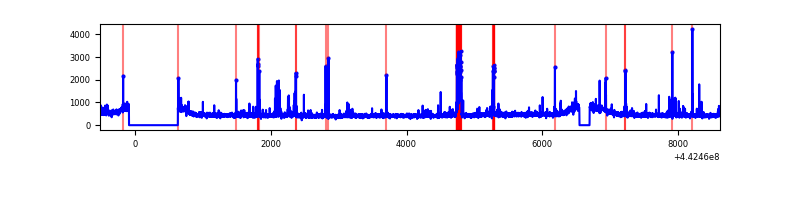 |
| C | 9133 | 8265 | 161 | 161 | 1.76% | 1.95% | 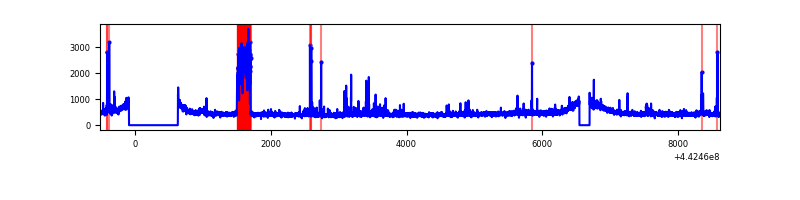 |
| D | 9133 | 8264 | 591 | 591 | 6.47% | 7.15% | 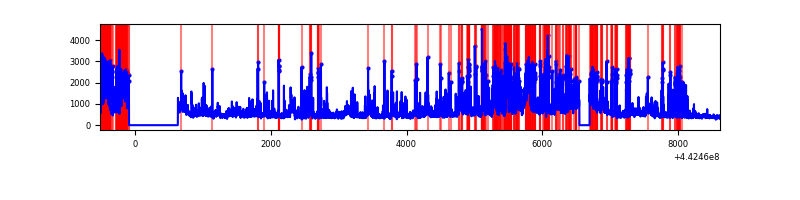 |
Top three noisy pixels from each quadrant. If the there are fewer than three noisy pixels in the level2.evt file, extra rows are filled as -1
| Pixel properties | Quadrant properties | ||||||
|---|---|---|---|---|---|---|---|
| Quadrant | DetID | PixID | Counts | Sigma | Mean | Median | Sigma |
| A | 10 | 83 | 2297704 | 11966.73 | 927 | 906 | 191.9 |
| A | 15 | 223 | 738087 | 3840.85 | 927 | 906 | 191.9 |
| A | 13 | 248 | 103375 | 533.88 | 927 | 906 | 191.9 |
| B | 5 | 172 | 180298 | 945.06 | 949 | 916 | 189.8 |
| B | 5 | 255 | 136177 | 712.61 | 949 | 916 | 189.8 |
| B | 12 | 111 | 24653 | 125.06 | 949 | 916 | 189.8 |
| C | 12 | 2 | 428764 | 1941.04 | 943 | 946 | 220.4 |
| C | 14 | 254 | 97765 | 439.27 | 943 | 946 | 220.4 |
| C | 2 | 14 | 31407 | 138.2 | 943 | 946 | 220.4 |
| D | 1 | 52 | 774020 | 3449.79 | 896 | 865 | 224.1 |
| D | 5 | 222 | 559881 | 2494.31 | 896 | 865 | 224.1 |
| D | 13 | 249 | 462475 | 2059.68 | 896 | 865 | 224.1 |
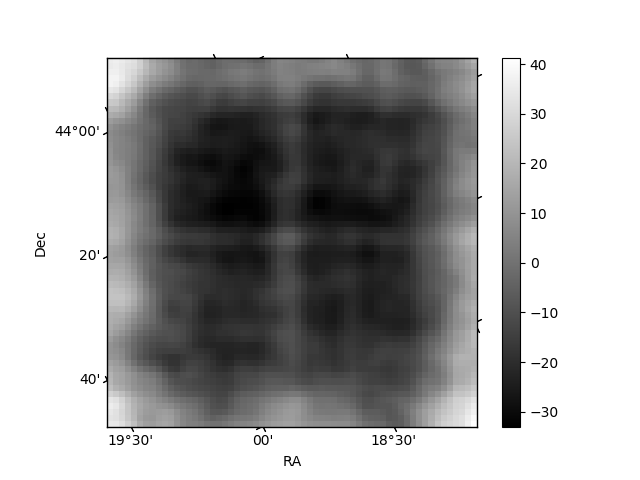
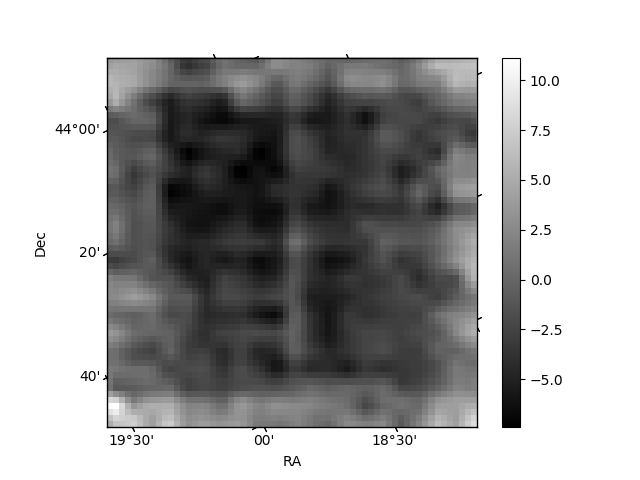
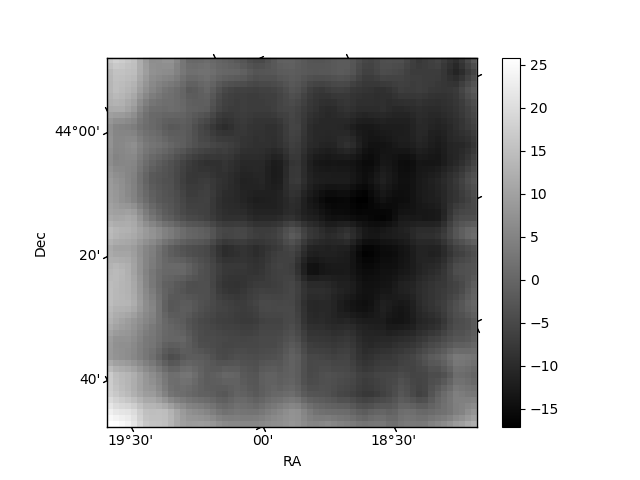
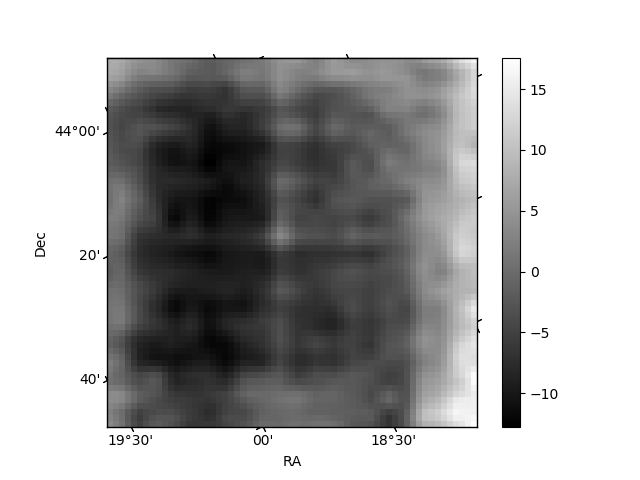
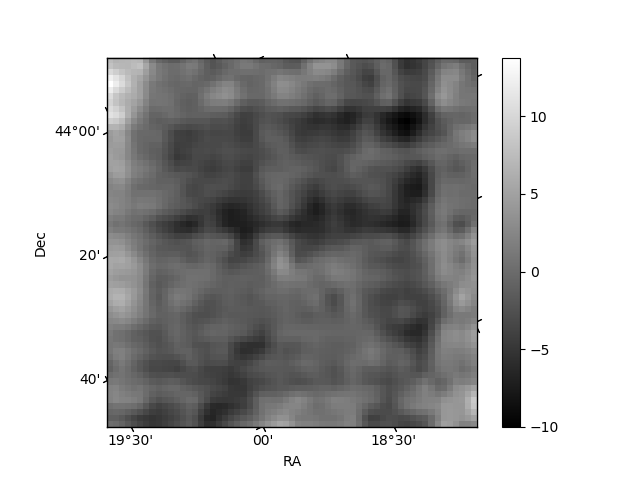
Histogram calculated using DETX and DETY for each event in the final _common_clean file
| Quadrant A | 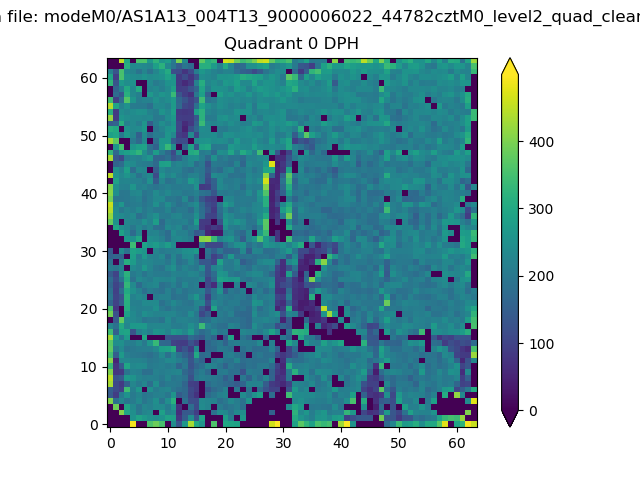 |
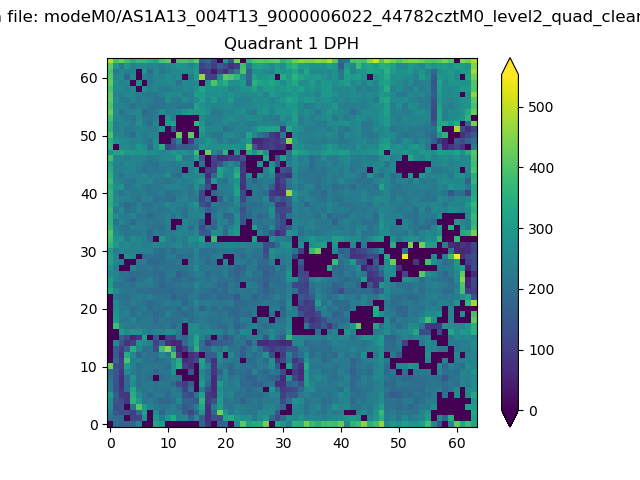 |
Quadrant B |
|---|---|---|---|
| Quadrant D | 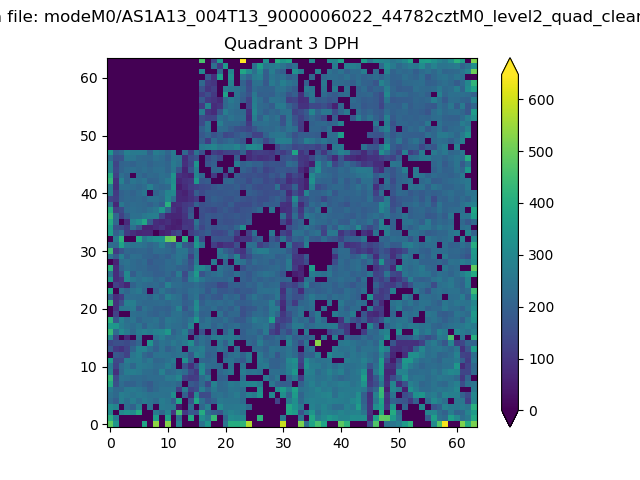 |
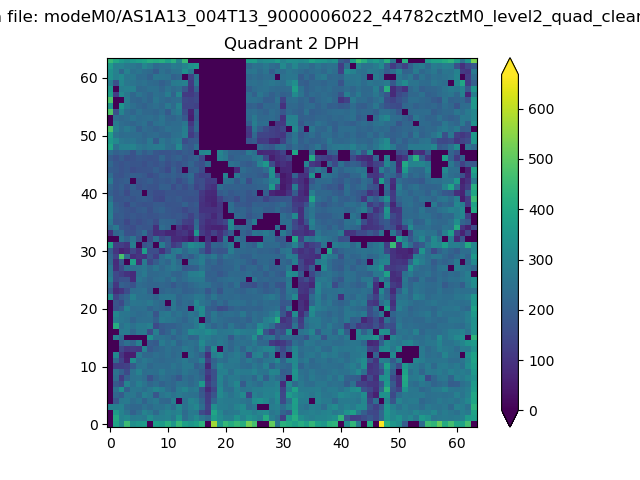 |
Quadrant C |
| Plot type | Count rate plots | Images |
|---|---|---|
| Comparison with Poisson distribution Blue bars denote a histogram of data divided into 1 sec bins. Red curve is a Poisson curve with rate = median count rate of data. |
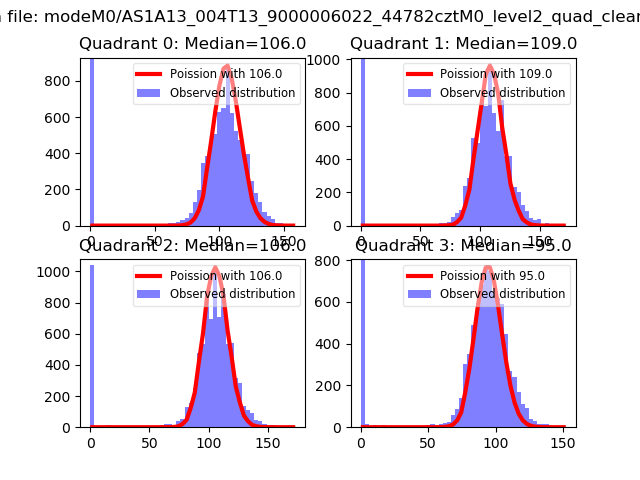 |
 |
| Quadrant-wise count rates Data is divided into 100 sec bins |
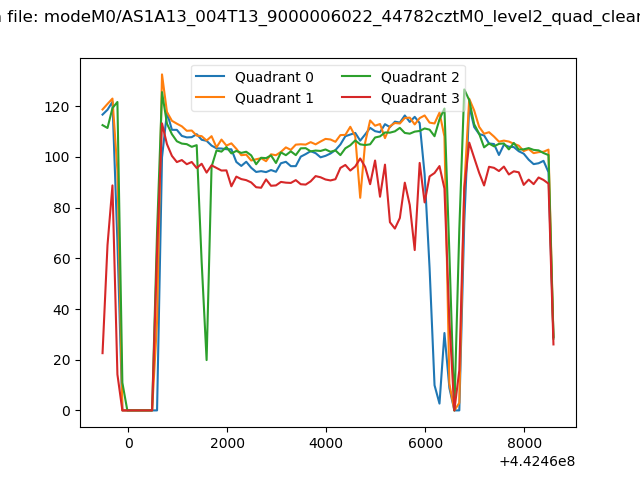 |
|
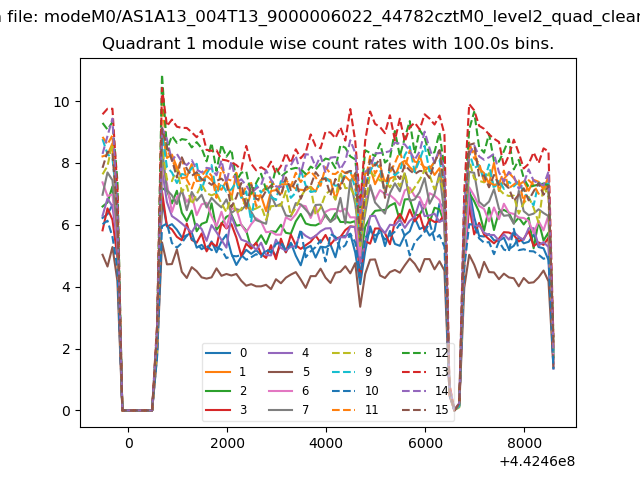
| Module-wise count rates for Quadrant A Data is divided into 100 sec bins |
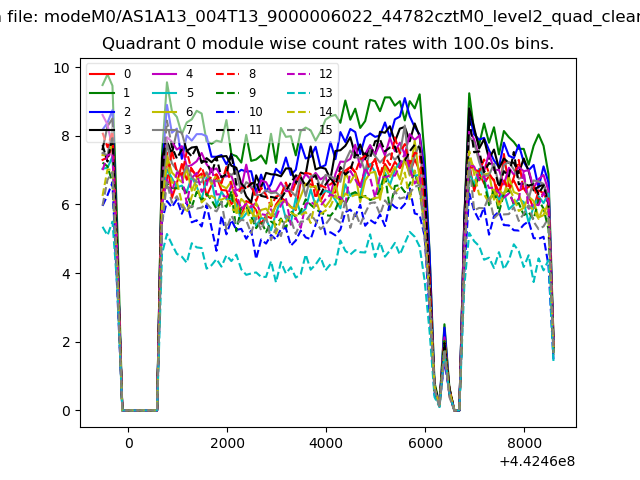 |
 |
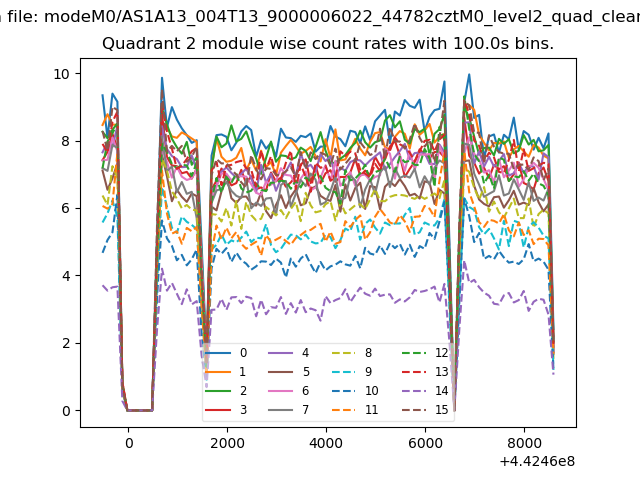
| Module-wise count rates for Quadrant B Data is divided into 100 sec bins |
 |
 |
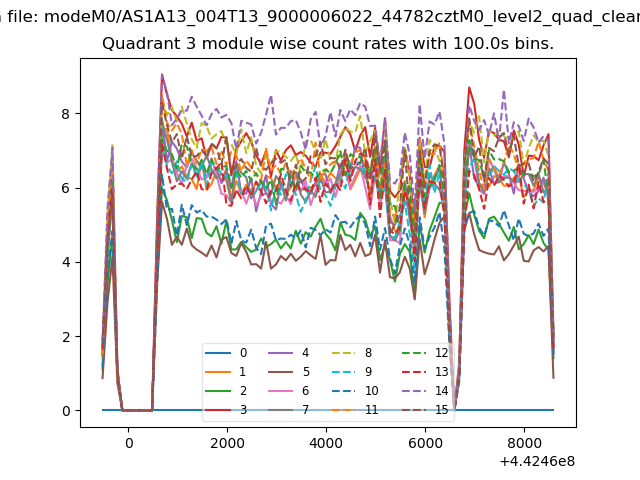
| Module-wise count rates for Quadrant C Data is divided into 100 sec bins |
 |
 |
| Module-wise count rates for Quadrant D Data is divided into 100 sec bins |
 |
 |
| Parameter | Plot |
|---|---|
| CZT HV Monitor | 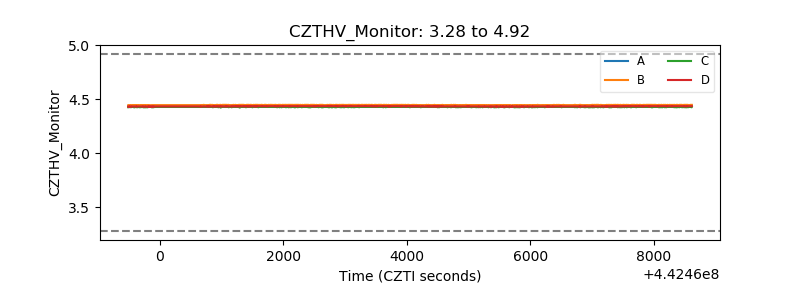 |
| D_VDD | 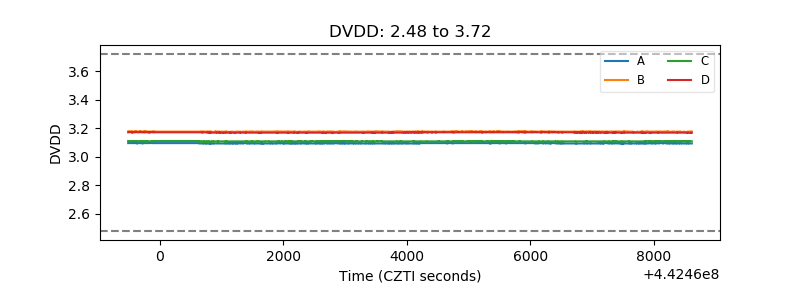 |
| Temperature 1 | 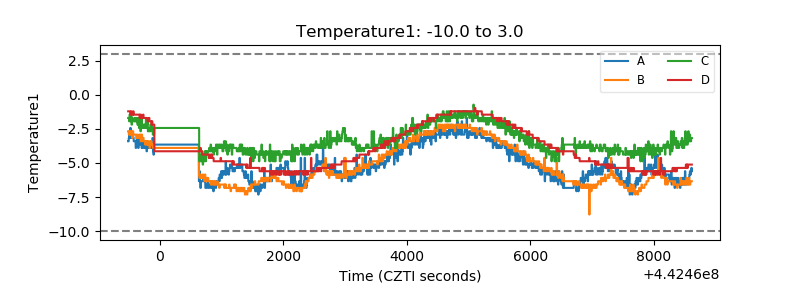 |
| Veto HV Monitor | 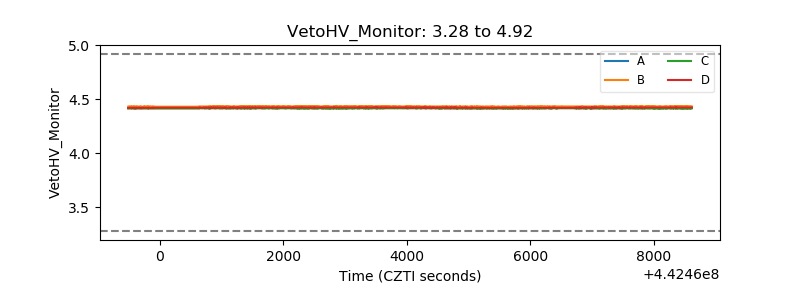 |
| Veto LLD | 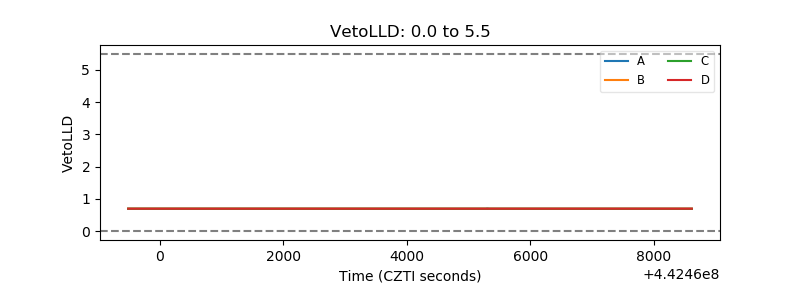 |
| Alpha Counter | 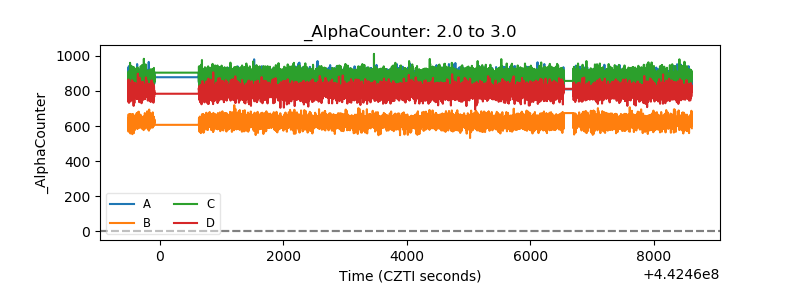 |
| _CPM_Rate | 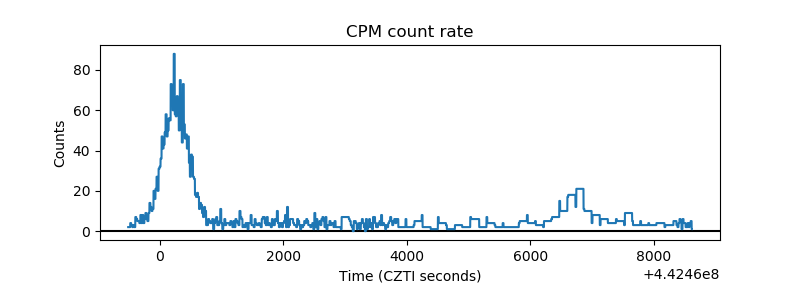 |
| CZT Counter | 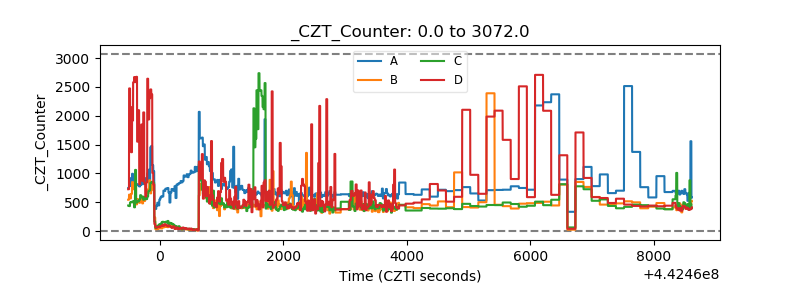 |
| +2.5 Volts monitor | 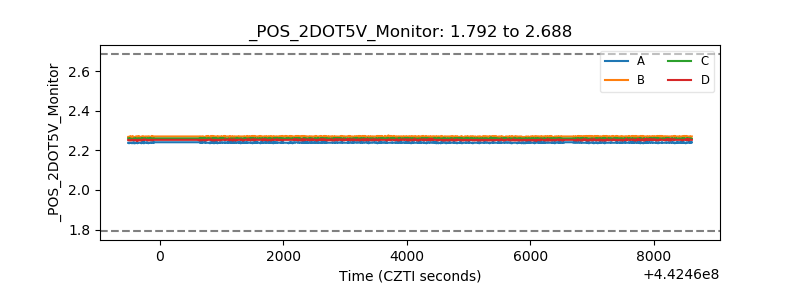 |
| +5 Volts monitor | 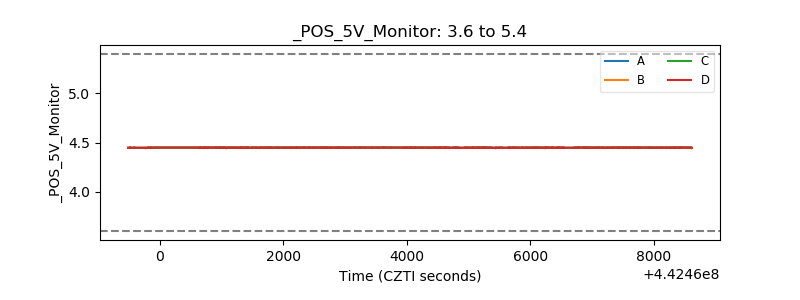 |
| _ROLL_ROT | 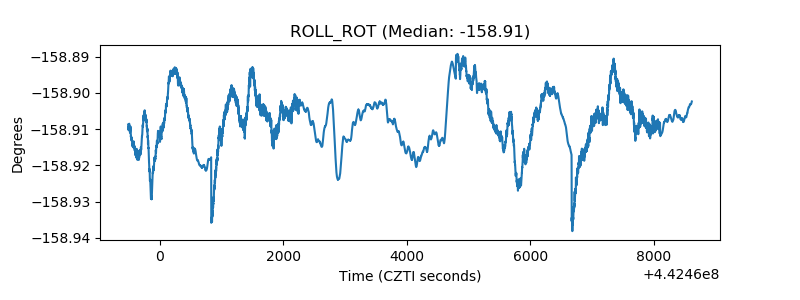 |
| _Roll_DEC | 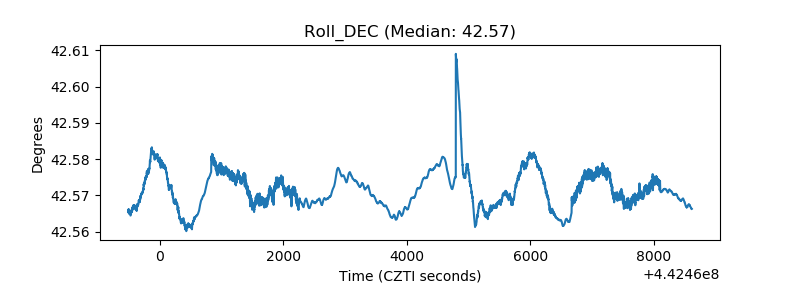 |
| _Roll_RA | 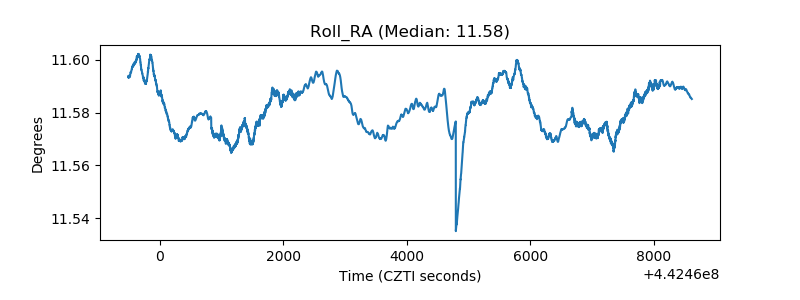 |
| Veto Counter | 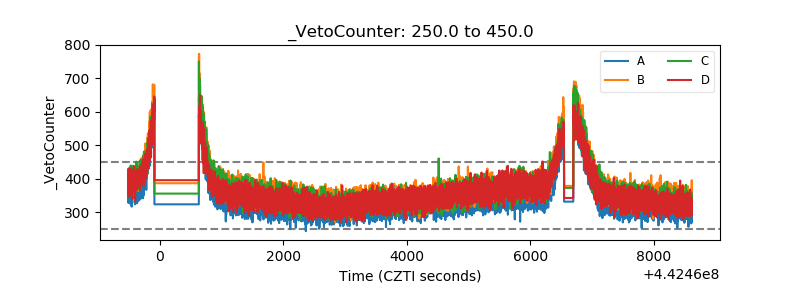 |