| Param | Original file | Final file |
|---|---|---|
| Filename | modeM0/AS1A13_004T13_9000006022_44783cztM0_level2.fits | modeM0/AS1A13_004T13_9000006022_44783cztM0_level2_quad_clean.evt |
| Size (bytes) | 650,396,160 | 127,696,320 |
| Size | 620.3 MB | 121.8 MB |
| Events in quadrant A | 7,844,996 | 795,281 |
| Events in quadrant B | 4,163,098 | 888,362 |
| Events in quadrant C | 3,947,031 | 880,305 |
| Events in quadrant D | 7,470,495 | 720,399 |
| Mode M9 | |||
|---|---|---|---|
| Quadrant | BADHDUFLAG | Total packets | Discarded packets |
| A | 0 | 2 | 0 |
| B | 0 | 2 | 0 |
| C | 0 | 2 | 0 |
| D | 0 | 2 | 0 |
| Mode M0 | |||
|---|---|---|---|
| Quadrant | BADHDUFLAG | Total packets | Discarded packets |
| A | 0 | 29972 | 1 |
| B | 0 | 18353 | 1 |
| C | 0 | 17919 | 1 |
| D | 0 | 28099 | 1 |
| Mode SS | |||
|---|---|---|---|
| Quadrant | BADHDUFLAG | Total packets | Discarded packets |
| A | 0 | 170 | 0 |
| B | 0 | 170 | 0 |
| C | 0 | 170 | 0 |
| D | 0 | 170 | 0 |
| Quadrant | Total seconds | Saturated seconds | Saturation percentage |
|---|---|---|---|
| A | 8375 | 1012 | 12.083582% |
| B | 8375 | 353 | 4.214925% |
| C | 8376 | 137 | 1.635626% |
| D | 8376 | 1126 | 13.443171% |
Noise dominated data is calculated using 1-second bins in cleaned event files. If a bin has >2000 counts, and if more than 50% of those come from <1% of pixels, then it is considered to be noise-dominated and hence unusable.
| Quadrant | # 1 sec bins | Bins with >0 counts | Bins with >2000 counts | High rate bins dominated by noise | Noise dominated (total time) | Noise dominated (detector-on time) | Marked lightcurve |
|---|---|---|---|---|---|---|---|
| A | 8525 | 8375 | 574 | 574 | 6.73% | 6.85% | 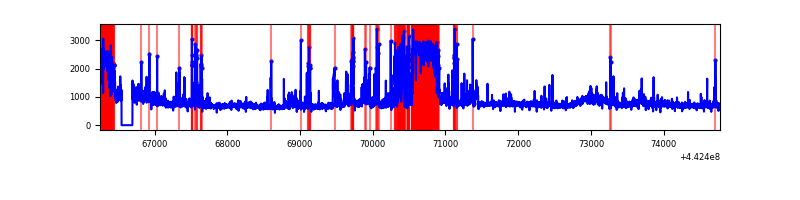 |
| B | 8525 | 8376 | 24 | 24 | 0.28% | 0.29% | 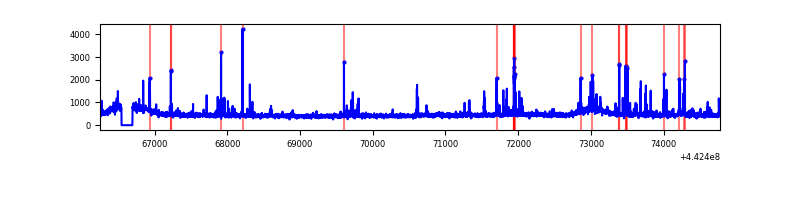 |
| C | 8526 | 8377 | 20 | 20 | 0.23% | 0.24% | 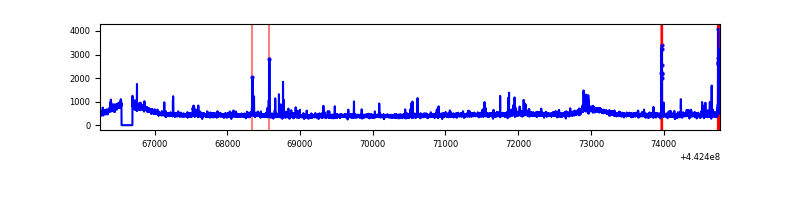 |
| D | 8526 | 8377 | 896 | 896 | 10.51% | 10.70% | 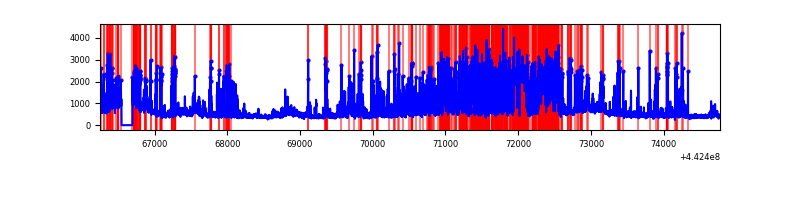 |
Top three noisy pixels from each quadrant. If the there are fewer than three noisy pixels in the level2.evt file, extra rows are filled as -1
| Pixel properties | Quadrant properties | ||||||
|---|---|---|---|---|---|---|---|
| Quadrant | DetID | PixID | Counts | Sigma | Mean | Median | Sigma |
| A | 10 | 83 | 2166113 | 11335.72 | 919 | 897 | 191.0 |
| A | 15 | 223 | 1986710 | 10396.48 | 919 | 897 | 191.0 |
| A | 13 | 248 | 134193 | 697.85 | 919 | 897 | 191.0 |
| B | 5 | 255 | 144015 | 740.53 | 960 | 927 | 193.2 |
| B | 5 | 172 | 68335 | 348.86 | 960 | 927 | 193.2 |
| B | 4 | 158 | 49678 | 252.3 | 960 | 927 | 193.2 |
| C | 14 | 254 | 131806 | 584.65 | 955 | 956 | 223.8 |
| C | 1 | 3 | 36639 | 159.44 | 955 | 956 | 223.8 |
| C | 2 | 14 | 15465 | 64.83 | 955 | 956 | 223.8 |
| D | 1 | 52 | 1980961 | 8934.74 | 887 | 858 | 221.6 |
| D | 13 | 187 | 564233 | 2542.1 | 887 | 858 | 221.6 |
| D | 5 | 235 | 496613 | 2236.98 | 887 | 858 | 221.6 |
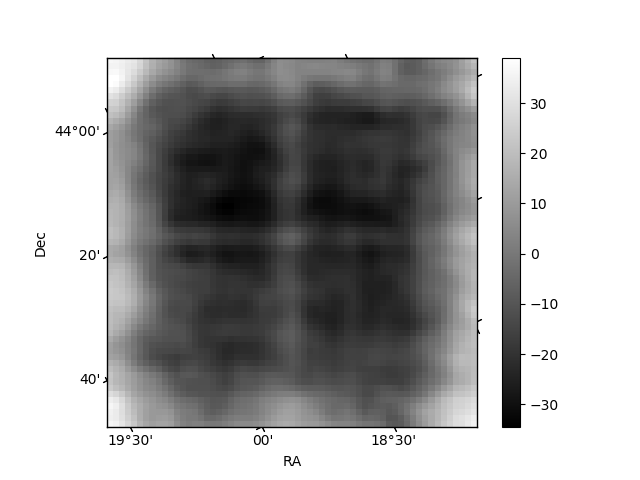
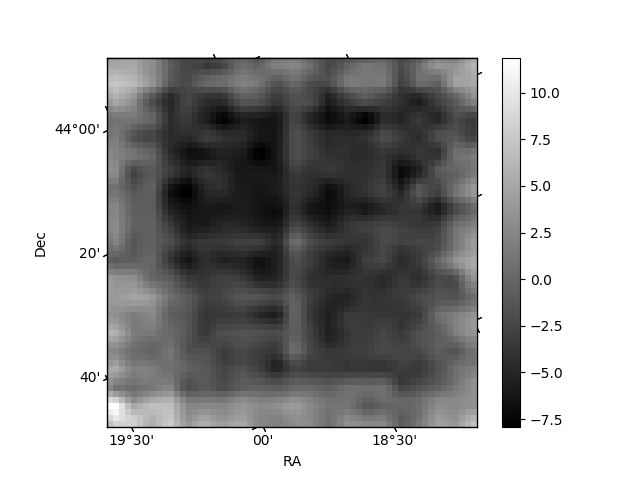
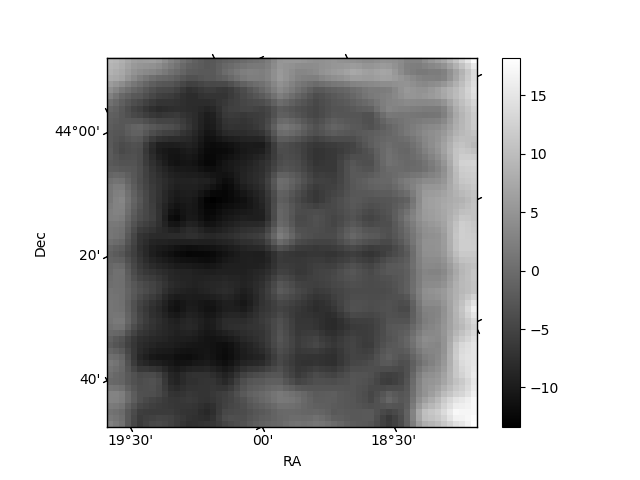
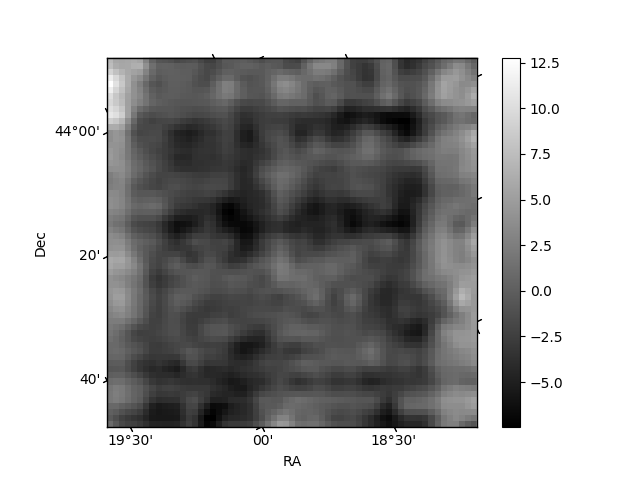
Histogram calculated using DETX and DETY for each event in the final _common_clean file
| Quadrant A | 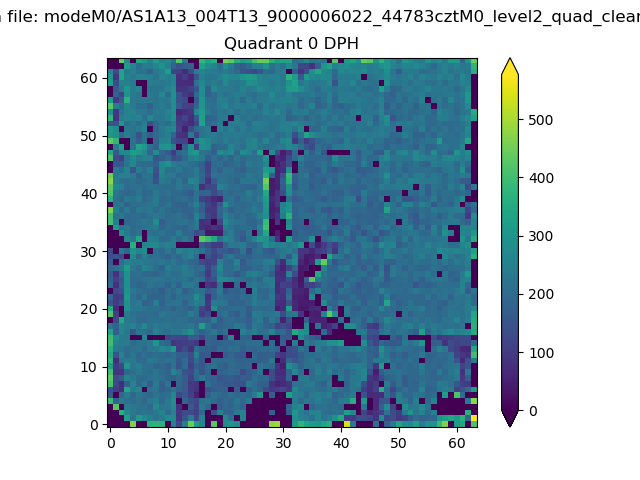 |
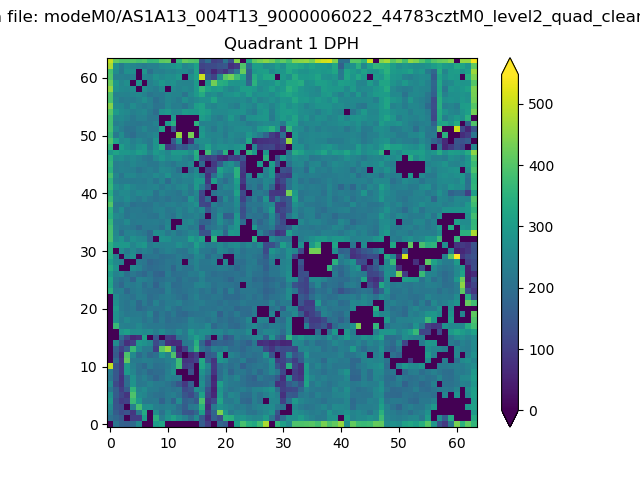 |
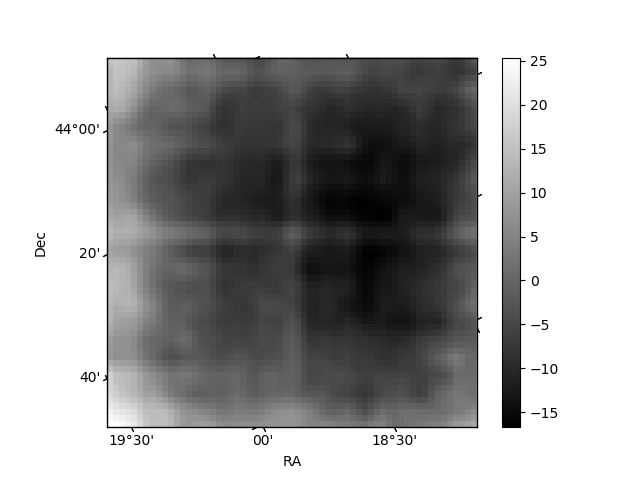
Quadrant B |
|---|---|---|---|
| Quadrant D | 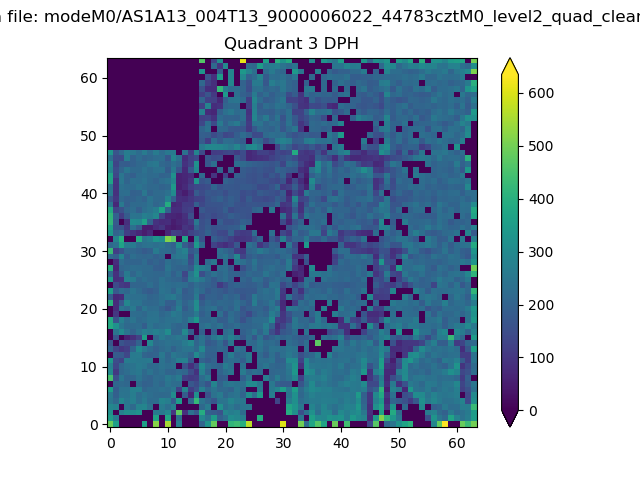 |
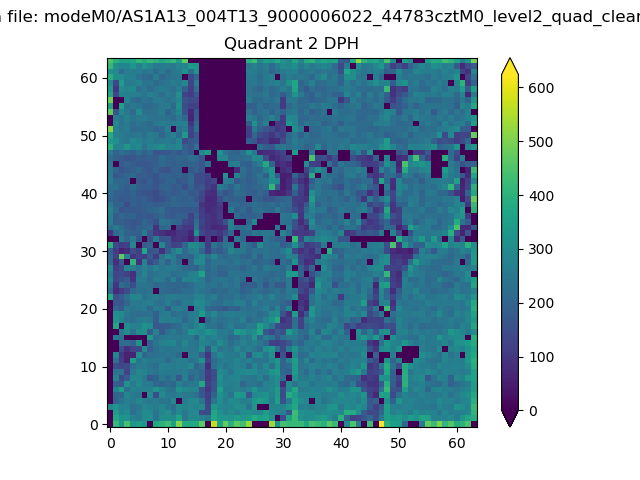 |
Quadrant C |
| Plot type | Count rate plots | Images |
|---|---|---|
| Comparison with Poisson distribution Blue bars denote a histogram of data divided into 1 sec bins. Red curve is a Poisson curve with rate = median count rate of data. |
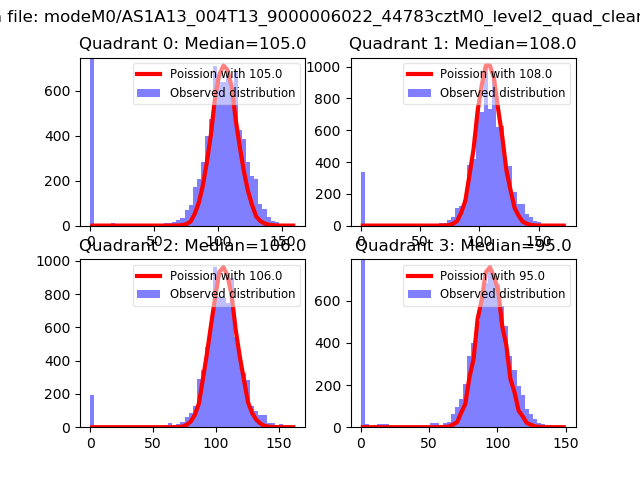 |
 |
| Quadrant-wise count rates Data is divided into 100 sec bins |
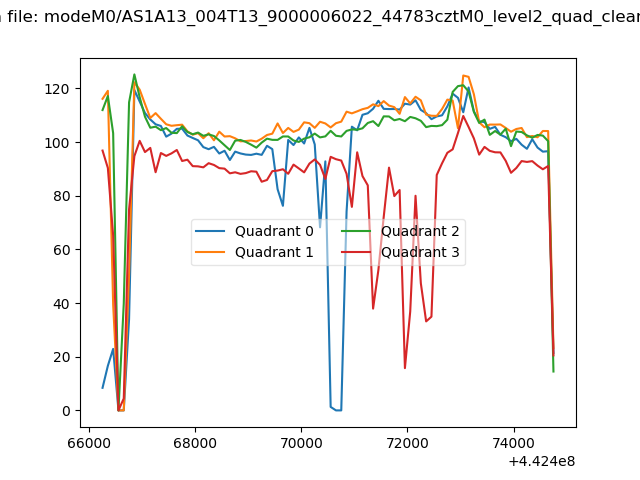 |
|
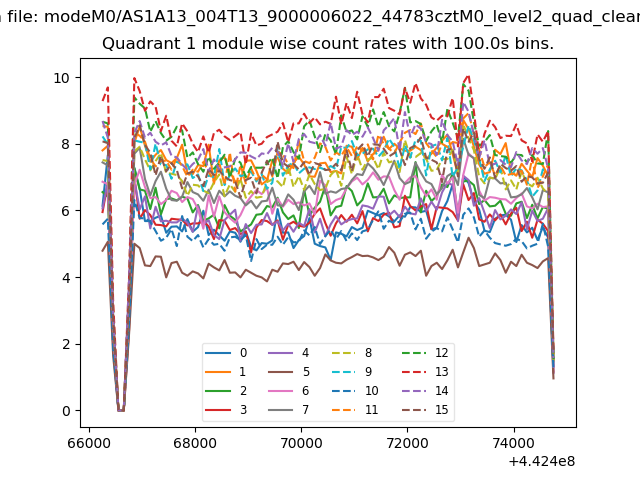
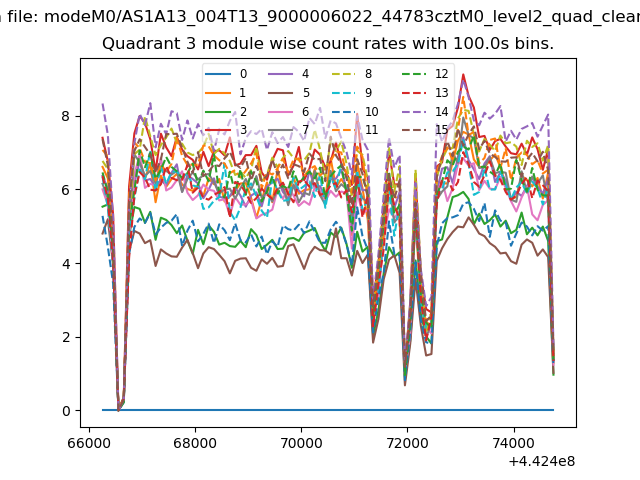
| Module-wise count rates for Quadrant A Data is divided into 100 sec bins |
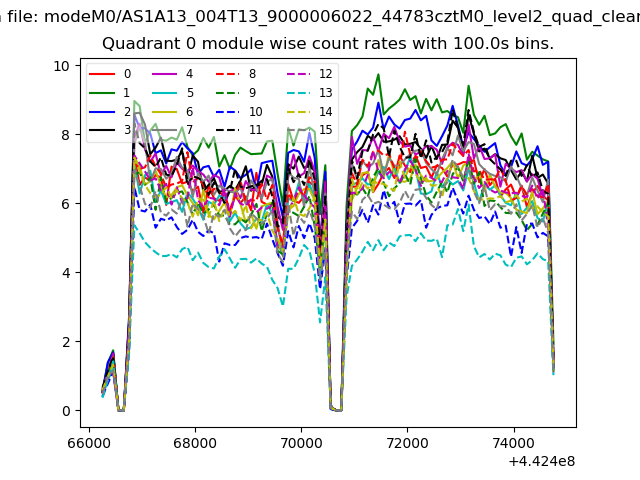 |
 |
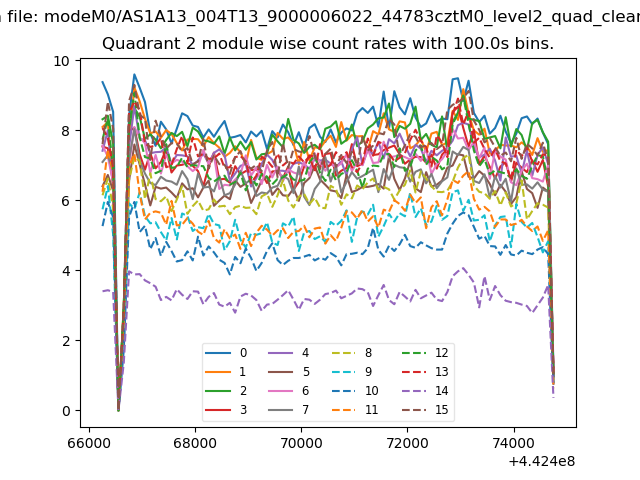
| Module-wise count rates for Quadrant B Data is divided into 100 sec bins |
 |
 |
| Module-wise count rates for Quadrant C Data is divided into 100 sec bins |
 |
 |
| Module-wise count rates for Quadrant D Data is divided into 100 sec bins |
 |
 |
| Parameter | Plot |
|---|---|
| CZT HV Monitor | 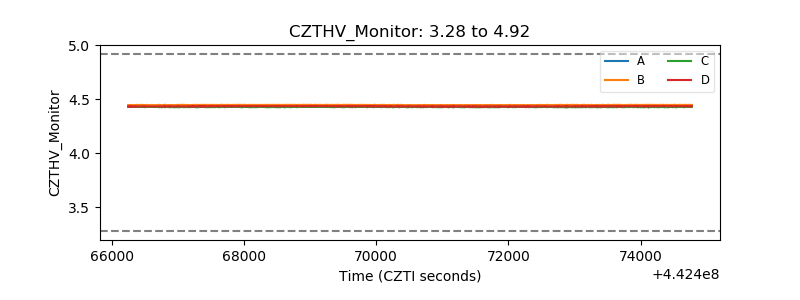 |
| D_VDD | 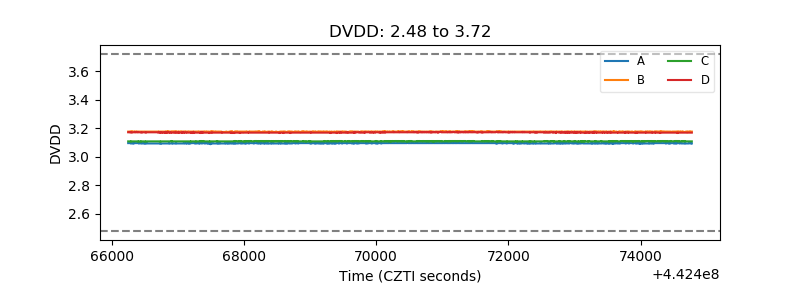 |
| Temperature 1 | 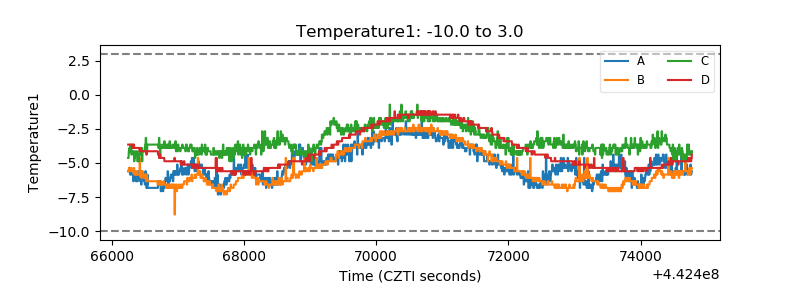 |
| Veto HV Monitor |  |
| Veto LLD | 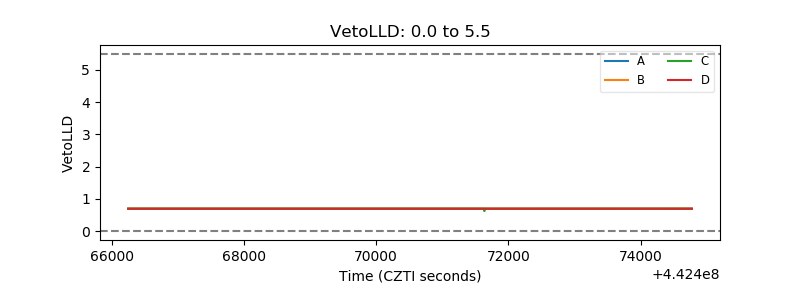 |
| Alpha Counter | 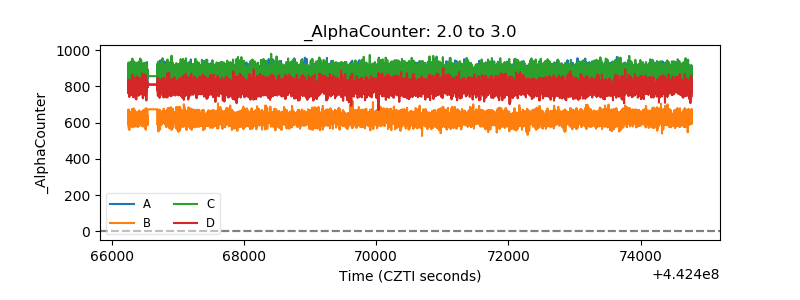 |
| _CPM_Rate | 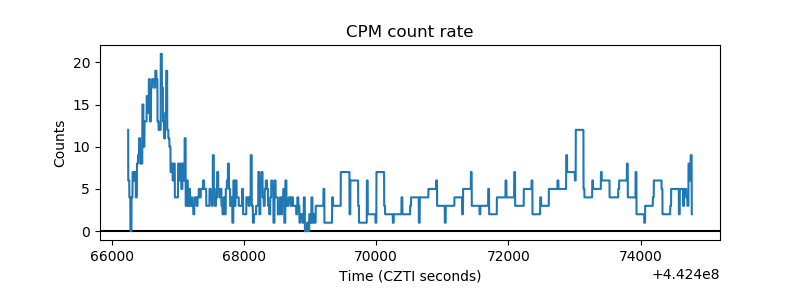 |
| CZT Counter | 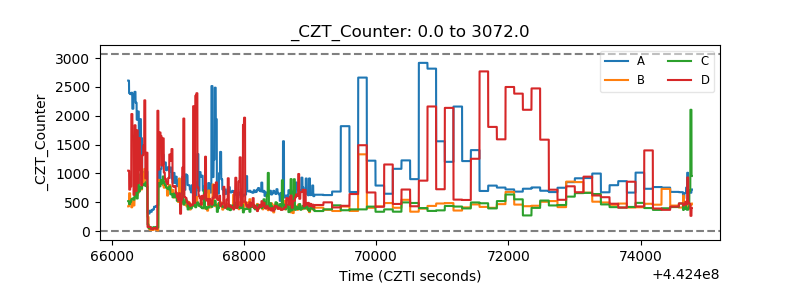 |
| +2.5 Volts monitor | 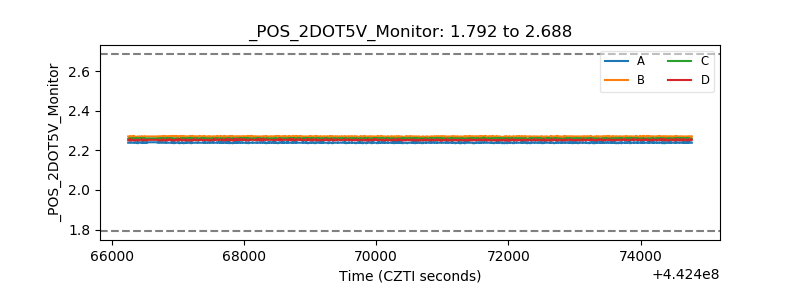 |
| +5 Volts monitor | 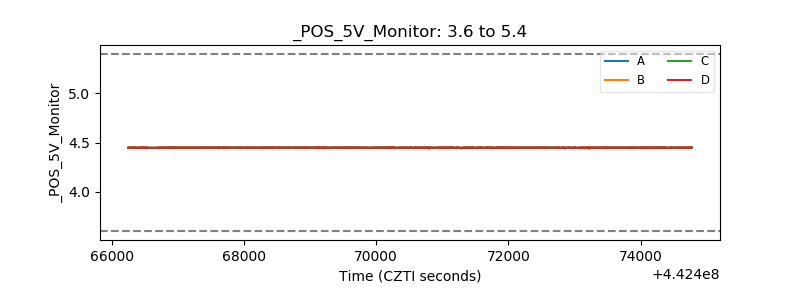 |
| _ROLL_ROT | 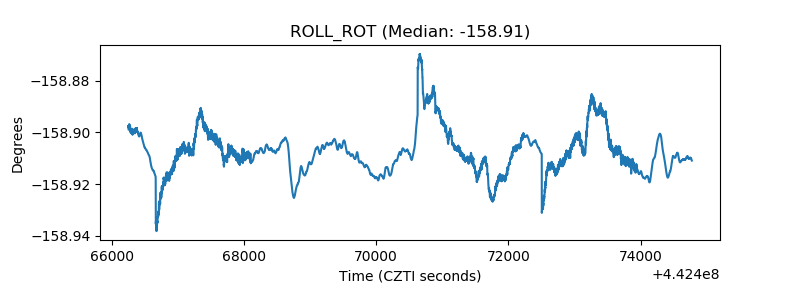 |
| _Roll_DEC | 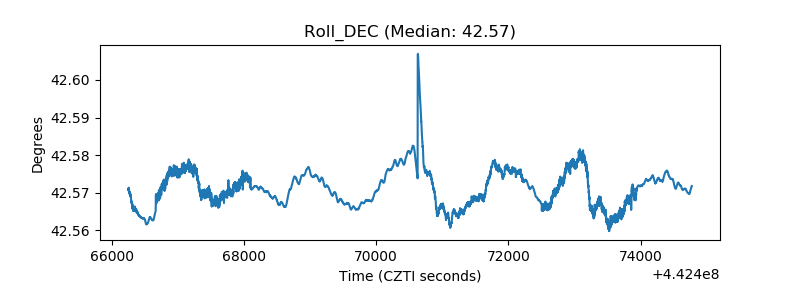 |
| _Roll_RA | 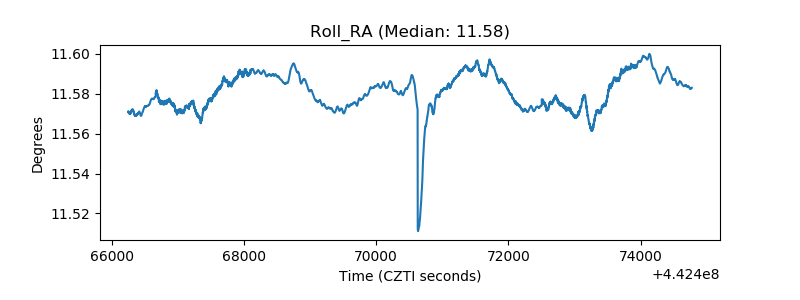 |
| Veto Counter | 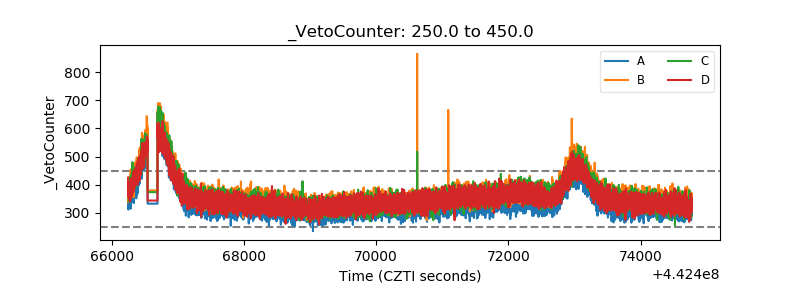 |