| Param | Original file | Final file |
|---|---|---|
| Filename | modeM0/AS1A13_004T13_9000006022_44784cztM0_level2.fits | modeM0/AS1A13_004T13_9000006022_44784cztM0_level2_quad_clean.evt |
| Size (bytes) | 607,659,840 | 135,990,720 |
| Size | 579.5 MB | 129.7 MB |
| Events in quadrant A | 6,710,097 | 898,055 |
| Events in quadrant B | 4,382,293 | 924,491 |
| Events in quadrant C | 4,017,327 | 906,798 |
| Events in quadrant D | 6,714,064 | 788,669 |
| Mode M0 | |||
|---|---|---|---|
| Quadrant | BADHDUFLAG | Total packets | Discarded packets |
| A | 0 | 27137 | 0 |
| B | 0 | 19169 | 0 |
| C | 0 | 18387 | 0 |
| D | 0 | 25934 | 0 |
| Mode SS | |||
|---|---|---|---|
| Quadrant | BADHDUFLAG | Total packets | Discarded packets |
| A | 0 | 172 | 0 |
| B | 0 | 172 | 0 |
| C | 0 | 172 | 0 |
| D | 0 | 172 | 0 |
| Quadrant | Total seconds | Saturated seconds | Saturation percentage |
|---|---|---|---|
| A | 8634 | 316 | 3.659949% |
| B | 8633 | 300 | 3.475038% |
| C | 8633 | 70 | 0.810842% |
| D | 8633 | 667 | 7.726167% |
Noise dominated data is calculated using 1-second bins in cleaned event files. If a bin has >2000 counts, and if more than 50% of those come from <1% of pixels, then it is considered to be noise-dominated and hence unusable.
| Quadrant | # 1 sec bins | Bins with >0 counts | Bins with >2000 counts | High rate bins dominated by noise | Noise dominated (total time) | Noise dominated (detector-on time) | Marked lightcurve |
|---|---|---|---|---|---|---|---|
| A | 8634 | 8634 | 53 | 53 | 0.61% | 0.61% | 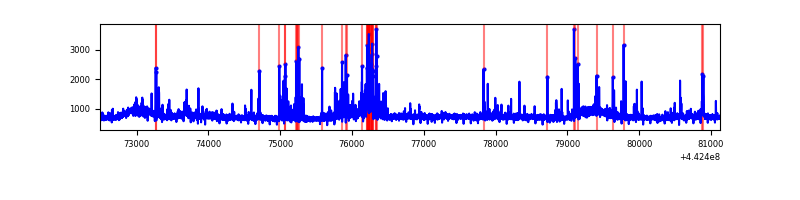 |
| B | 8633 | 8633 | 51 | 51 | 0.59% | 0.59% | 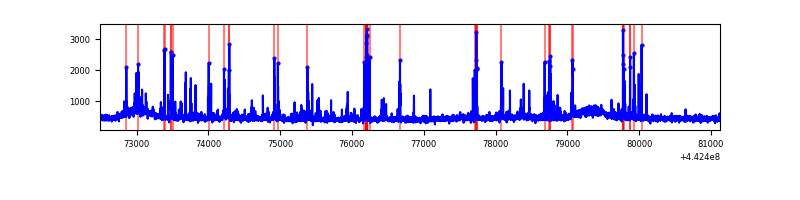 |
| C | 8633 | 8633 | 28 | 28 | 0.32% | 0.32% | 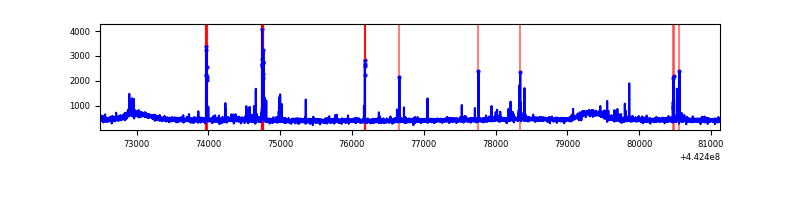 |
| D | 8633 | 8633 | 525 | 525 | 6.08% | 6.08% | 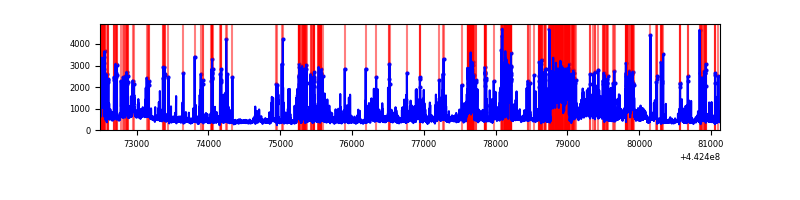 |
Top three noisy pixels from each quadrant. If the there are fewer than three noisy pixels in the level2.evt file, extra rows are filled as -1
| Pixel properties | Quadrant properties | ||||||
|---|---|---|---|---|---|---|---|
| Quadrant | DetID | PixID | Counts | Sigma | Mean | Median | Sigma |
| A | 10 | 83 | 2280913 | 11180.29 | 978 | 956 | 203.9 |
| A | 15 | 223 | 592747 | 2901.98 | 978 | 956 | 203.9 |
| A | 13 | 248 | 46403 | 222.86 | 978 | 956 | 203.9 |
| B | 5 | 255 | 242153 | 1234.22 | 977 | 943 | 195.4 |
| B | 5 | 172 | 85017 | 430.19 | 977 | 943 | 195.4 |
| B | 4 | 158 | 53433 | 268.58 | 977 | 943 | 195.4 |
| C | 14 | 254 | 107178 | 469.53 | 968 | 973 | 226.2 |
| C | 2 | 14 | 49969 | 216.61 | 968 | 973 | 226.2 |
| C | 12 | 2 | 38208 | 164.61 | 968 | 973 | 226.2 |
| D | 1 | 52 | 1271259 | 5438.98 | 939 | 910 | 233.6 |
| D | 13 | 187 | 607086 | 2595.33 | 939 | 910 | 233.6 |
| D | 5 | 235 | 372492 | 1590.92 | 939 | 910 | 233.6 |
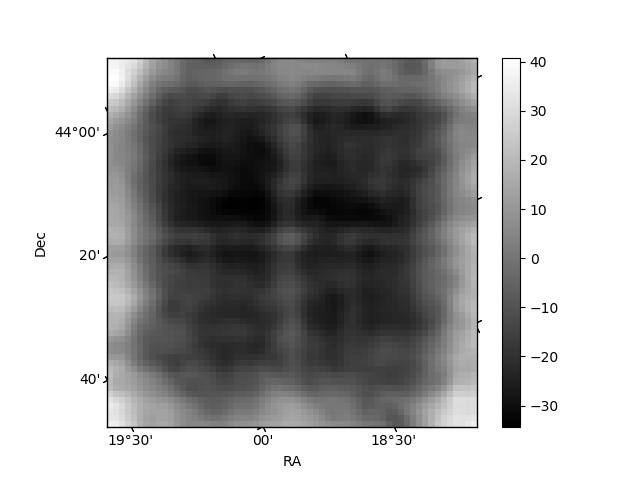
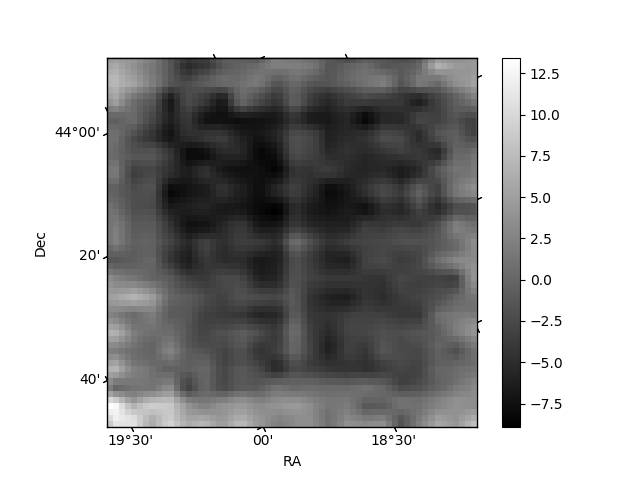
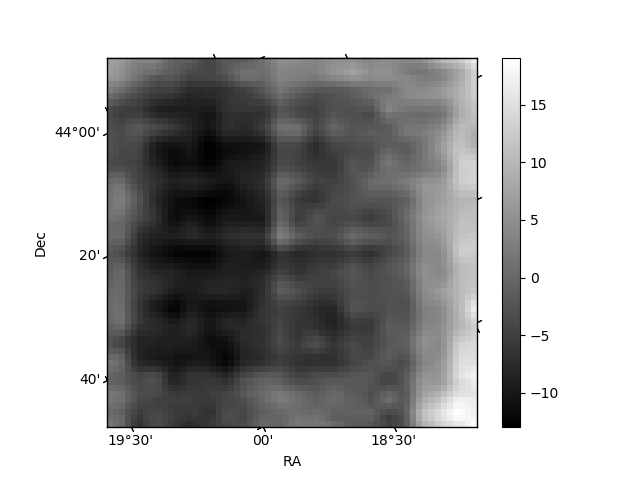
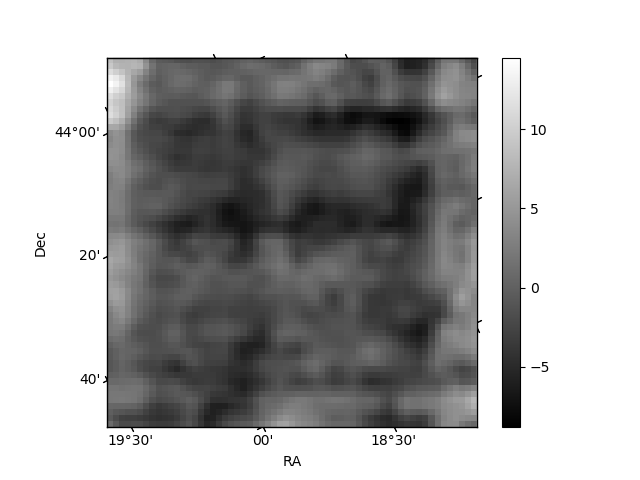
Histogram calculated using DETX and DETY for each event in the final _common_clean file
| Quadrant A | 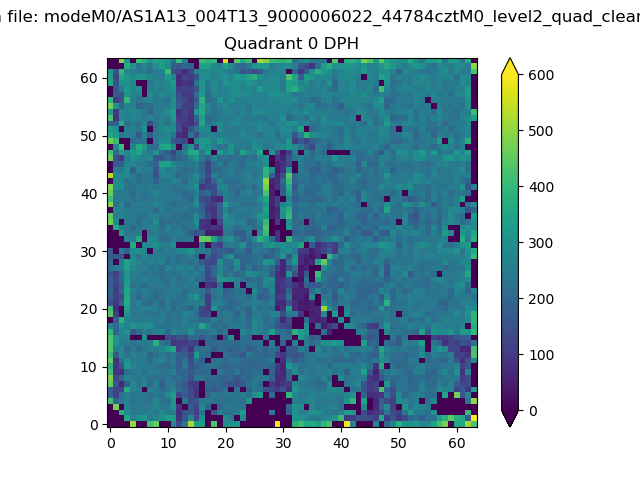 |
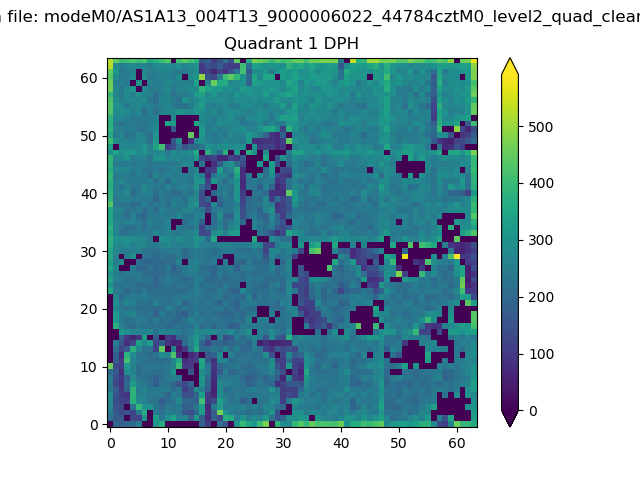 |
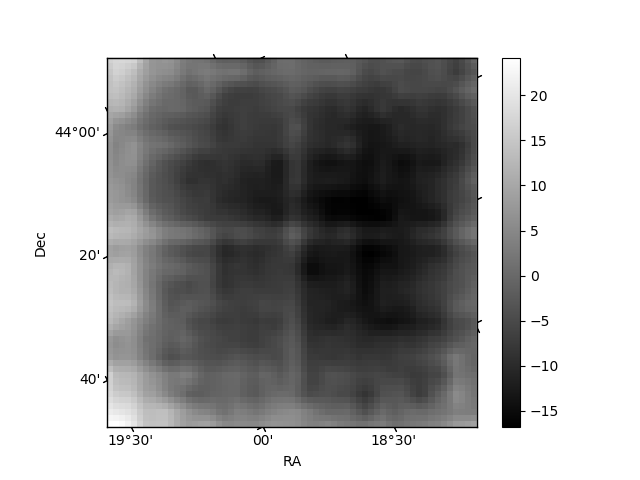
Quadrant B |
|---|---|---|---|
| Quadrant D | 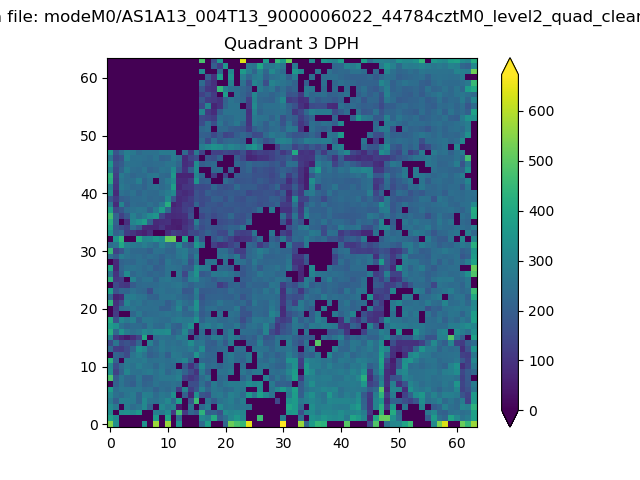 |
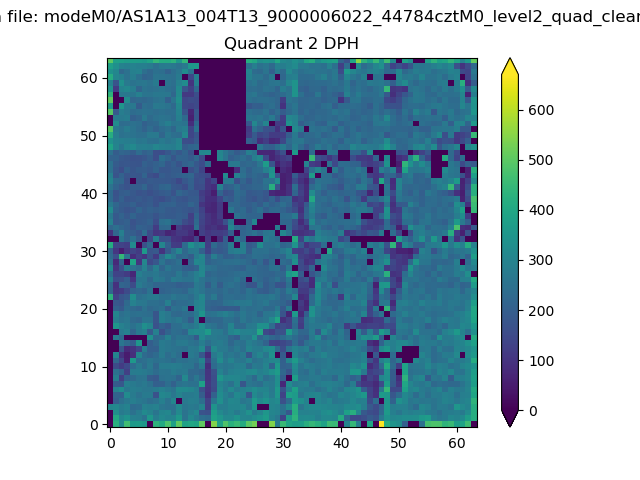 |
Quadrant C |
| Plot type | Count rate plots | Images |
|---|---|---|
| Comparison with Poisson distribution Blue bars denote a histogram of data divided into 1 sec bins. Red curve is a Poisson curve with rate = median count rate of data. |
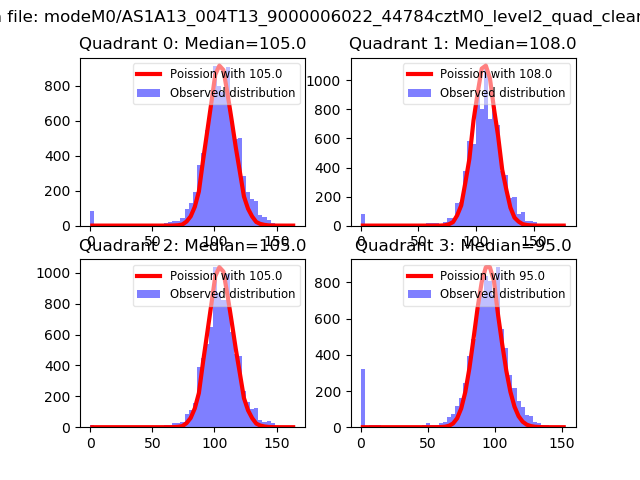 |
 |
| Quadrant-wise count rates Data is divided into 100 sec bins |
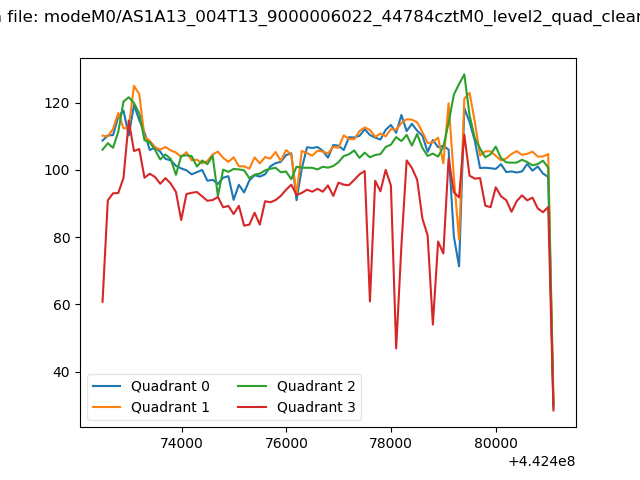 |
|
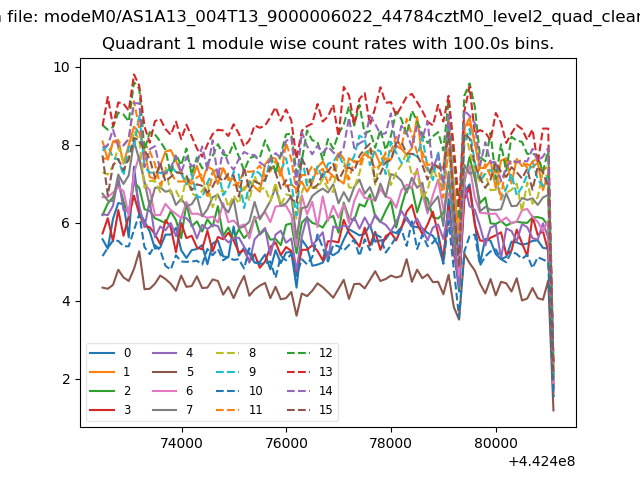
| Module-wise count rates for Quadrant A Data is divided into 100 sec bins |
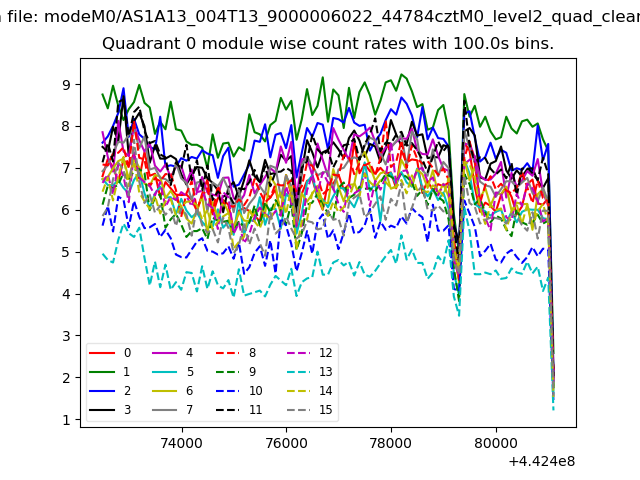 |
 |
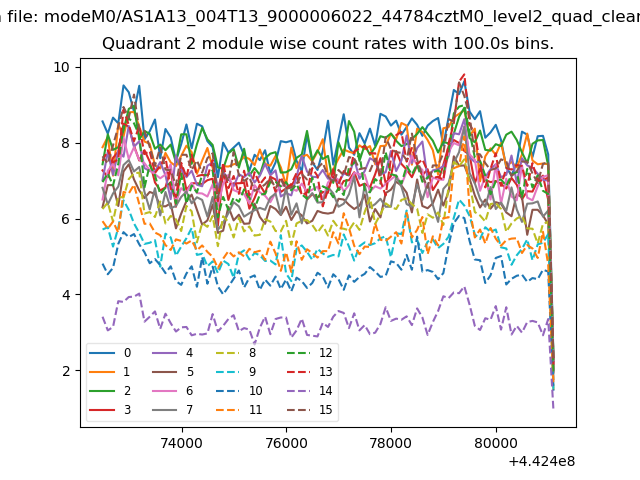
| Module-wise count rates for Quadrant B Data is divided into 100 sec bins |
 |
 |
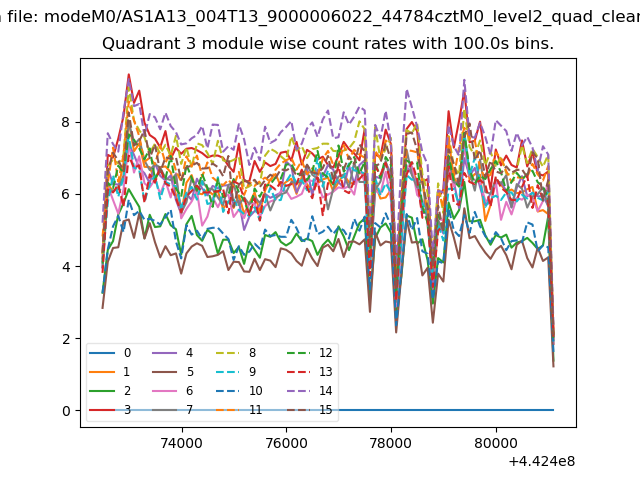
| Module-wise count rates for Quadrant C Data is divided into 100 sec bins |
 |
 |
| Module-wise count rates for Quadrant D Data is divided into 100 sec bins |
 |
 |
| Parameter | Plot |
|---|---|
| CZT HV Monitor | 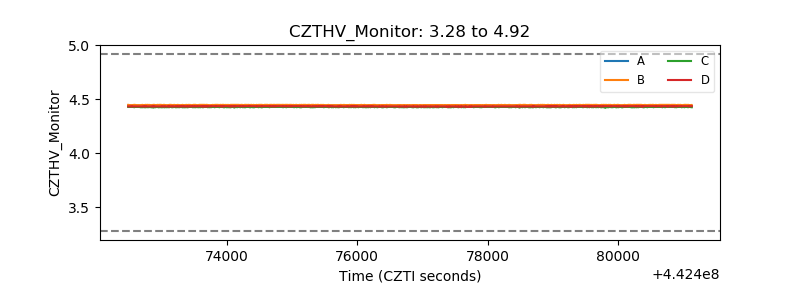 |
| D_VDD | 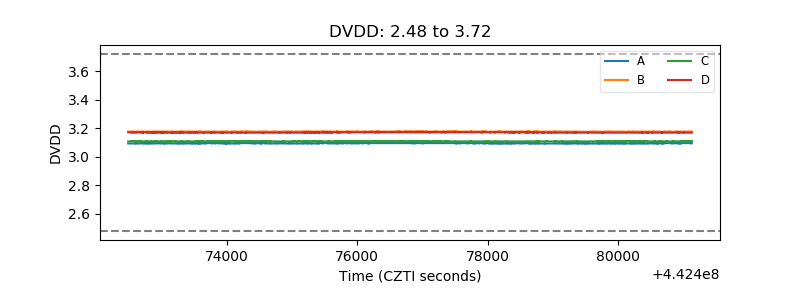 |
| Temperature 1 | 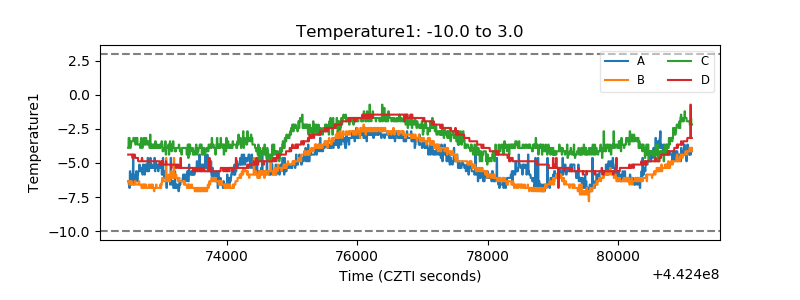 |
| Veto HV Monitor | 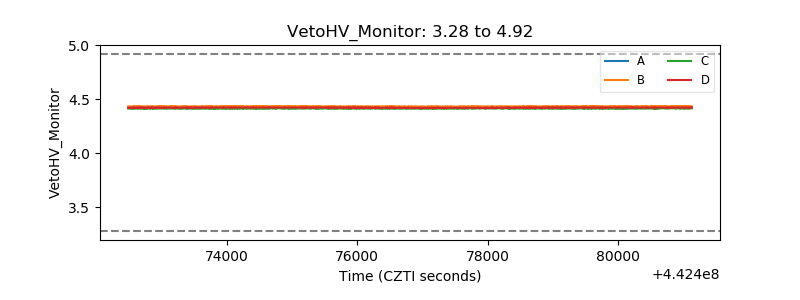 |
| Veto LLD | 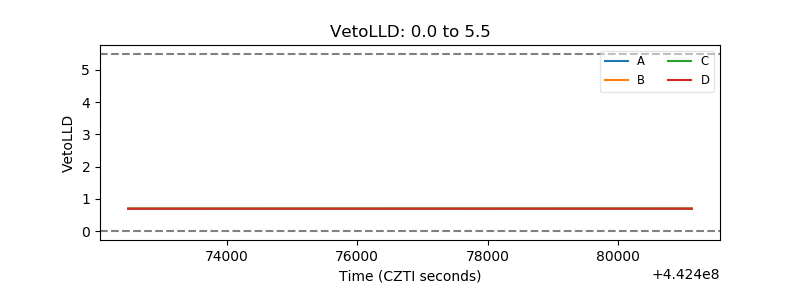 |
| Alpha Counter | 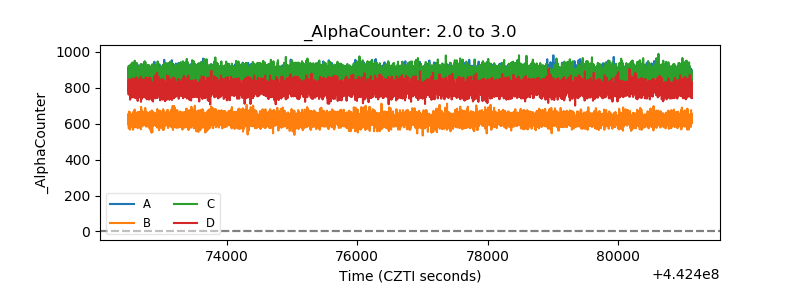 |
| _CPM_Rate | 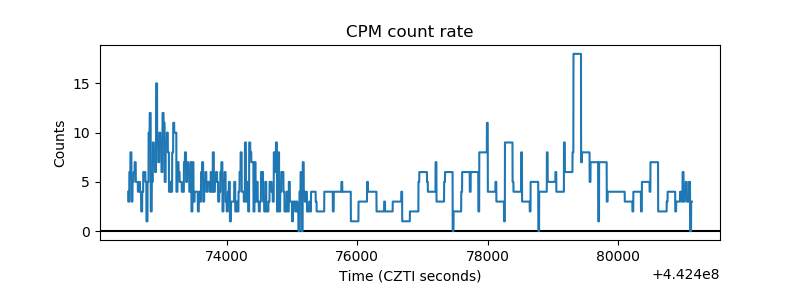 |
| CZT Counter | 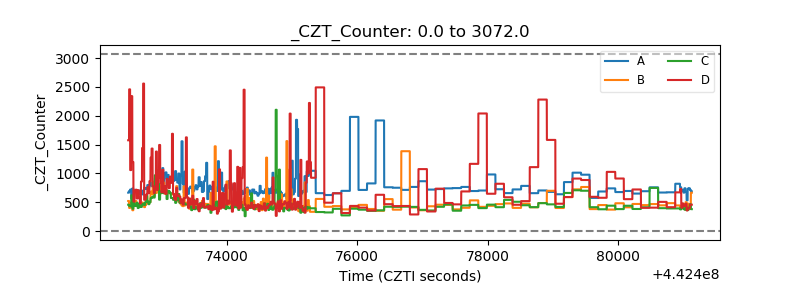 |
| +2.5 Volts monitor | 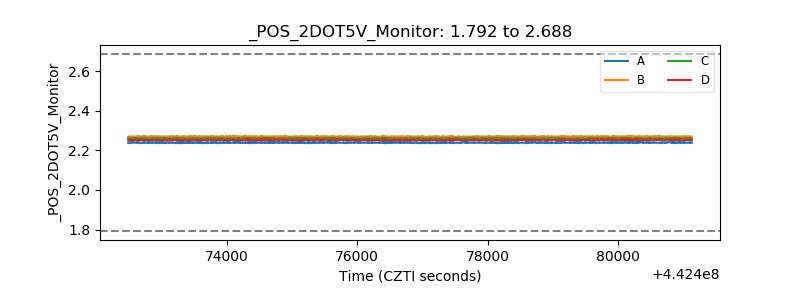 |
| +5 Volts monitor | 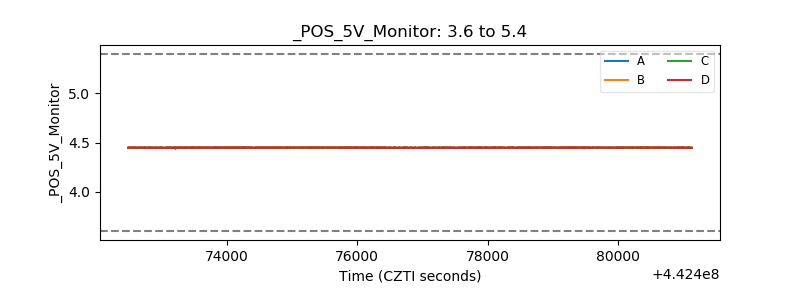 |
| _ROLL_ROT | 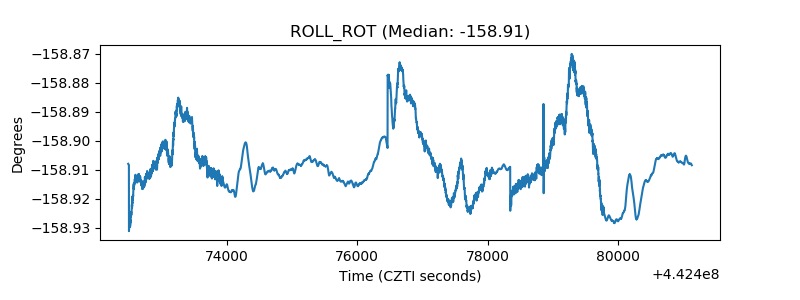 |
| _Roll_DEC | 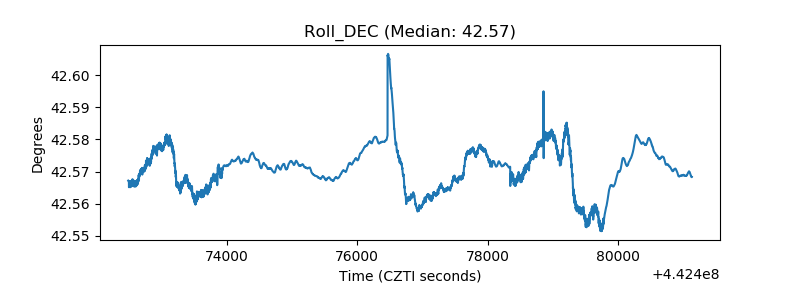 |
| _Roll_RA | 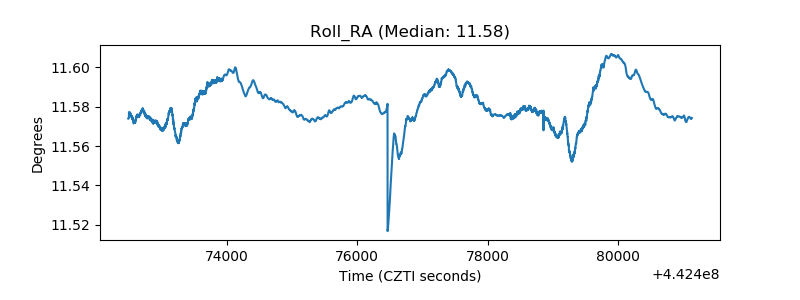 |
| Veto Counter | 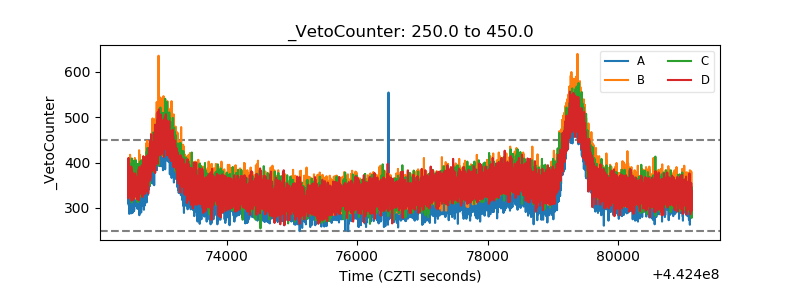 |