| Param | Original file | Final file |
|---|---|---|
| Filename | modeM0/AS1A13_004T13_9000006022_44787cztM0_level2.fits | modeM0/AS1A13_004T13_9000006022_44787cztM0_level2_quad_clean.evt |
| Size (bytes) | 1,529,760,960 | 268,781,760 |
| Size | 1.4 GB | 256.3 MB |
| Events in quadrant A | 15,403,891 | 1,831,340 |
| Events in quadrant B | 9,581,103 | 1,905,451 |
| Events in quadrant C | 8,038,418 | 1,865,018 |
| Events in quadrant D | 22,192,316 | 1,277,889 |
| Mode M9 | |||
|---|---|---|---|
| Quadrant | BADHDUFLAG | Total packets | Discarded packets |
| A | 0 | 16 | 0 |
| B | 0 | 16 | 0 |
| C | 0 | 16 | 0 |
| D | 0 | 16 | 0 |
| Mode M0 | |||
|---|---|---|---|
| Quadrant | BADHDUFLAG | Total packets | Discarded packets |
| A | 0 | 60482 | 3 |
| B | 0 | 41111 | 3 |
| C | 0 | 37671 | 3 |
| D | 0 | 78383 | 10 |
| Mode SS | |||
|---|---|---|---|
| Quadrant | BADHDUFLAG | Total packets | Discarded packets |
| A | 0 | 368 | 0 |
| B | 0 | 368 | 0 |
| C | 0 | 368 | 0 |
| D | 0 | 368 | 0 |
| Quadrant | Total seconds | Saturated seconds | Saturation percentage |
|---|---|---|---|
| A | 18255 | 1037 | 5.680635% |
| B | 18256 | 662 | 3.626205% |
| C | 18256 | 179 | 0.980500% |
| D | 18255 | 4783 | 26.201041% |
Noise dominated data is calculated using 1-second bins in cleaned event files. If a bin has >2000 counts, and if more than 50% of those come from <1% of pixels, then it is considered to be noise-dominated and hence unusable.
| Quadrant | # 1 sec bins | Bins with >0 counts | Bins with >2000 counts | High rate bins dominated by noise | Noise dominated (total time) | Noise dominated (detector-on time) | Marked lightcurve |
|---|---|---|---|---|---|---|---|
| A | 19765 | 18255 | 529 | 529 | 2.68% | 2.90% | 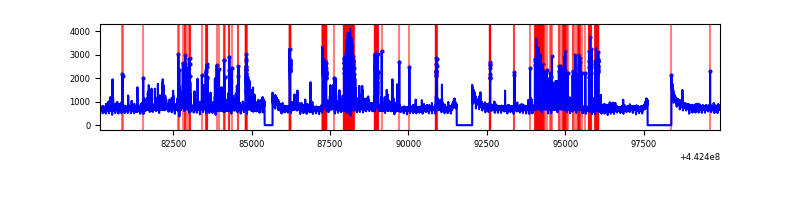 |
| B | 19766 | 18257 | 227 | 227 | 1.15% | 1.24% | 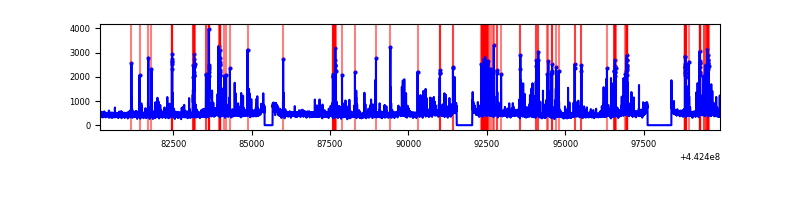 |
| C | 19766 | 18257 | 23 | 23 | 0.12% | 0.13% | 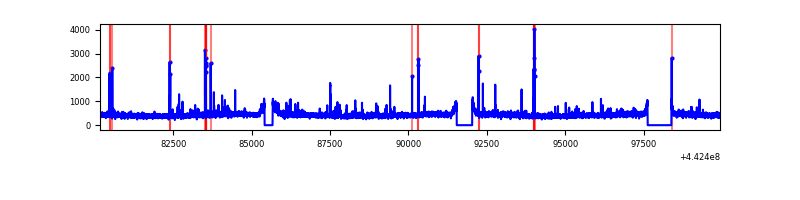 |
| D | 19764 | 18255 | 4250 | 4250 | 21.50% | 23.28% | 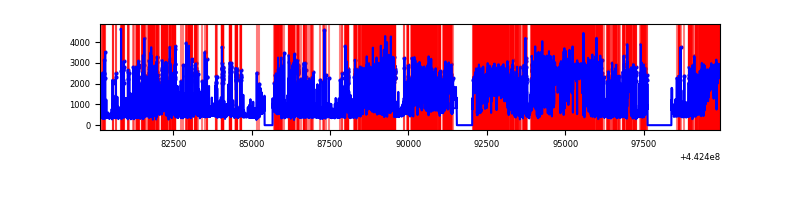 |
Top three noisy pixels from each quadrant. If the there are fewer than three noisy pixels in the level2.evt file, extra rows are filled as -1
| Pixel properties | Quadrant properties | ||||||
|---|---|---|---|---|---|---|---|
| Quadrant | DetID | PixID | Counts | Sigma | Mean | Median | Sigma |
| A | 10 | 83 | 5260145 | 12684.96 | 1995 | 1951 | 414.5 |
| A | 15 | 223 | 1895454 | 4567.92 | 1995 | 1951 | 414.5 |
| A | 13 | 248 | 496027 | 1191.92 | 1995 | 1951 | 414.5 |
| B | 0 | 189 | 771230 | 1954.41 | 1992 | 1928 | 393.6 |
| B | 5 | 255 | 199070 | 500.84 | 1992 | 1928 | 393.6 |
| B | 10 | 245 | 155381 | 389.85 | 1992 | 1928 | 393.6 |
| C | 12 | 2 | 112383 | 238.2 | 1980 | 1990 | 463.4 |
| C | 1 | 3 | 63493 | 132.71 | 1980 | 1990 | 463.4 |
| C | 3 | 233 | 58471 | 121.87 | 1980 | 1990 | 463.4 |
| D | 13 | 187 | 6649398 | 15061.85 | 1770 | 1716 | 441.4 |
| D | 1 | 52 | 4805650 | 10884.42 | 1770 | 1716 | 441.4 |
| D | 5 | 235 | 911103 | 2060.43 | 1770 | 1716 | 441.4 |
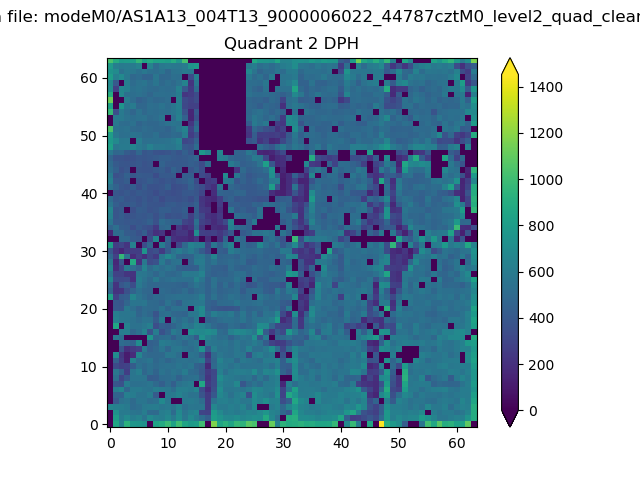
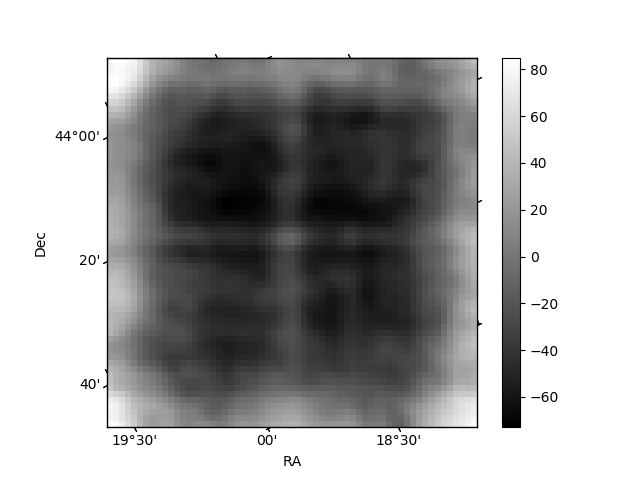
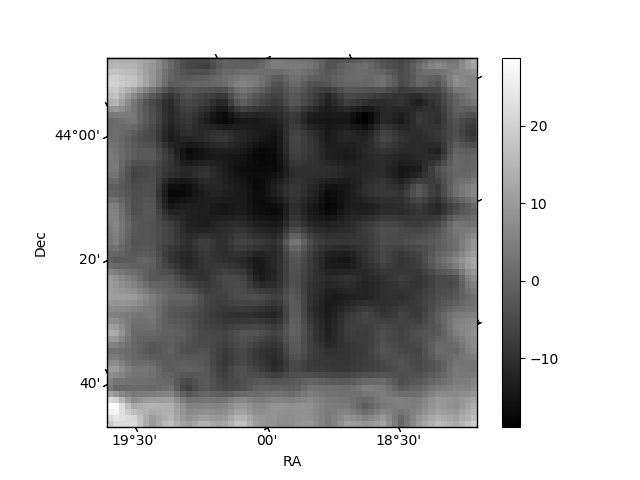
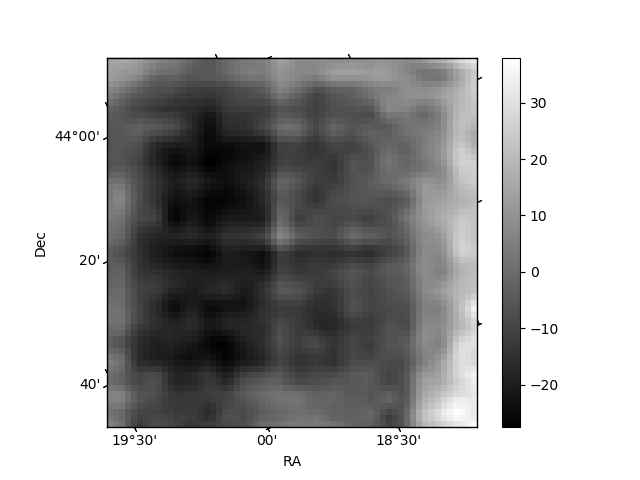
Histogram calculated using DETX and DETY for each event in the final _common_clean file
| Quadrant A | 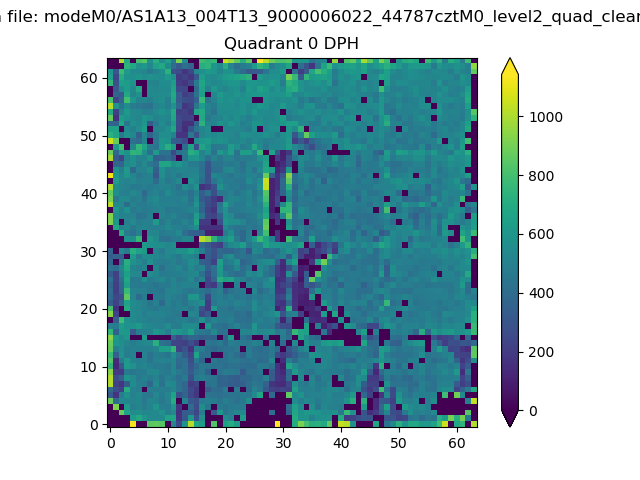 |
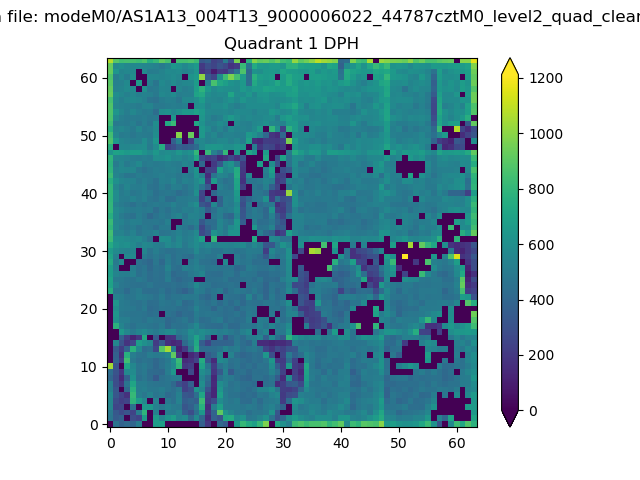 |
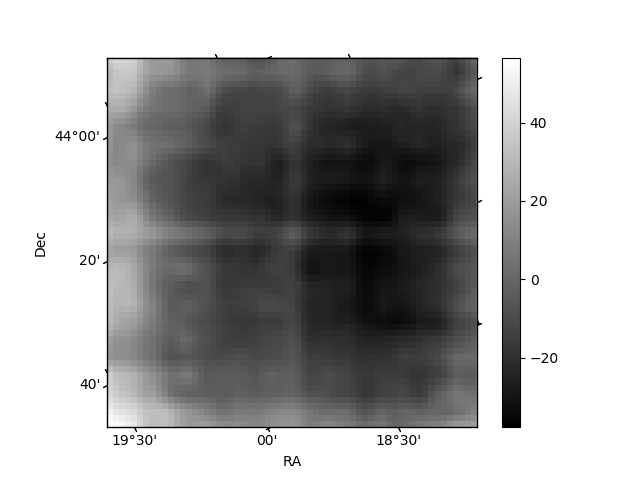
Quadrant B |
|---|---|---|---|
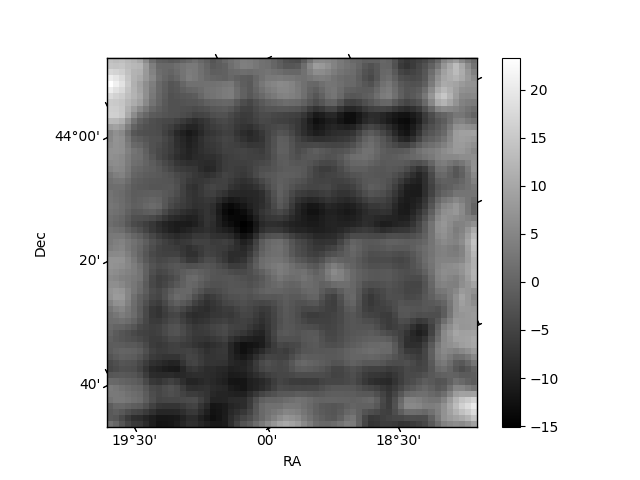
| Quadrant D | 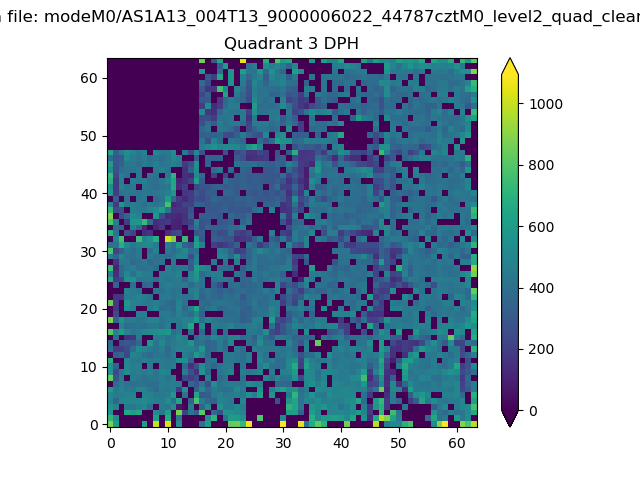 |
 |
Quadrant C |
| Plot type | Count rate plots | Images |
|---|---|---|
| Comparison with Poisson distribution Blue bars denote a histogram of data divided into 1 sec bins. Red curve is a Poisson curve with rate = median count rate of data. |
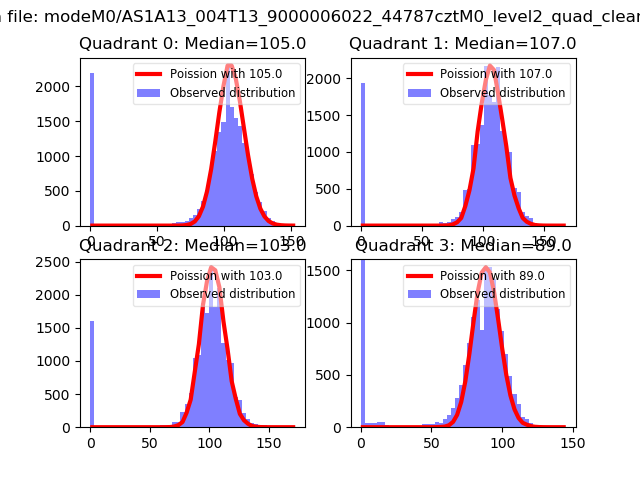 |
 |
| Quadrant-wise count rates Data is divided into 100 sec bins |
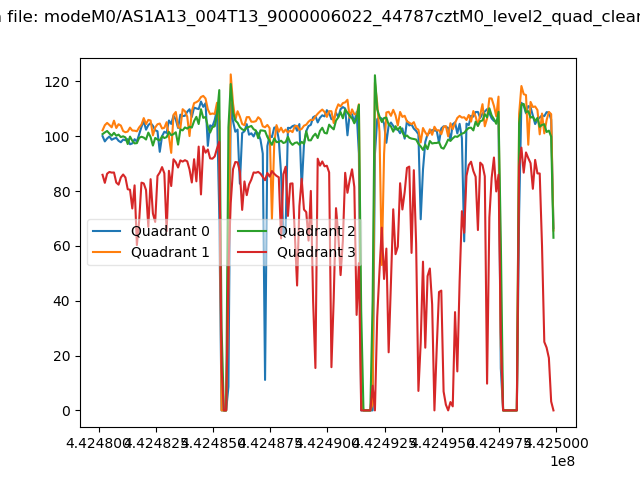 |
|
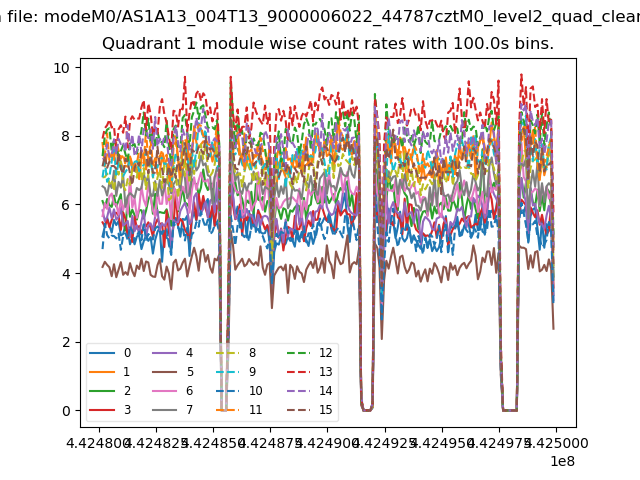
| Module-wise count rates for Quadrant A Data is divided into 100 sec bins |
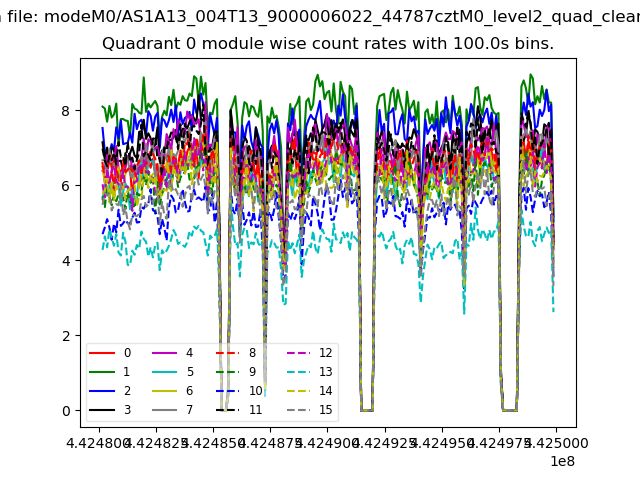 |
 |
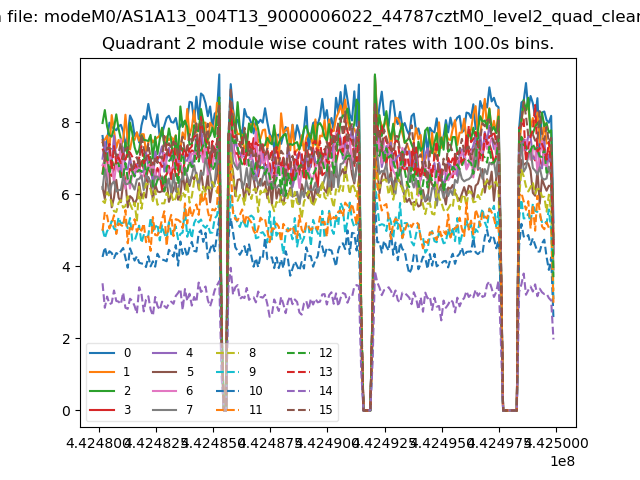
| Module-wise count rates for Quadrant B Data is divided into 100 sec bins |
 |
 |
| Module-wise count rates for Quadrant C Data is divided into 100 sec bins |
 |
 |
| Module-wise count rates for Quadrant D Data is divided into 100 sec bins |
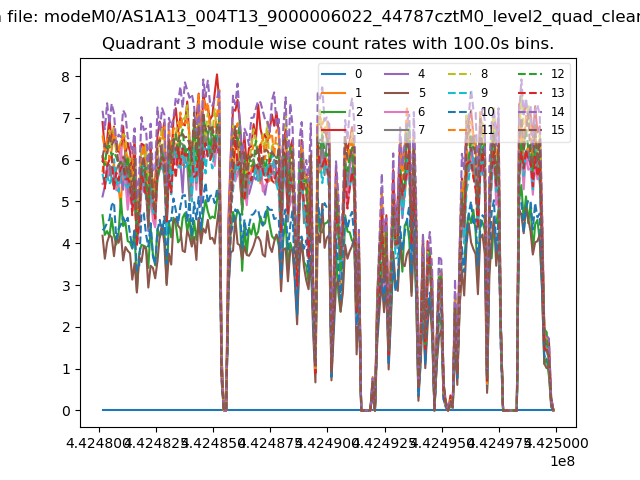 |
 |
| Parameter | Plot |
|---|---|
| CZT HV Monitor | 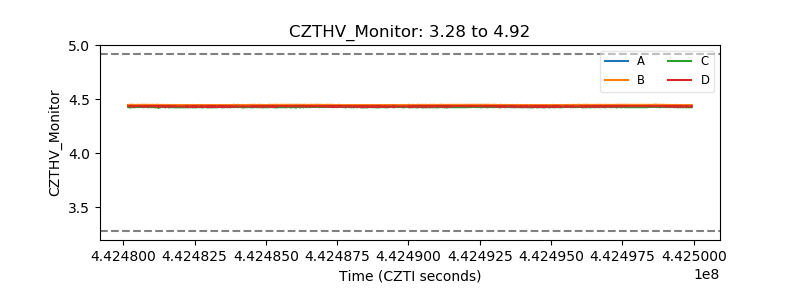 |
| D_VDD | 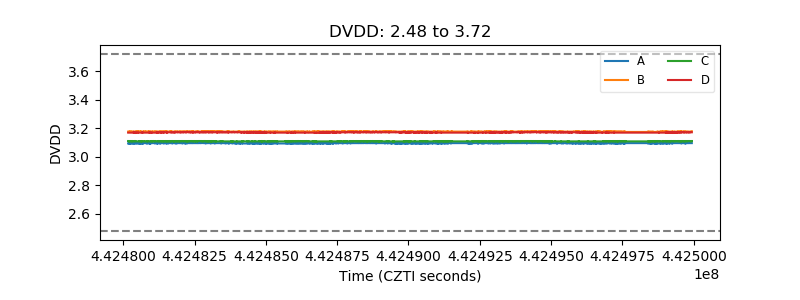 |
| Temperature 1 | 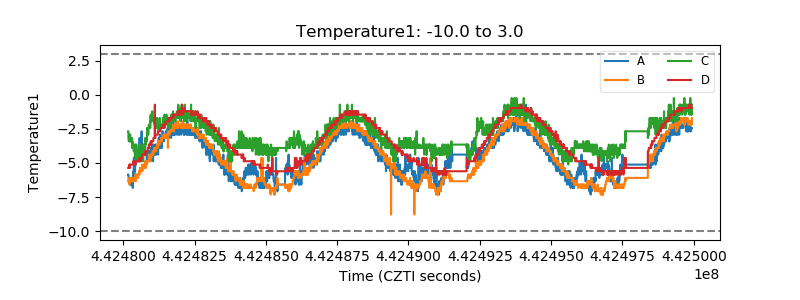 |
| Veto HV Monitor | 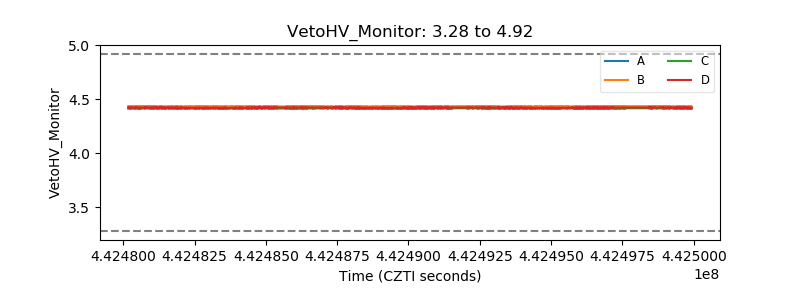 |
| Veto LLD | 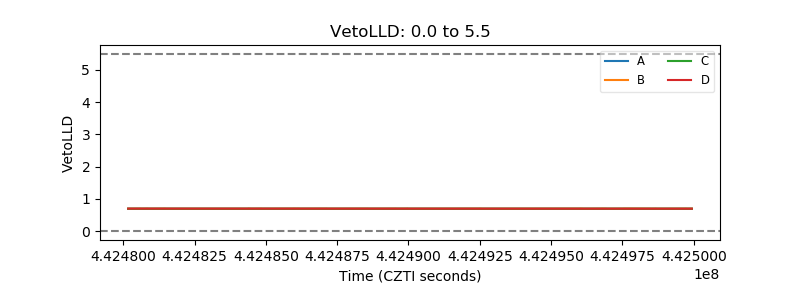 |
| Alpha Counter | 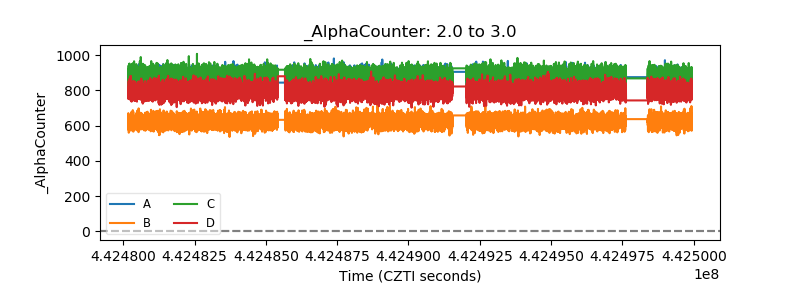 |
| _CPM_Rate | 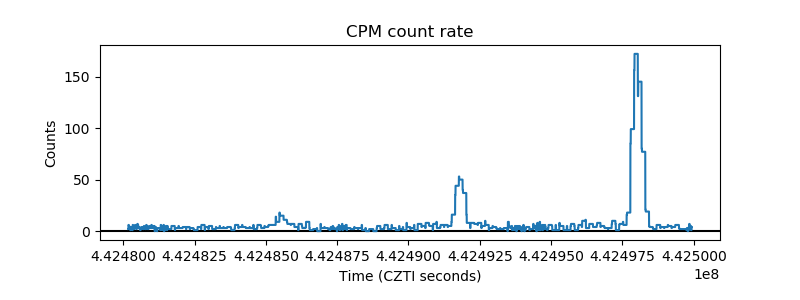 |
| CZT Counter | 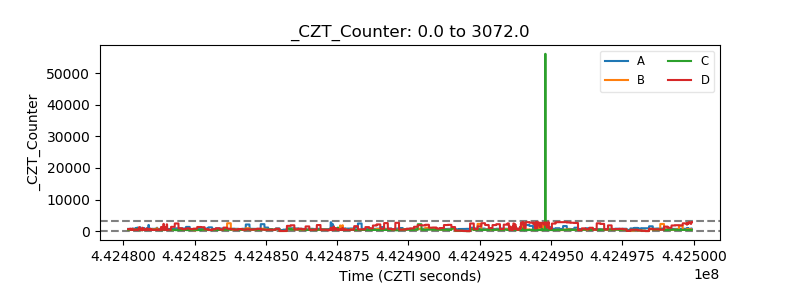 |
| +2.5 Volts monitor | 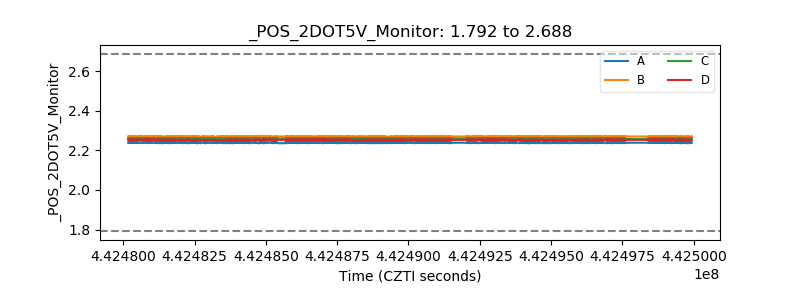 |
| +5 Volts monitor | 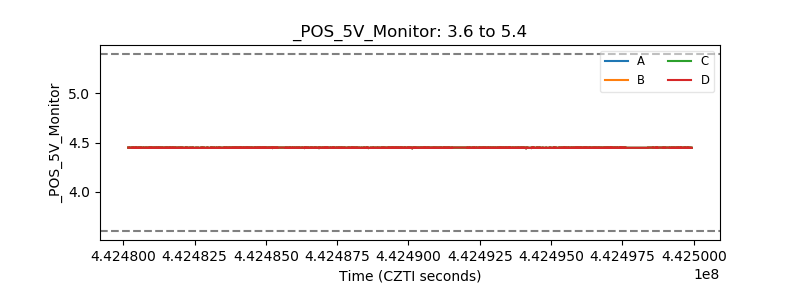 |
| _ROLL_ROT | 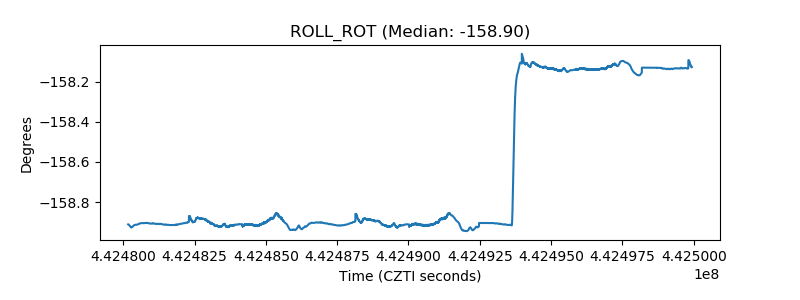 |
| _Roll_DEC | 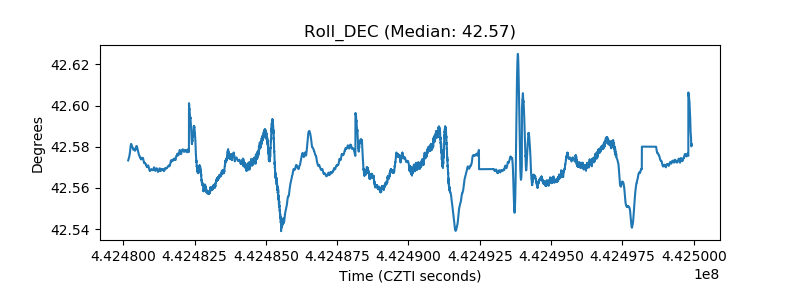 |
| _Roll_RA | 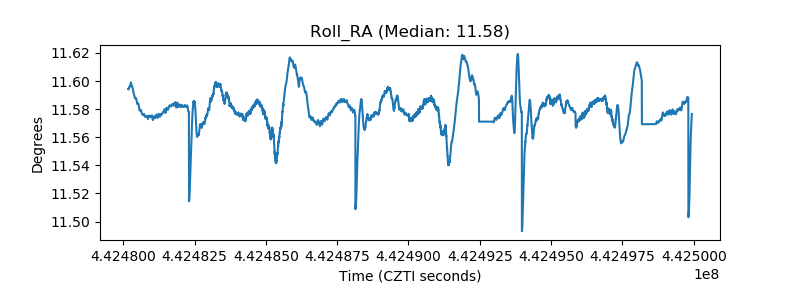 |
| Veto Counter | 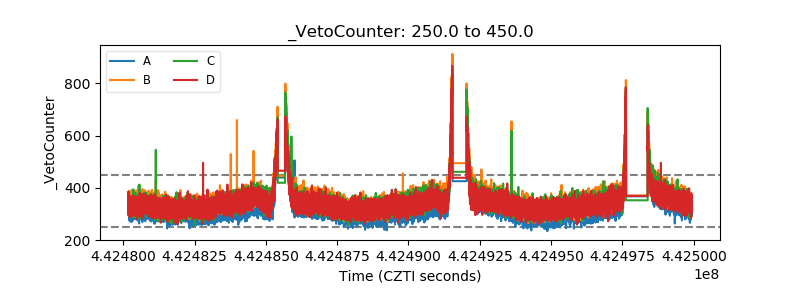 |