| Param | Original file | Final file |
|---|---|---|
| Filename | modeM0/AS1A13_004T13_9000006022_44788cztM0_level2.fits | modeM0/AS1A13_004T13_9000006022_44788cztM0_level2_quad_clean.evt |
| Size (bytes) | 507,090,240 | 101,275,200 |
| Size | 483.6 MB | 96.6 MB |
| Events in quadrant A | 5,112,814 | 690,546 |
| Events in quadrant B | 3,826,580 | 691,260 |
| Events in quadrant C | 2,812,479 | 686,489 |
| Events in quadrant D | 6,512,621 | 543,714 |
| Mode M9 | |||
|---|---|---|---|
| Quadrant | BADHDUFLAG | Total packets | Discarded packets |
| A | 0 | 10 | 0 |
| B | 0 | 10 | 0 |
| C | 0 | 10 | 0 |
| D | 0 | 10 | 0 |
| Mode M0 | |||
|---|---|---|---|
| Quadrant | BADHDUFLAG | Total packets | Discarded packets |
| A | 0 | 20585 | 1 |
| B | 0 | 15872 | 1 |
| C | 0 | 13327 | 1 |
| D | 0 | 23711 | 1 |
| Mode SS | |||
|---|---|---|---|
| Quadrant | BADHDUFLAG | Total packets | Discarded packets |
| A | 0 | 130 | 0 |
| B | 0 | 130 | 0 |
| C | 0 | 130 | 0 |
| D | 0 | 130 | 0 |
| Quadrant | Total seconds | Saturated seconds | Saturation percentage |
|---|---|---|---|
| A | 6519 | 196 | 3.006596% |
| B | 6520 | 296 | 4.539877% |
| C | 6520 | 37 | 0.567485% |
| D | 6520 | 1089 | 16.702454% |
Noise dominated data is calculated using 1-second bins in cleaned event files. If a bin has >2000 counts, and if more than 50% of those come from <1% of pixels, then it is considered to be noise-dominated and hence unusable.
| Quadrant | # 1 sec bins | Bins with >0 counts | Bins with >2000 counts | High rate bins dominated by noise | Noise dominated (total time) | Noise dominated (detector-on time) | Marked lightcurve |
|---|---|---|---|---|---|---|---|
| A | 7429 | 6519 | 64 | 64 | 0.86% | 0.98% | 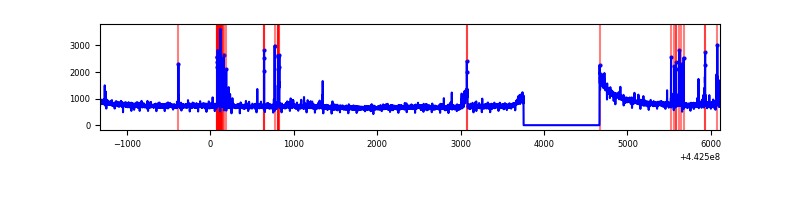 |
| B | 7430 | 6520 | 185 | 185 | 2.49% | 2.84% | 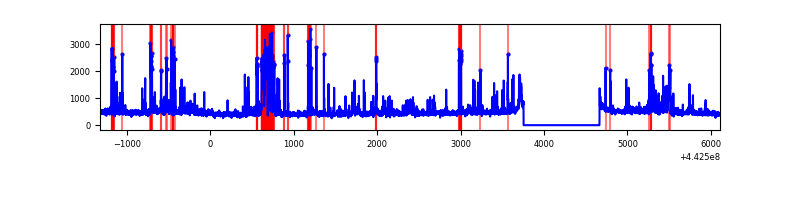 |
| C | 7430 | 6520 | 1 | 1 | 0.01% | 0.02% | 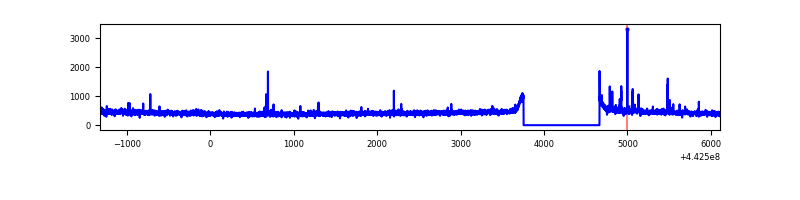 |
| D | 7430 | 6520 | 977 | 977 | 13.15% | 14.98% | 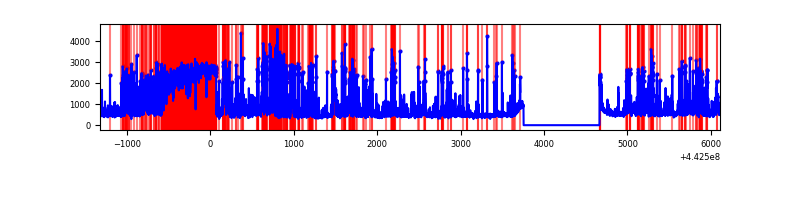 |
Top three noisy pixels from each quadrant. If the there are fewer than three noisy pixels in the level2.evt file, extra rows are filled as -1
| Pixel properties | Quadrant properties | ||||||
|---|---|---|---|---|---|---|---|
| Quadrant | DetID | PixID | Counts | Sigma | Mean | Median | Sigma |
| A | 10 | 83 | 1997443 | 13293.04 | 717 | 702 | 150.2 |
| A | 15 | 223 | 245250 | 1628.05 | 717 | 702 | 150.2 |
| A | 13 | 248 | 74200 | 489.3 | 717 | 702 | 150.2 |
| B | 0 | 189 | 408325 | 2946.04 | 704 | 682 | 138.4 |
| B | 5 | 255 | 257067 | 1852.9 | 704 | 682 | 138.4 |
| B | 10 | 245 | 84789 | 607.84 | 704 | 682 | 138.4 |
| C | 11 | 16 | 23084 | 135.28 | 705 | 710 | 165.4 |
| C | 2 | 14 | 14607 | 84.02 | 705 | 710 | 165.4 |
| C | 12 | 2 | 9163 | 51.11 | 705 | 710 | 165.4 |
| D | 13 | 187 | 1566307 | 9308.37 | 665 | 644 | 168.2 |
| D | 5 | 235 | 688012 | 4086.63 | 665 | 644 | 168.2 |
| D | 13 | 249 | 552022 | 3278.12 | 665 | 644 | 168.2 |
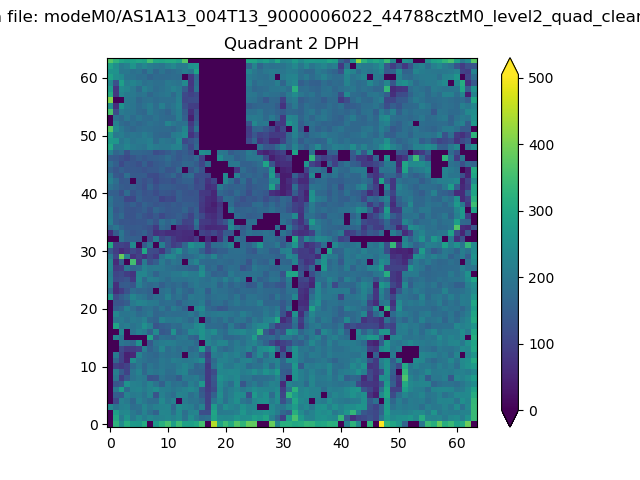
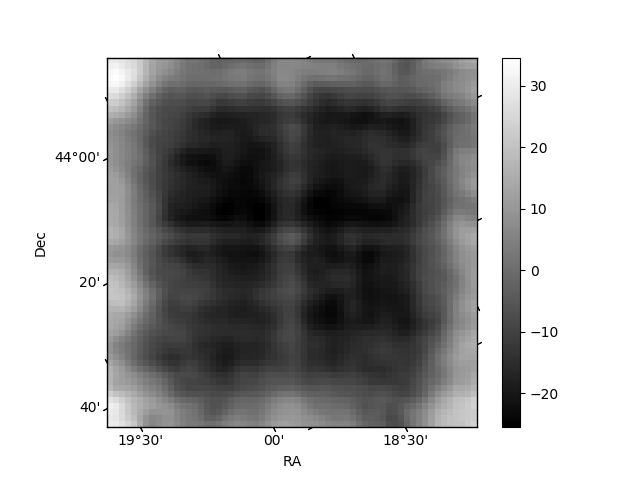
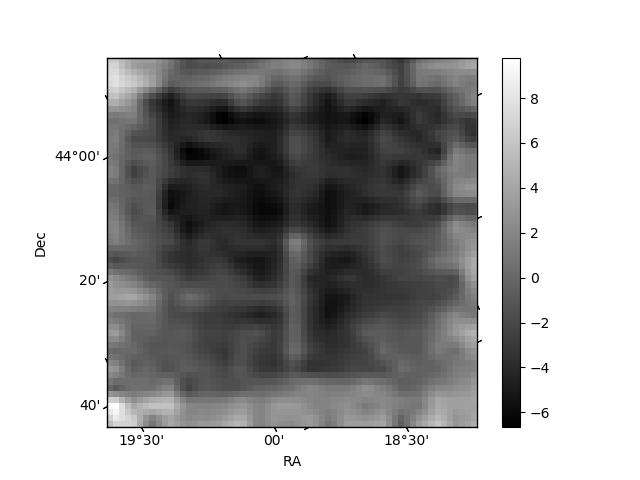
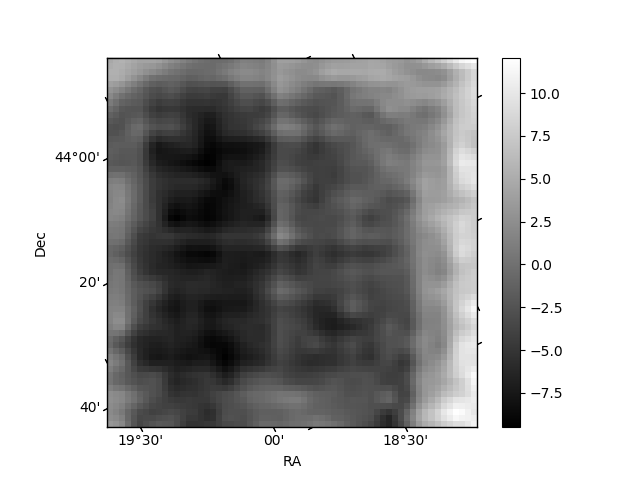
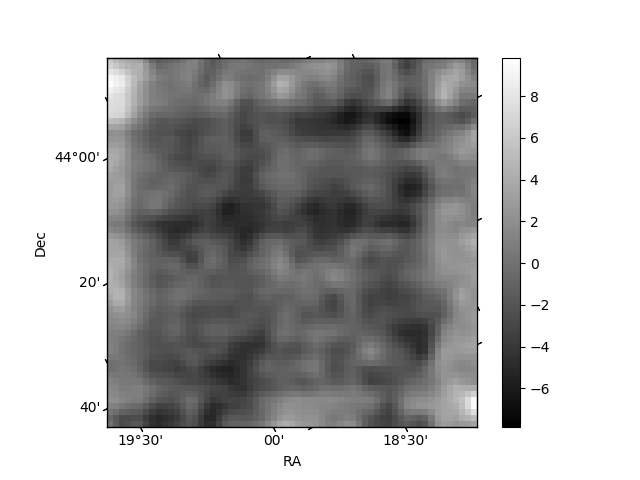
Histogram calculated using DETX and DETY for each event in the final _common_clean file
| Quadrant A | 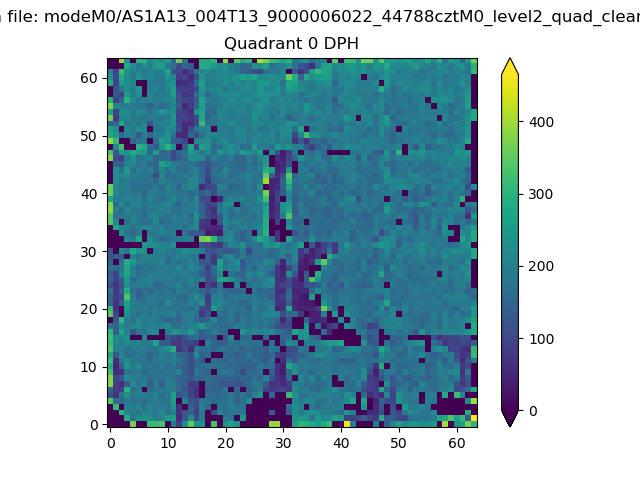 |
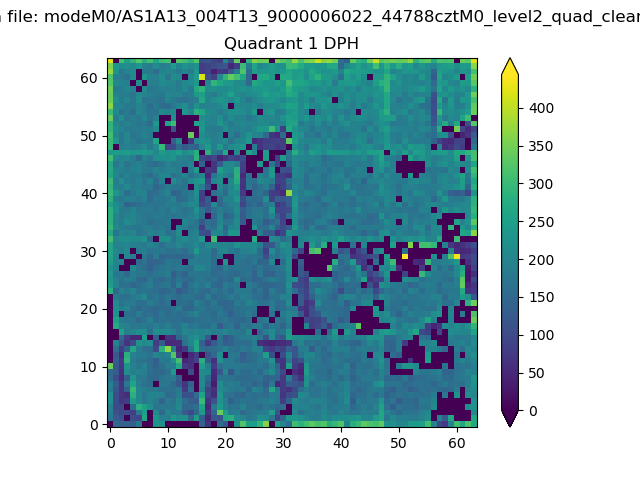 |
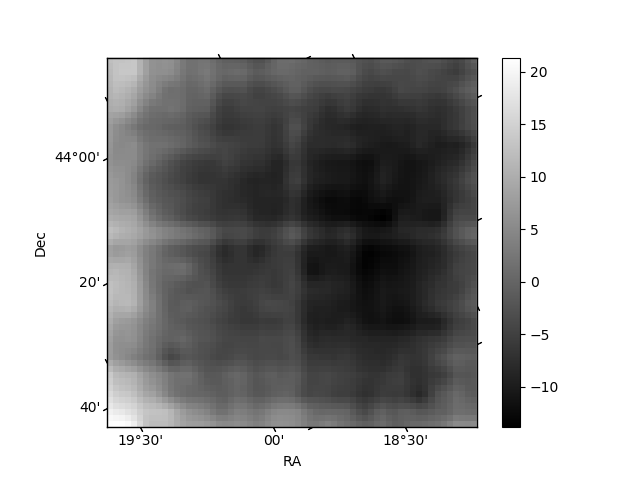
Quadrant B |
|---|---|---|---|
| Quadrant D | 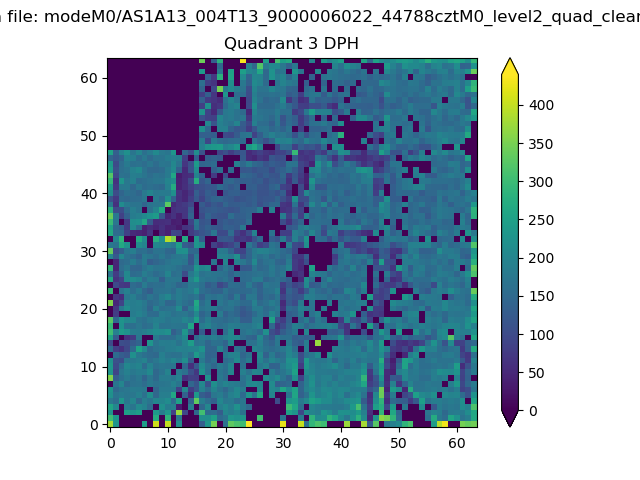 |
 |
Quadrant C |
| Plot type | Count rate plots | Images |
|---|---|---|
| Comparison with Poisson distribution Blue bars denote a histogram of data divided into 1 sec bins. Red curve is a Poisson curve with rate = median count rate of data. |
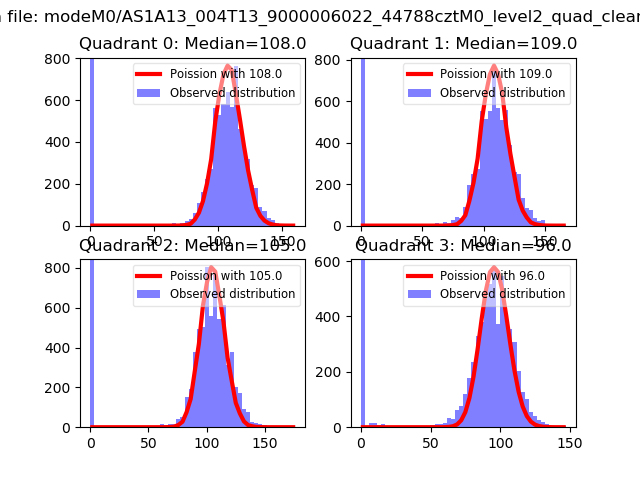 |
 |
| Quadrant-wise count rates Data is divided into 100 sec bins |
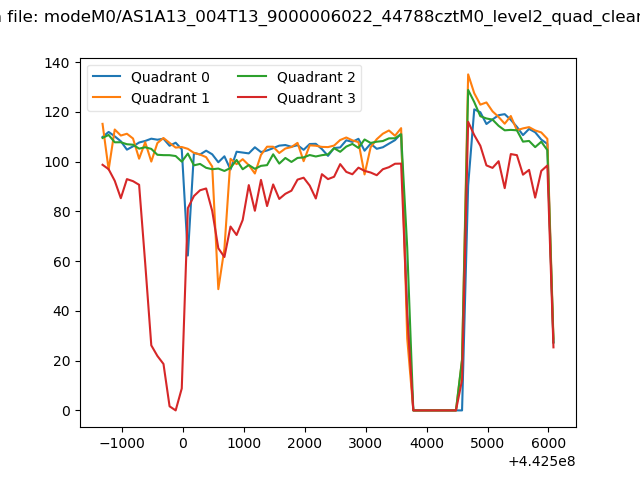 |
|
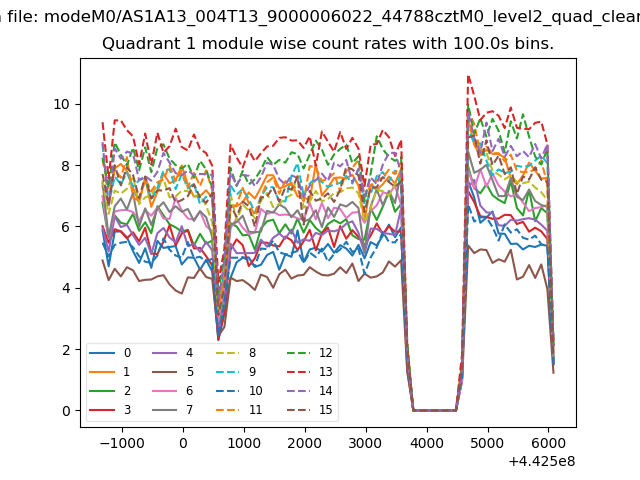
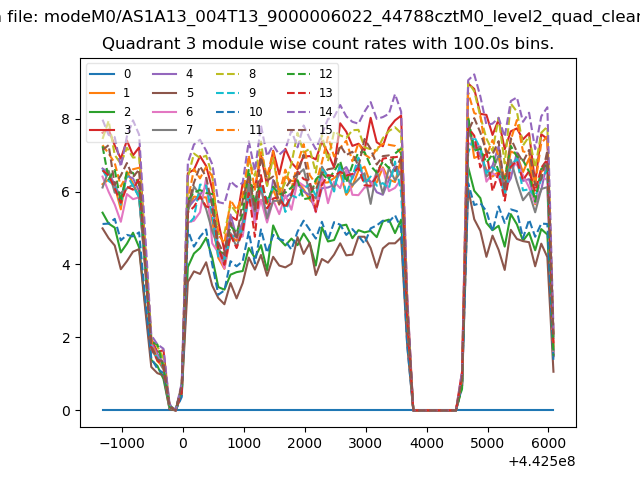
| Module-wise count rates for Quadrant A Data is divided into 100 sec bins |
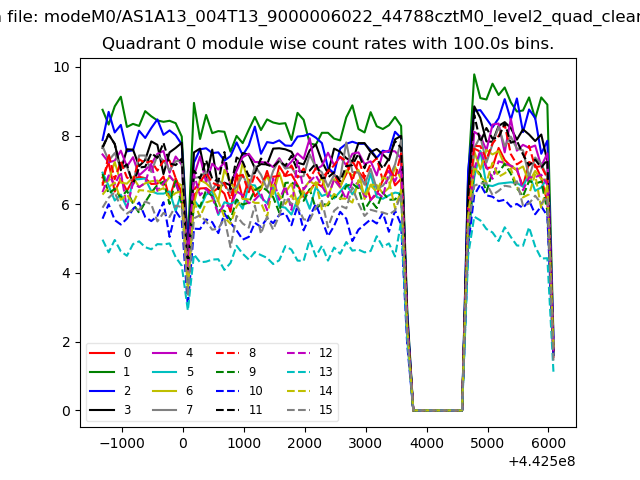 |
 |
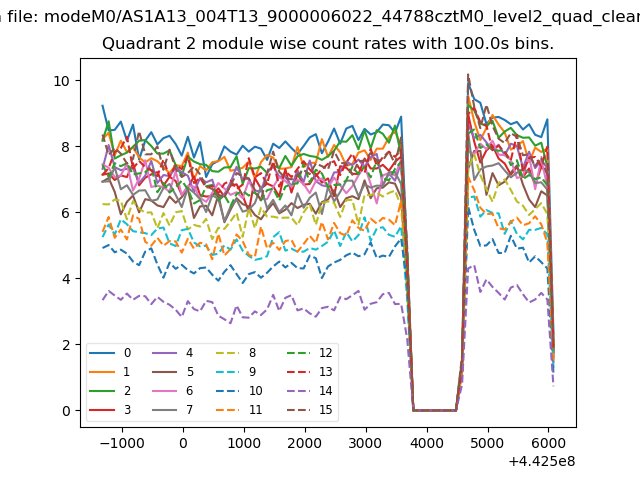
| Module-wise count rates for Quadrant B Data is divided into 100 sec bins |
 |
 |
| Module-wise count rates for Quadrant C Data is divided into 100 sec bins |
 |
 |
| Module-wise count rates for Quadrant D Data is divided into 100 sec bins |
 |
 |
| Parameter | Plot |
|---|---|
| CZT HV Monitor | 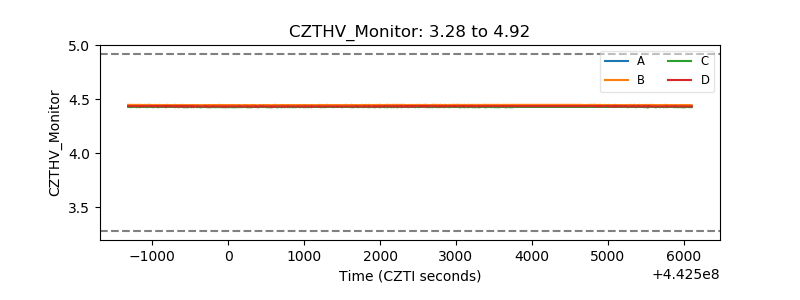 |
| D_VDD | 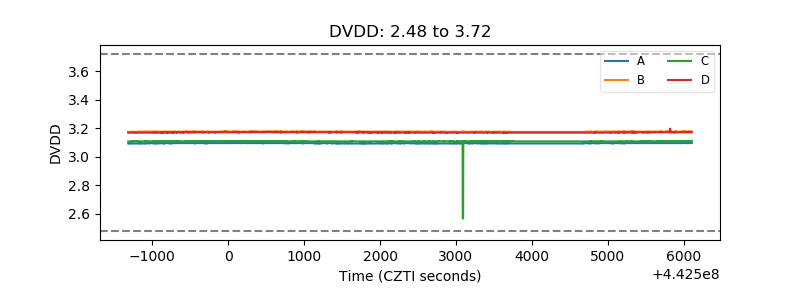 |
| Temperature 1 | 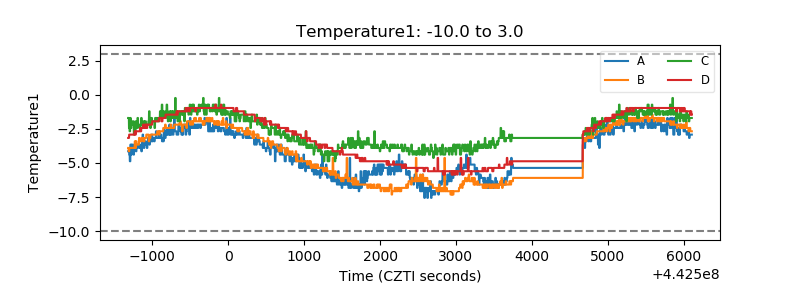 |
| Veto HV Monitor | 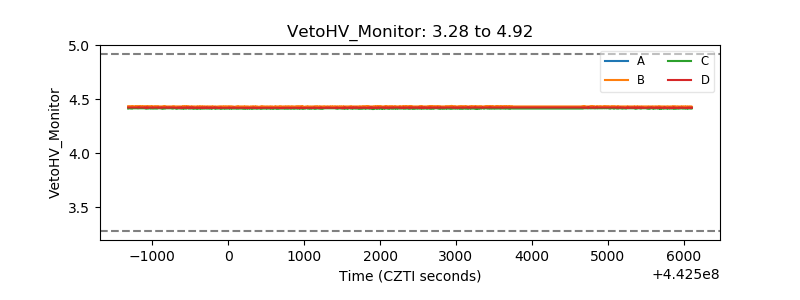 |
| Veto LLD | 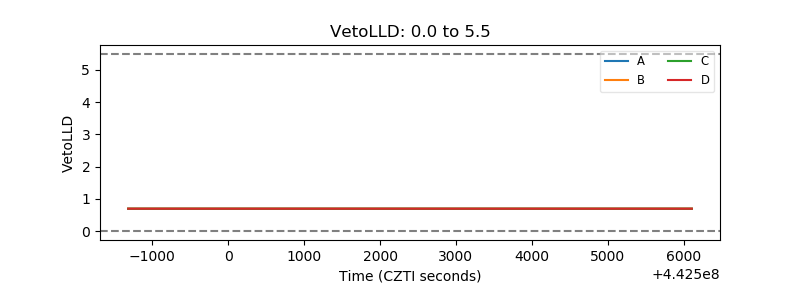 |
| Alpha Counter | 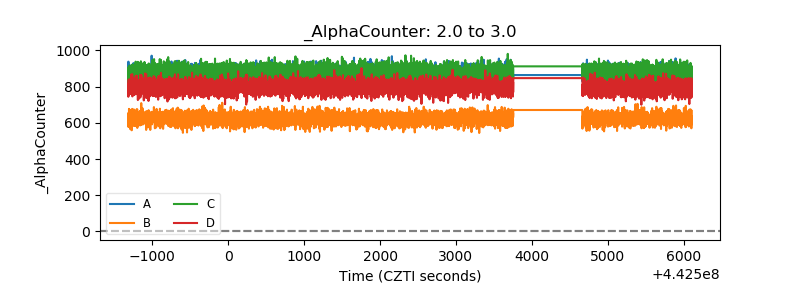 |
| _CPM_Rate | 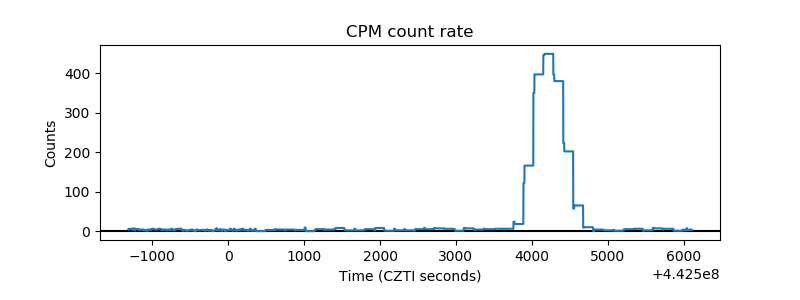 |
| CZT Counter | 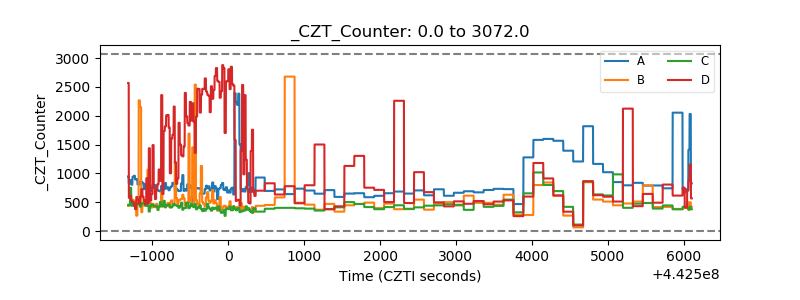 |
| +2.5 Volts monitor | 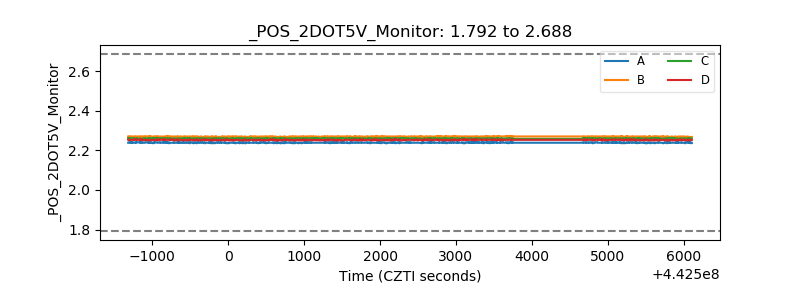 |
| +5 Volts monitor | 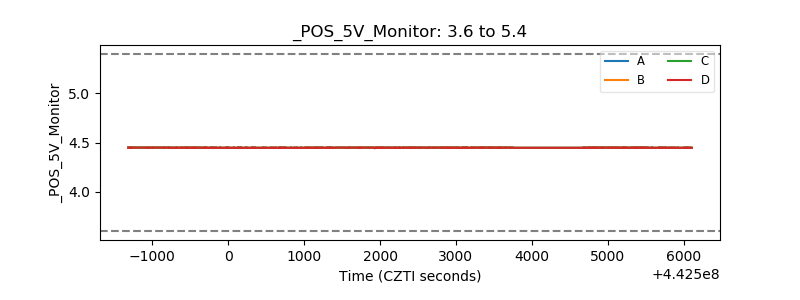 |
| _ROLL_ROT | 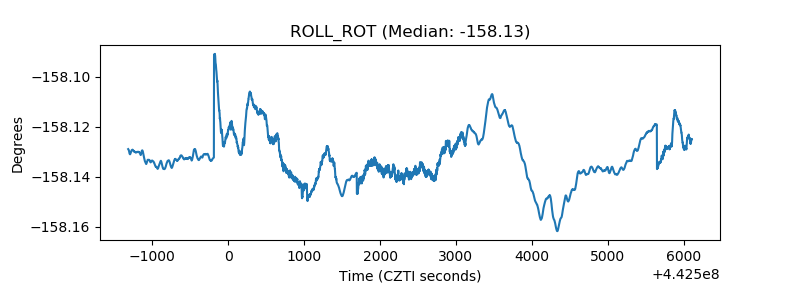 |
| _Roll_DEC |  |
| _Roll_RA | 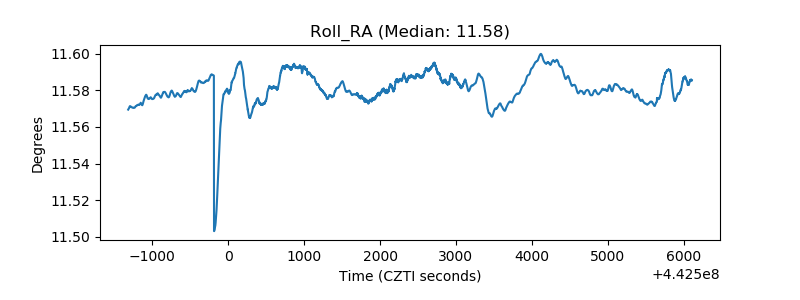 |
| Veto Counter | 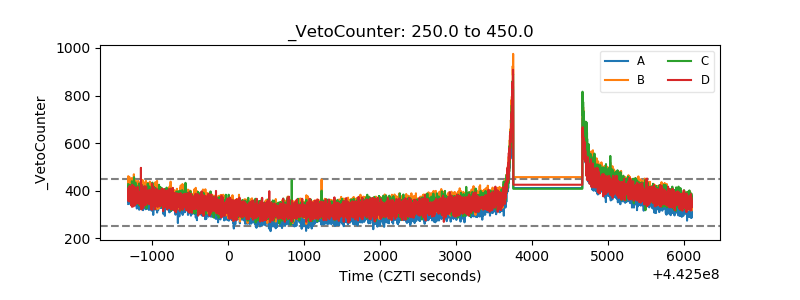 |