| Param | Original file | Final file |
|---|---|---|
| Filename | modeM0/AS1A13_004T13_9000006022_44791cztM0_level2.fits | modeM0/AS1A13_004T13_9000006022_44791cztM0_level2_quad_clean.evt |
| Size (bytes) | 551,246,400 | 99,460,800 |
| Size | 525.7 MB | 94.9 MB |
| Events in quadrant A | 6,629,307 | 632,520 |
| Events in quadrant B | 4,272,826 | 691,369 |
| Events in quadrant C | 3,029,299 | 682,509 |
| Events in quadrant D | 6,002,822 | 581,054 |
| Mode M9 | |||
|---|---|---|---|
| Quadrant | BADHDUFLAG | Total packets | Discarded packets |
| A | 0 | 12 | 0 |
| B | 0 | 12 | 0 |
| C | 0 | 12 | 0 |
| D | 0 | 12 | 0 |
| Mode M0 | |||
|---|---|---|---|
| Quadrant | BADHDUFLAG | Total packets | Discarded packets |
| A | 0 | 24105 | 1 |
| B | 0 | 16797 | 2 |
| C | 0 | 13342 | 1 |
| D | 0 | 21936 | 1 |
| Mode SS | |||
|---|---|---|---|
| Quadrant | BADHDUFLAG | Total packets | Discarded packets |
| A | 0 | 122 | 0 |
| B | 0 | 122 | 0 |
| C | 0 | 122 | 0 |
| D | 0 | 122 | 0 |
| Quadrant | Total seconds | Saturated seconds | Saturation percentage |
|---|---|---|---|
| A | 6080 | 803 | 13.207237% |
| B | 6079 | 318 | 5.231124% |
| C | 6079 | 87 | 1.431156% |
| D | 6079 | 654 | 10.758348% |
Noise dominated data is calculated using 1-second bins in cleaned event files. If a bin has >2000 counts, and if more than 50% of those come from <1% of pixels, then it is considered to be noise-dominated and hence unusable.
| Quadrant | # 1 sec bins | Bins with >0 counts | Bins with >2000 counts | High rate bins dominated by noise | Noise dominated (total time) | Noise dominated (detector-on time) | Marked lightcurve |
|---|---|---|---|---|---|---|---|
| A | 7255 | 6081 | 608 | 608 | 8.38% | 10.00% | 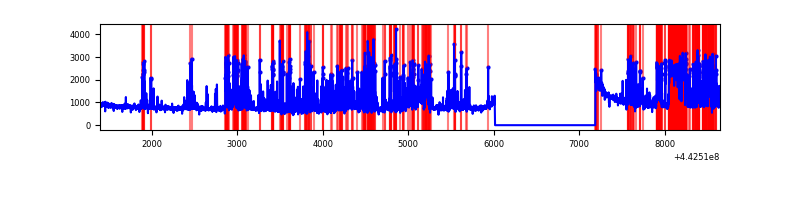 |
| B | 7254 | 6080 | 254 | 254 | 3.50% | 4.18% | 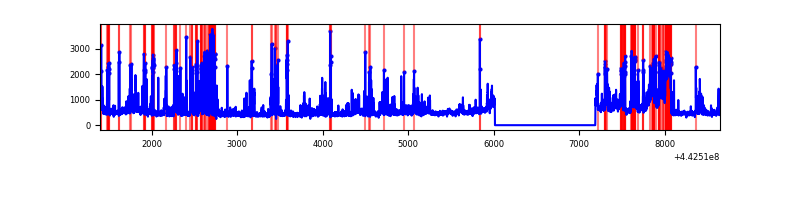 |
| C | 7254 | 6080 | 72 | 72 | 0.99% | 1.18% | 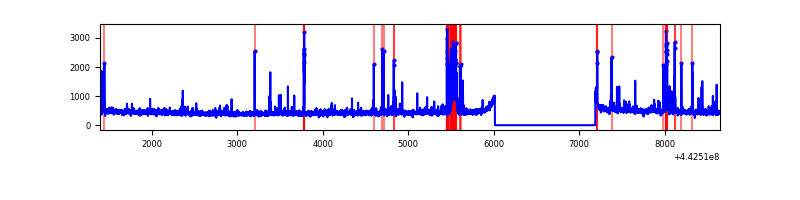 |
| D | 7254 | 6080 | 625 | 625 | 8.62% | 10.28% | 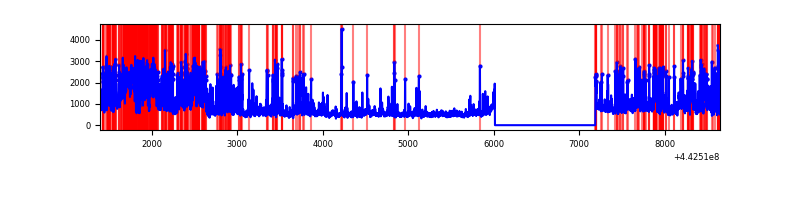 |
Top three noisy pixels from each quadrant. If the there are fewer than three noisy pixels in the level2.evt file, extra rows are filled as -1
| Pixel properties | Quadrant properties | ||||||
|---|---|---|---|---|---|---|---|
| Quadrant | DetID | PixID | Counts | Sigma | Mean | Median | Sigma |
| A | 10 | 83 | 1857359 | 14025.29 | 646 | 632 | 132.4 |
| A | 15 | 223 | 1774232 | 13397.37 | 646 | 632 | 132.4 |
| A | 13 | 248 | 395059 | 2979.41 | 646 | 632 | 132.4 |
| B | 0 | 189 | 904093 | 6939.29 | 670 | 650 | 130.2 |
| B | 5 | 255 | 422158 | 3237.58 | 670 | 650 | 130.2 |
| B | 0 | 190 | 92482 | 705.36 | 670 | 650 | 130.2 |
| C | 14 | 254 | 329855 | 2091.76 | 673 | 677 | 157.4 |
| C | 1 | 3 | 32766 | 203.91 | 673 | 677 | 157.4 |
| C | 12 | 250 | 11356 | 67.86 | 673 | 677 | 157.4 |
| D | 13 | 249 | 1202706 | 7456.87 | 651 | 632 | 161.2 |
| D | 11 | 241 | 608838 | 3772.91 | 651 | 632 | 161.2 |
| D | 1 | 52 | 545557 | 3380.35 | 651 | 632 | 161.2 |
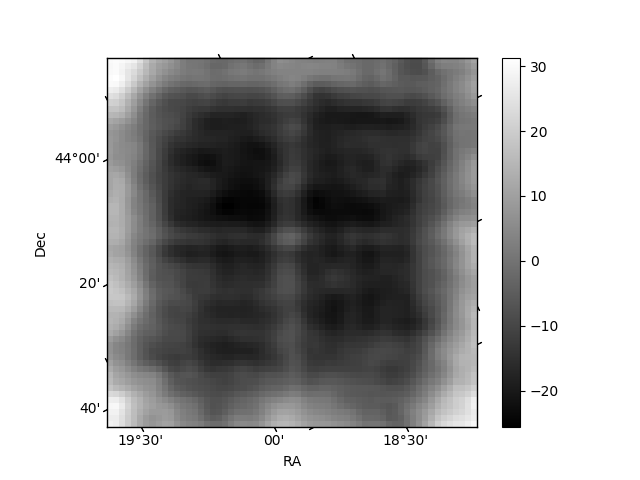
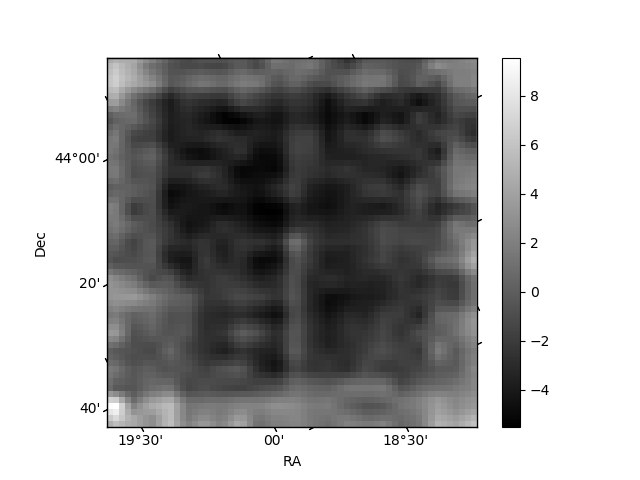
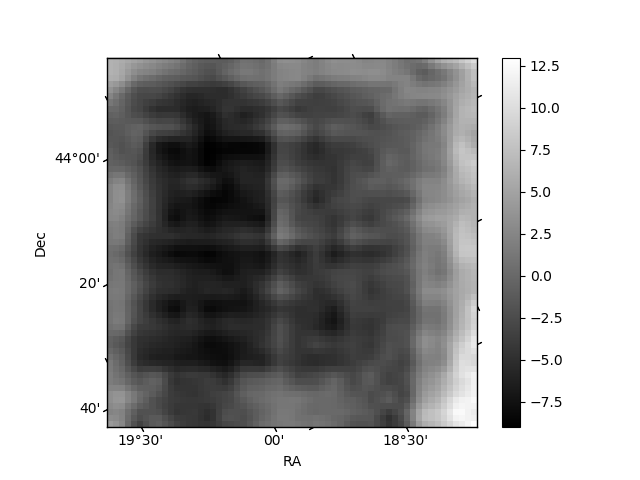
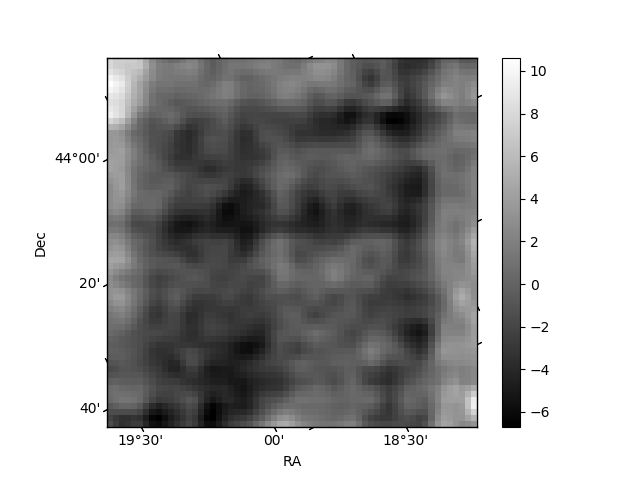
Histogram calculated using DETX and DETY for each event in the final _common_clean file
| Quadrant A | 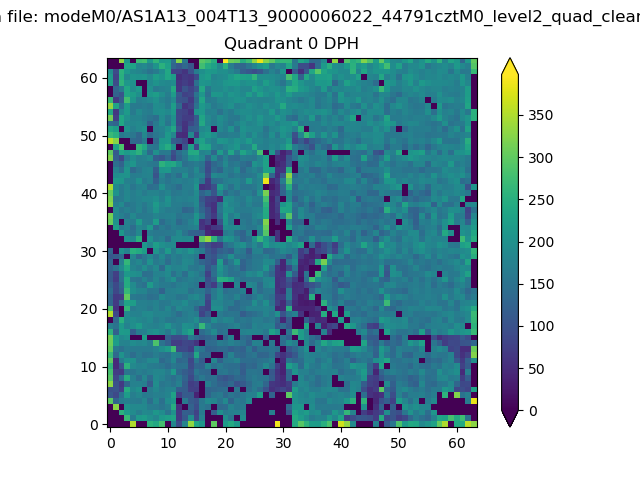 |
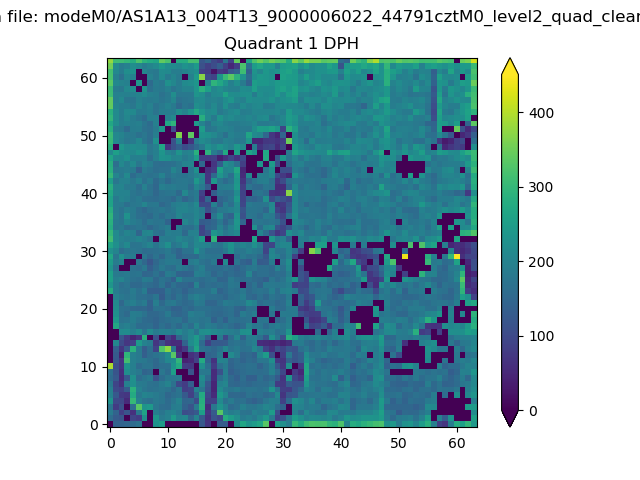 |
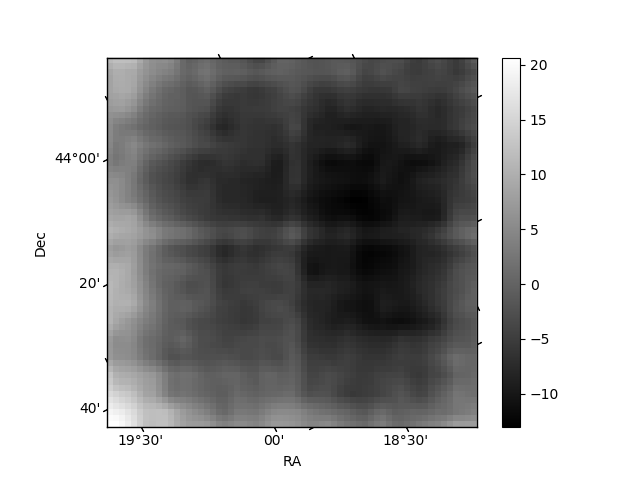
Quadrant B |
|---|---|---|---|
| Quadrant D | 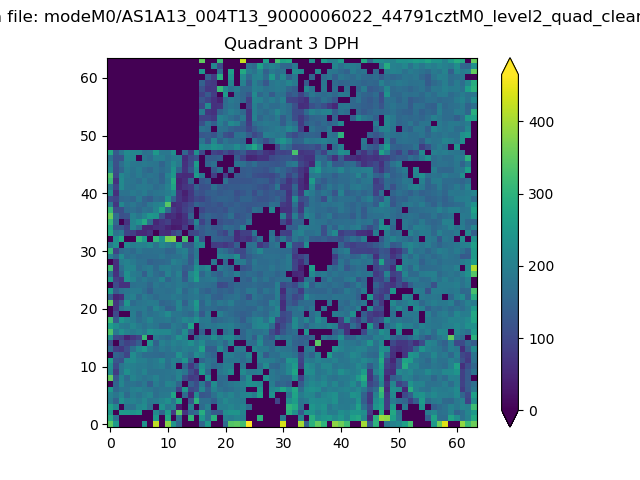 |
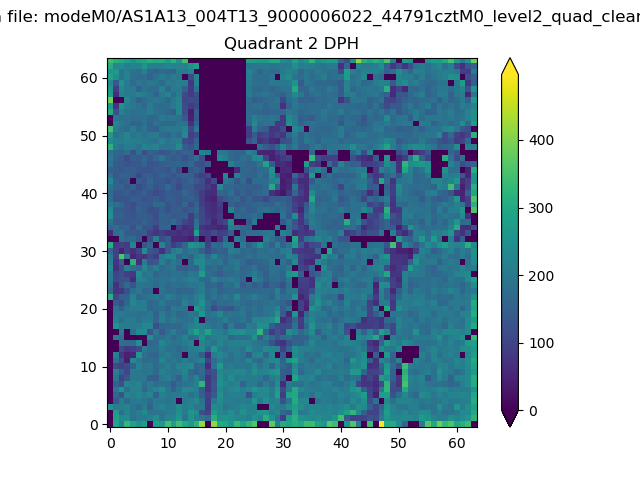 |
Quadrant C |
| Plot type | Count rate plots | Images |
|---|---|---|
| Comparison with Poisson distribution Blue bars denote a histogram of data divided into 1 sec bins. Red curve is a Poisson curve with rate = median count rate of data. |
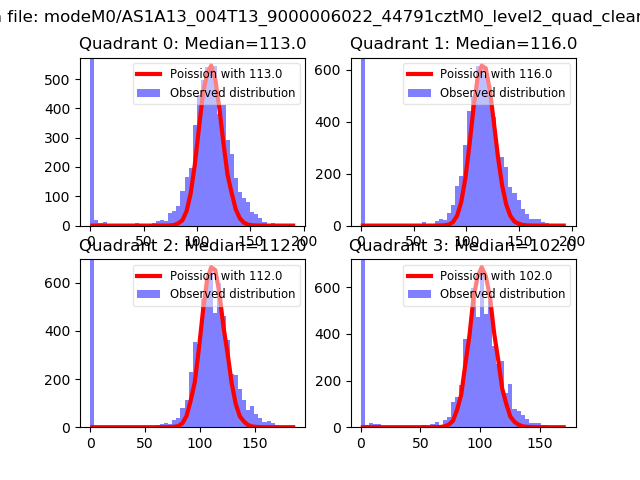 |
 |
| Quadrant-wise count rates Data is divided into 100 sec bins |
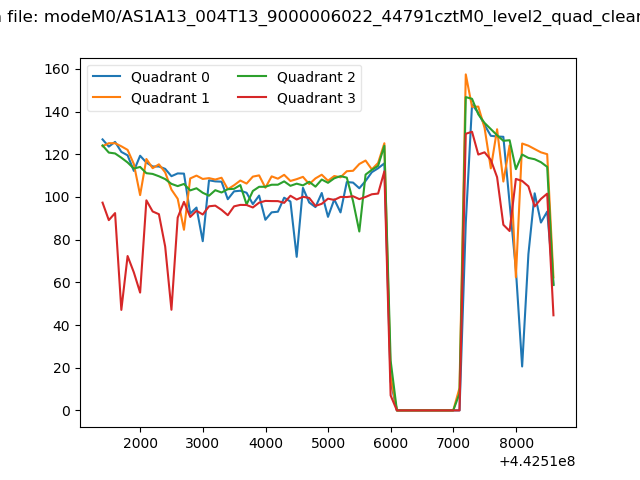 |
|
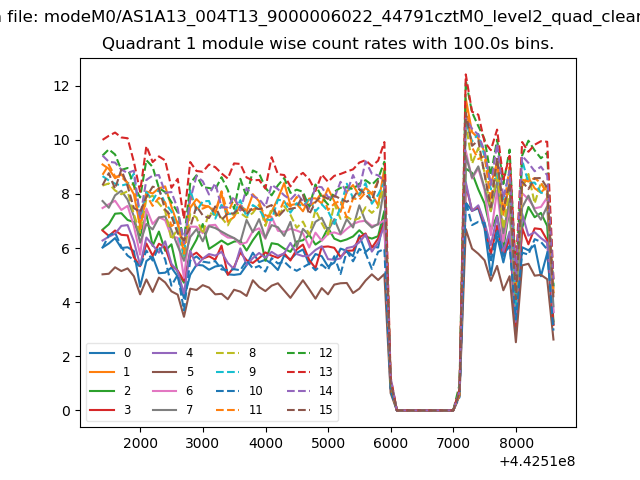
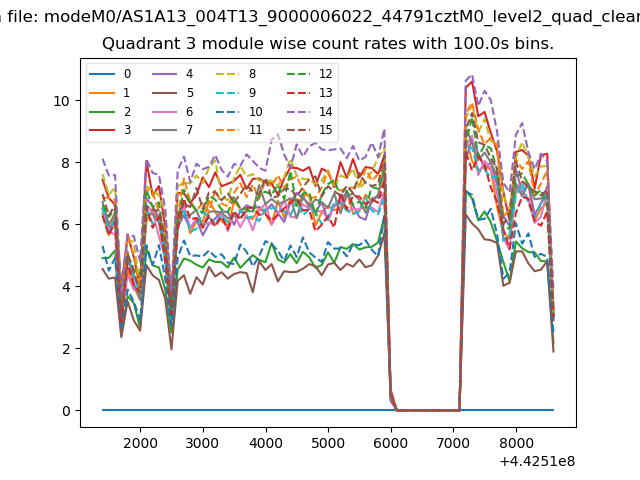
| Module-wise count rates for Quadrant A Data is divided into 100 sec bins |
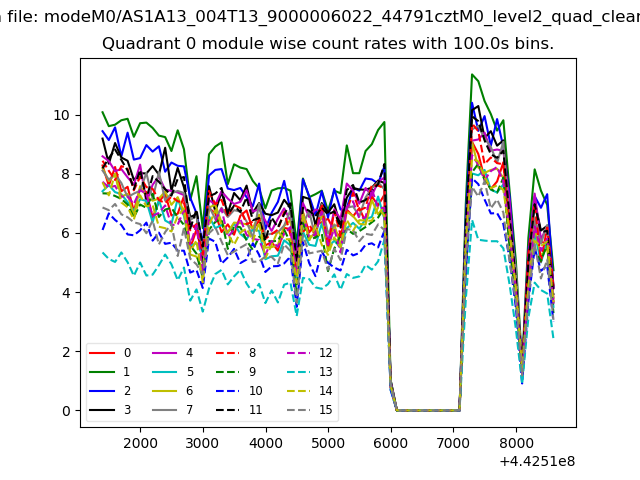 |
 |
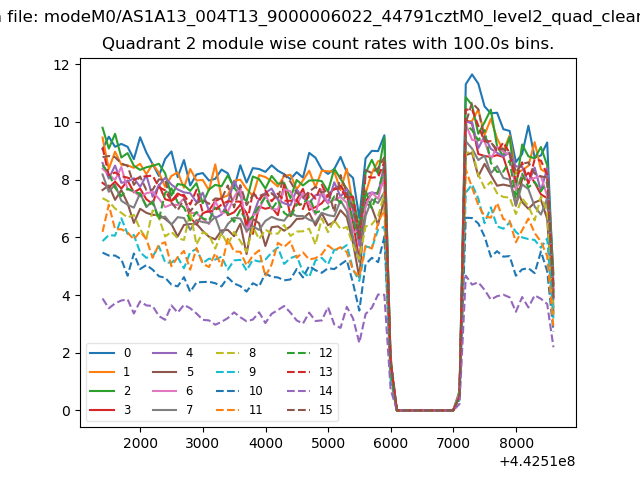
| Module-wise count rates for Quadrant B Data is divided into 100 sec bins |
 |
 |
| Module-wise count rates for Quadrant C Data is divided into 100 sec bins |
 |
 |
| Module-wise count rates for Quadrant D Data is divided into 100 sec bins |
 |
 |
| Parameter | Plot |
|---|---|
| CZT HV Monitor | 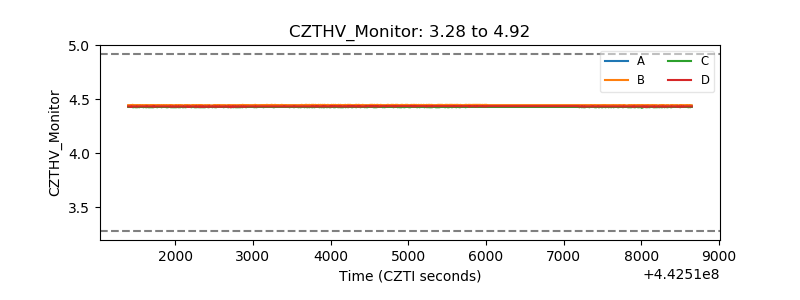 |
| D_VDD | 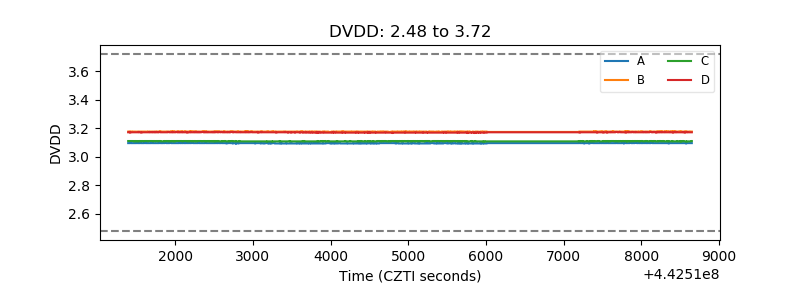 |
| Temperature 1 | 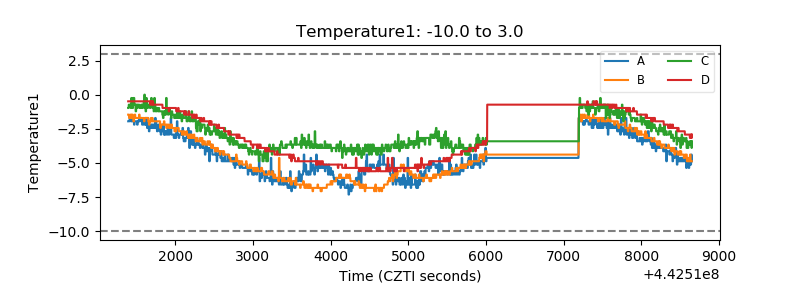 |
| Veto HV Monitor | 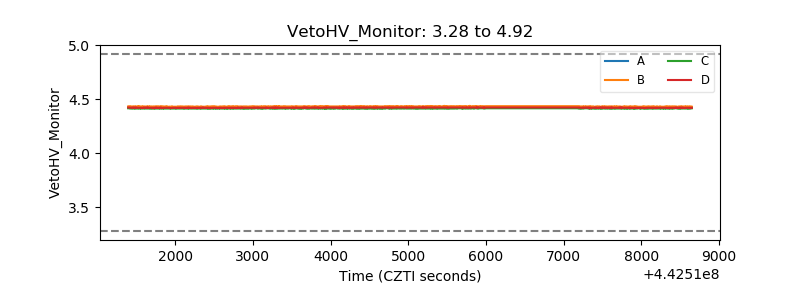 |
| Veto LLD | 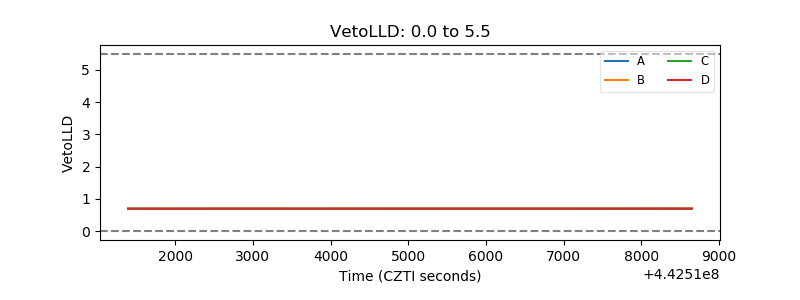 |
| Alpha Counter | 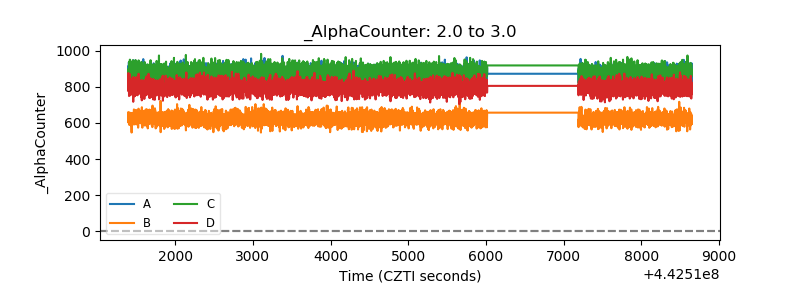 |
| _CPM_Rate | 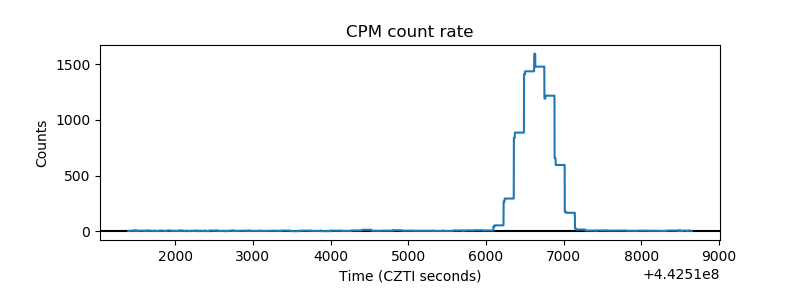 |
| CZT Counter | 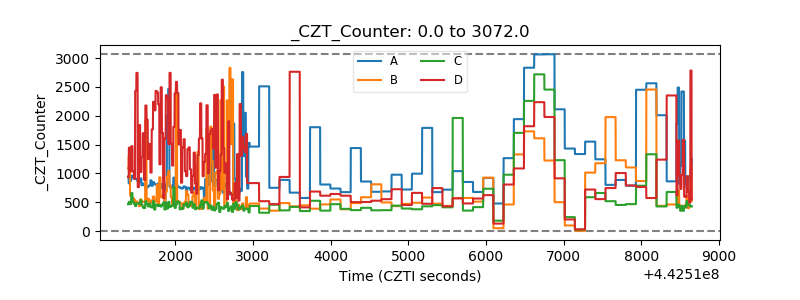 |
| +2.5 Volts monitor | 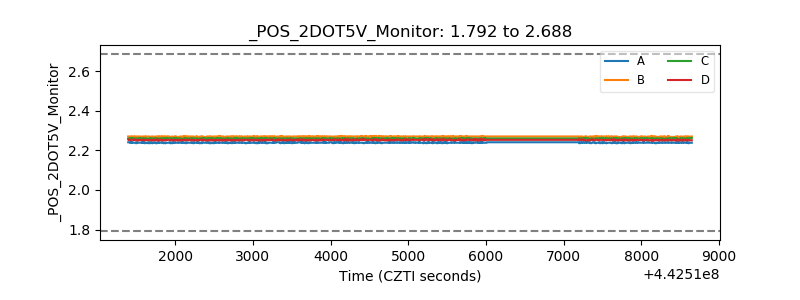 |
| +5 Volts monitor | 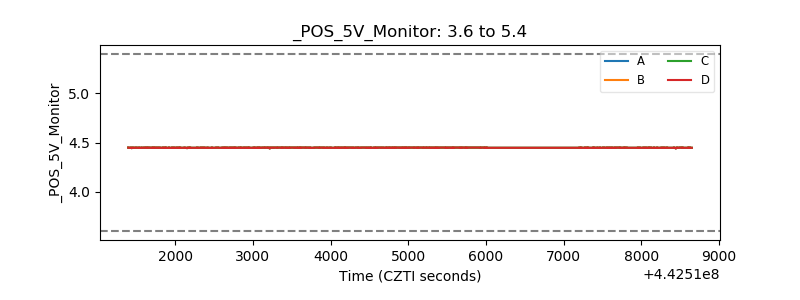 |
| _ROLL_ROT | 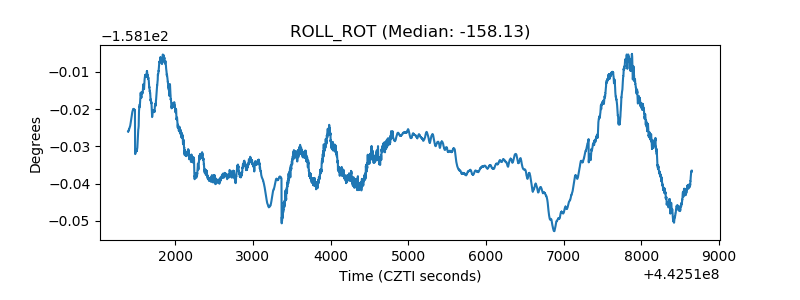 |
| _Roll_DEC | 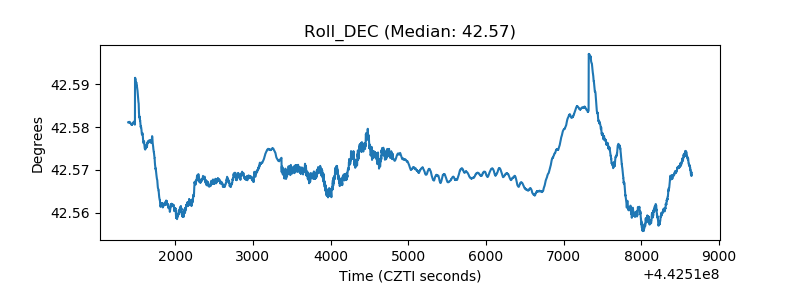 |
| _Roll_RA | 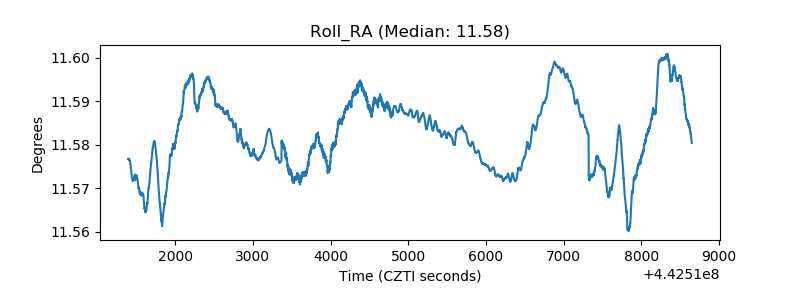 |
| Veto Counter | 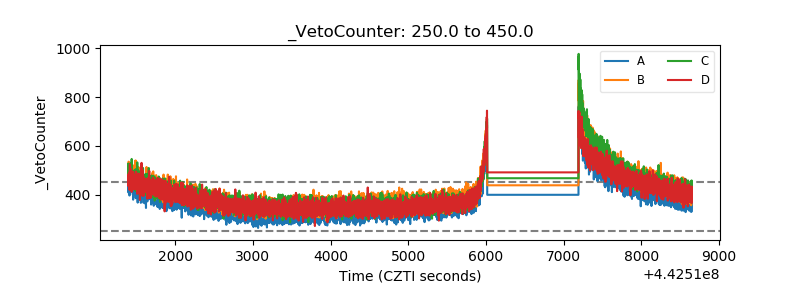 |