| Param | Original file | Final file |
|---|---|---|
| Filename | modeM0/AS1A13_004T13_9000006022_44792cztM0_level2.fits | modeM0/AS1A13_004T13_9000006022_44792cztM0_level2_quad_clean.evt |
| Size (bytes) | 590,342,400 | 106,729,920 |
| Size | 563.0 MB | 101.8 MB |
| Events in quadrant A | 6,661,707 | 688,413 |
| Events in quadrant B | 5,094,952 | 738,830 |
| Events in quadrant C | 3,130,999 | 750,719 |
| Events in quadrant D | 6,468,400 | 606,726 |
| Mode M9 | |||
|---|---|---|---|
| Quadrant | BADHDUFLAG | Total packets | Discarded packets |
| A | 0 | 14 | 0 |
| B | 0 | 15 | 0 |
| C | 0 | 15 | 0 |
| D | 0 | 15 | 0 |
| Mode M0 | |||
|---|---|---|---|
| Quadrant | BADHDUFLAG | Total packets | Discarded packets |
| A | 0 | 24734 | 2 |
| B | 0 | 19554 | 2 |
| C | 0 | 13686 | 2 |
| D | 0 | 23745 | 2 |
| Mode SS | |||
|---|---|---|---|
| Quadrant | BADHDUFLAG | Total packets | Discarded packets |
| A | 0 | 130 | 0 |
| B | 0 | 130 | 0 |
| C | 0 | 130 | 0 |
| D | 0 | 130 | 0 |
| Quadrant | Total seconds | Saturated seconds | Saturation percentage |
|---|---|---|---|
| A | 6406 | 708 | 11.052139% |
| B | 6406 | 537 | 8.382766% |
| C | 6406 | 67 | 1.045894% |
| D | 6406 | 911 | 14.221043% |
Noise dominated data is calculated using 1-second bins in cleaned event files. If a bin has >2000 counts, and if more than 50% of those come from <1% of pixels, then it is considered to be noise-dominated and hence unusable.
| Quadrant | # 1 sec bins | Bins with >0 counts | Bins with >2000 counts | High rate bins dominated by noise | Noise dominated (total time) | Noise dominated (detector-on time) | Marked lightcurve |
|---|---|---|---|---|---|---|---|
| A | 7606 | 6406 | 551 | 551 | 7.24% | 8.60% |  |
| B | 7606 | 6406 | 400 | 400 | 5.26% | 6.24% | 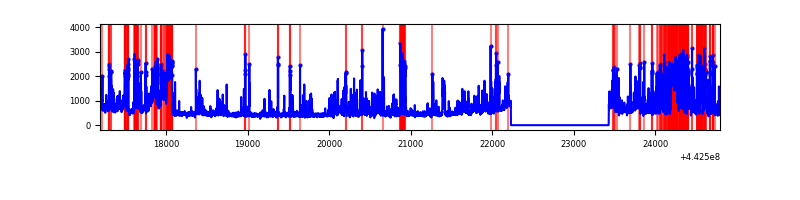 |
| C | 7606 | 6406 | 22 | 22 | 0.29% | 0.34% | 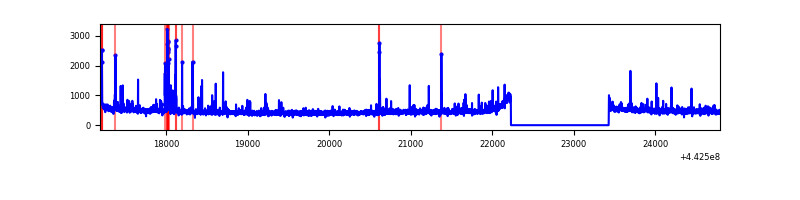 |
| D | 7606 | 6406 | 820 | 820 | 10.78% | 12.80% | 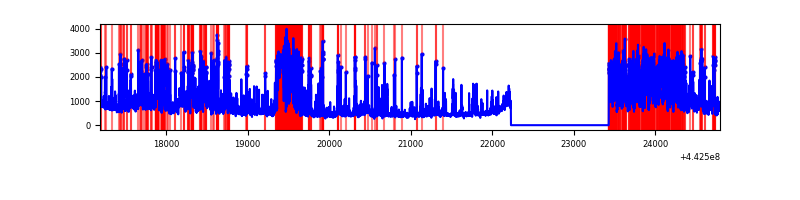 |
Top three noisy pixels from each quadrant. If the there are fewer than three noisy pixels in the level2.evt file, extra rows are filled as -1
| Pixel properties | Quadrant properties | ||||||
|---|---|---|---|---|---|---|---|
| Quadrant | DetID | PixID | Counts | Sigma | Mean | Median | Sigma |
| A | 10 | 83 | 2102656 | 14375.57 | 713 | 699 | 146.2 |
| A | 15 | 223 | 1464900 | 10013.87 | 713 | 699 | 146.2 |
| A | 13 | 248 | 244365 | 1666.47 | 713 | 699 | 146.2 |
| B | 0 | 189 | 1304321 | 9180.35 | 727 | 705 | 142.0 |
| B | 5 | 255 | 571489 | 4019.59 | 727 | 705 | 142.0 |
| B | 3 | 112 | 65818 | 458.54 | 727 | 705 | 142.0 |
| C | 14 | 254 | 172601 | 994.51 | 742 | 749 | 172.8 |
| C | 1 | 3 | 28962 | 163.27 | 742 | 749 | 172.8 |
| C | 2 | 14 | 12476 | 67.86 | 742 | 749 | 172.8 |
| D | 13 | 249 | 1074309 | 6308.77 | 694 | 674 | 170.2 |
| D | 1 | 52 | 945015 | 5549.03 | 694 | 674 | 170.2 |
| D | 5 | 235 | 589265 | 3458.61 | 694 | 674 | 170.2 |
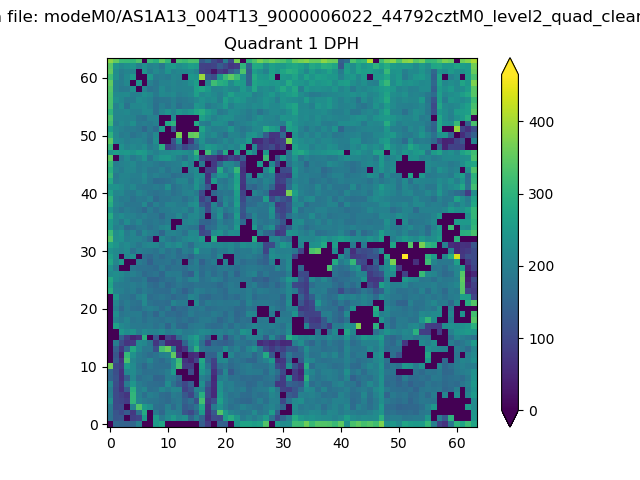
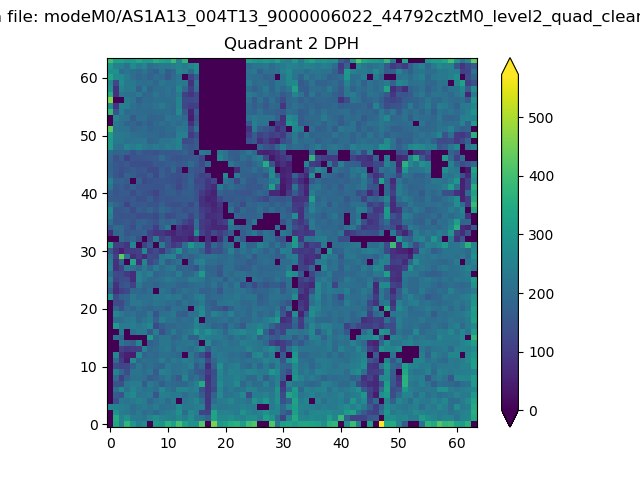
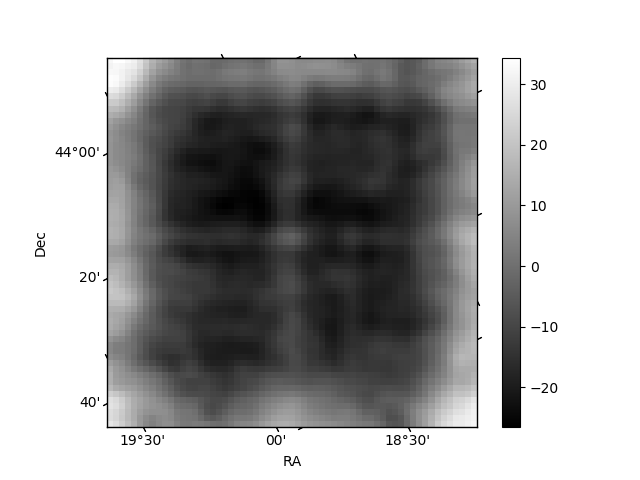
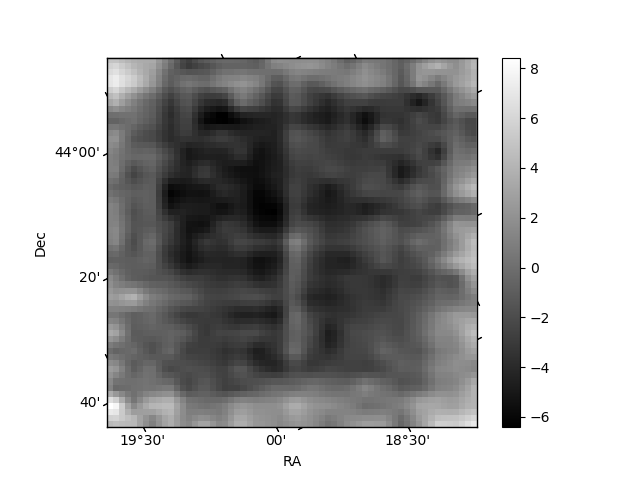
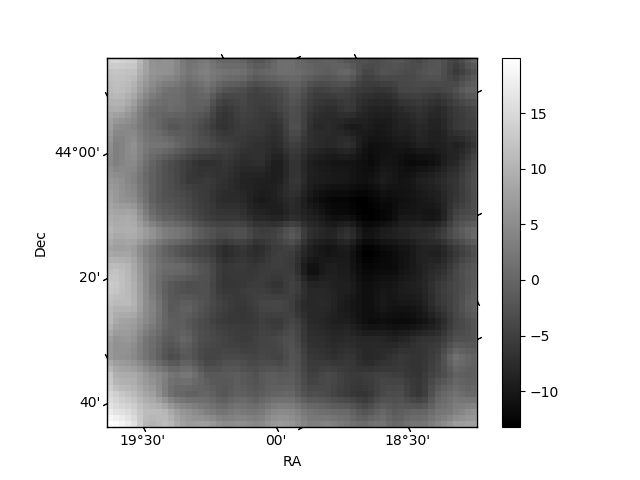
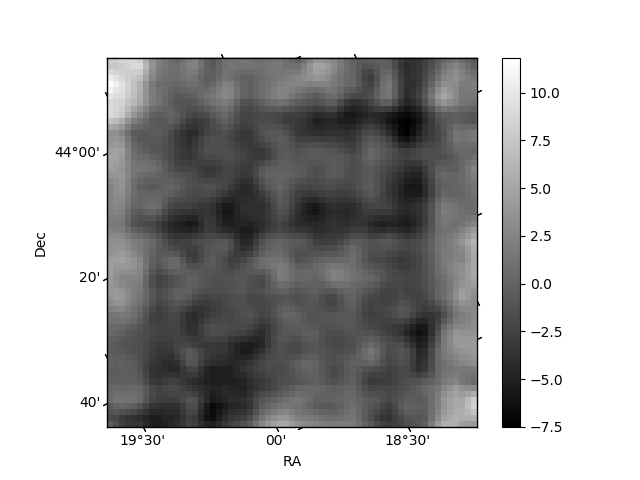
Histogram calculated using DETX and DETY for each event in the final _common_clean file
| Quadrant A | 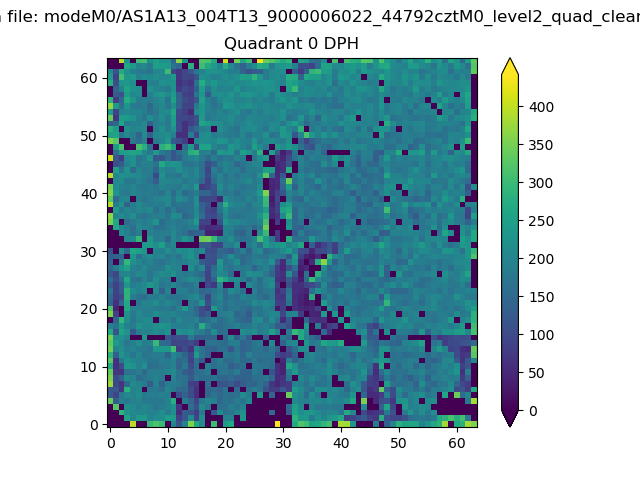 |
 |
Quadrant B |
|---|---|---|---|
| Quadrant D | 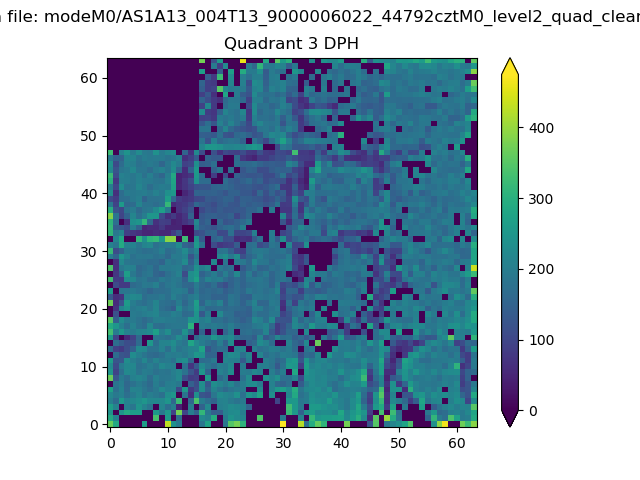 |
 |
Quadrant C |
| Plot type | Count rate plots | Images |
|---|---|---|
| Comparison with Poisson distribution Blue bars denote a histogram of data divided into 1 sec bins. Red curve is a Poisson curve with rate = median count rate of data. |
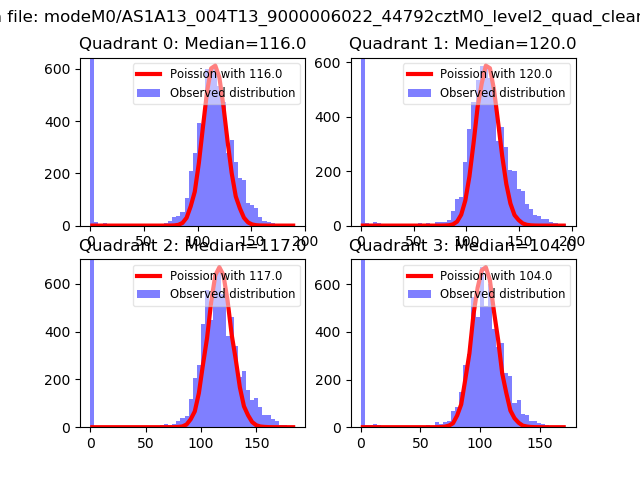 |
 |
| Quadrant-wise count rates Data is divided into 100 sec bins |
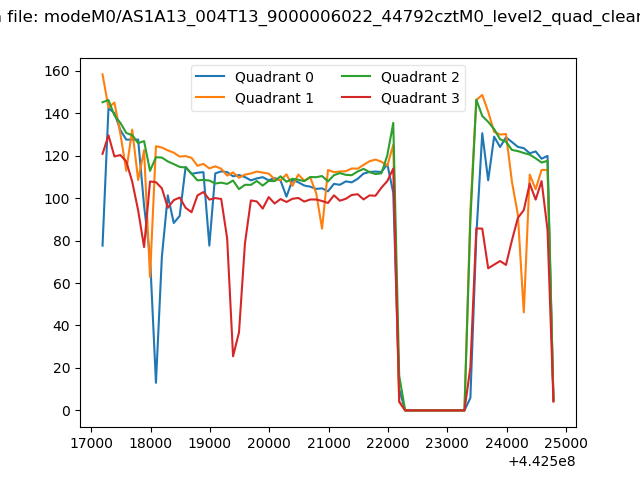 |
|
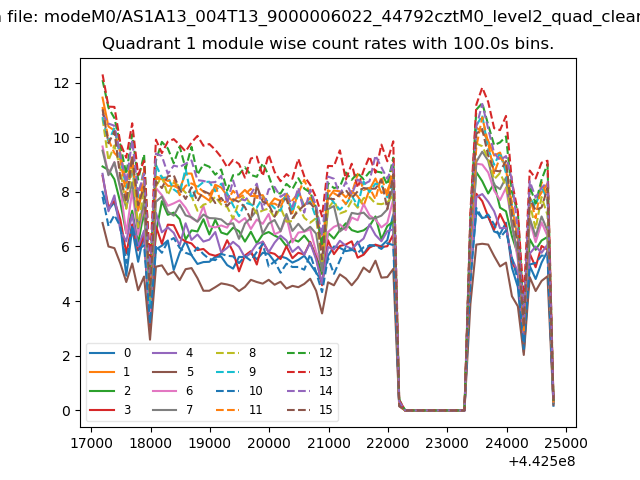
| Module-wise count rates for Quadrant A Data is divided into 100 sec bins |
 |
 |
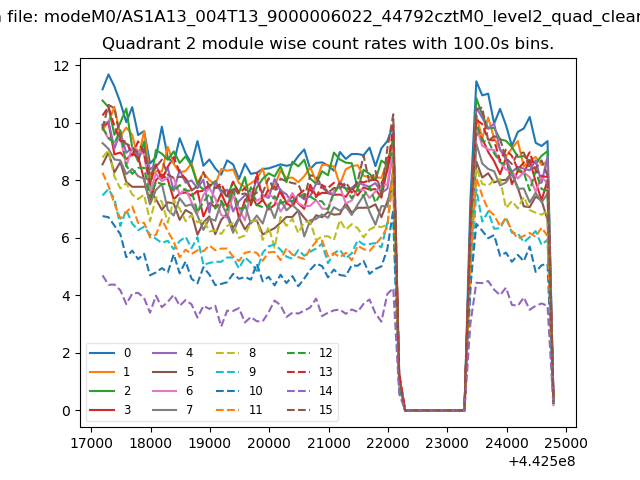
| Module-wise count rates for Quadrant B Data is divided into 100 sec bins |
 |
 |
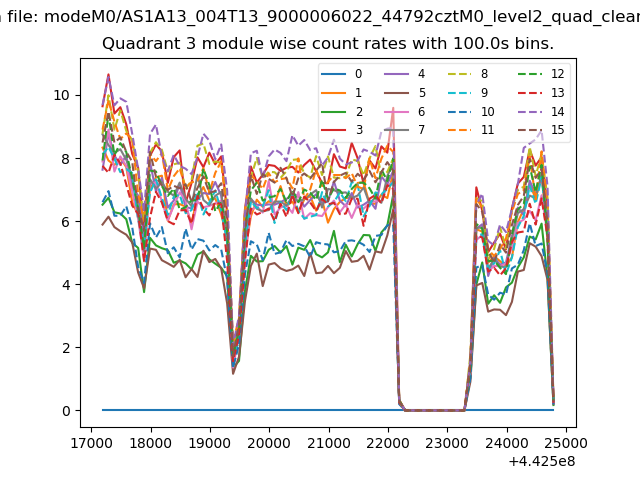
| Module-wise count rates for Quadrant C Data is divided into 100 sec bins |
 |
 |
| Module-wise count rates for Quadrant D Data is divided into 100 sec bins |
 |
 |
| Parameter | Plot |
|---|---|
| CZT HV Monitor | 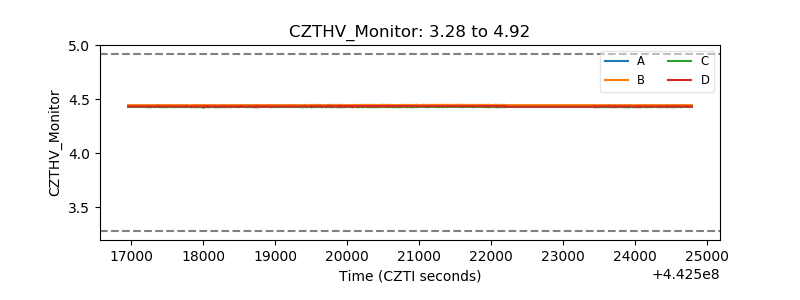 |
| D_VDD | 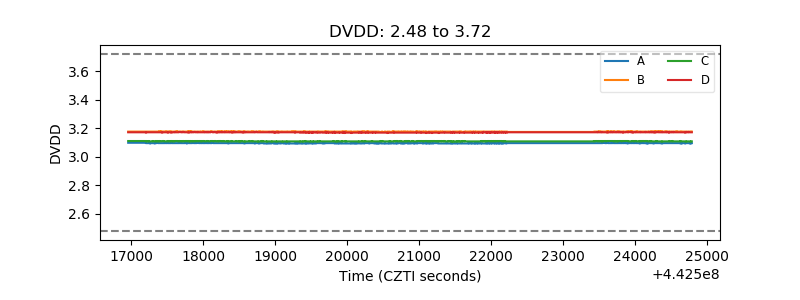 |
| Temperature 1 | 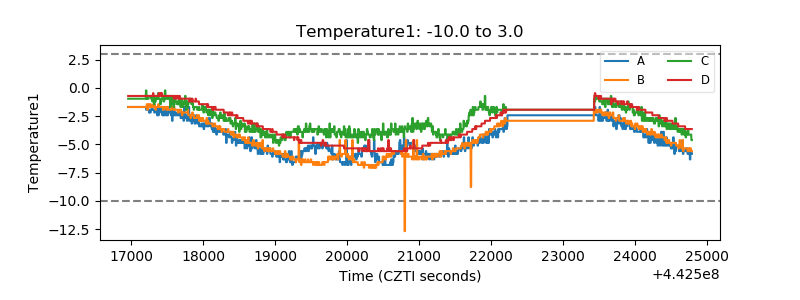 |
| Veto HV Monitor | 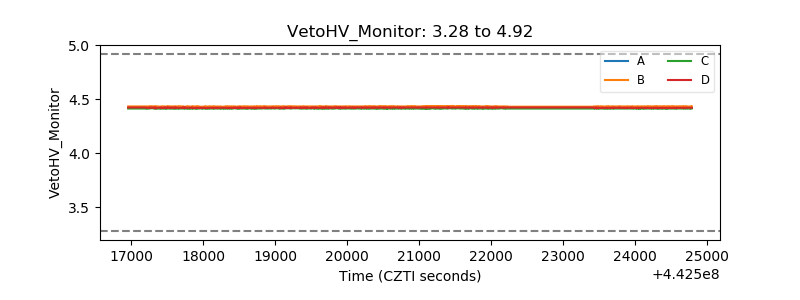 |
| Veto LLD | 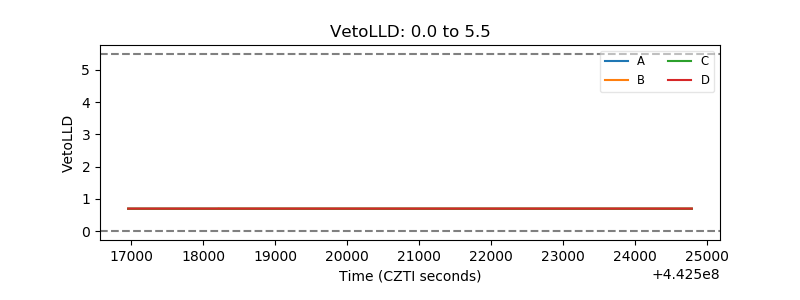 |
| Alpha Counter | 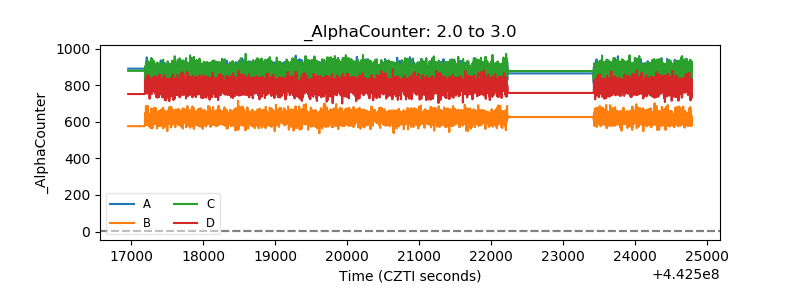 |
| _CPM_Rate | 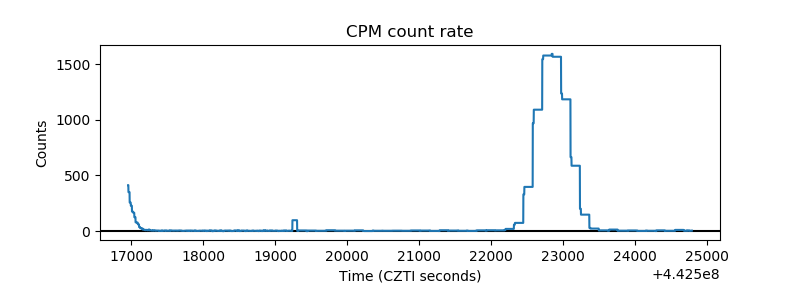 |
| CZT Counter | 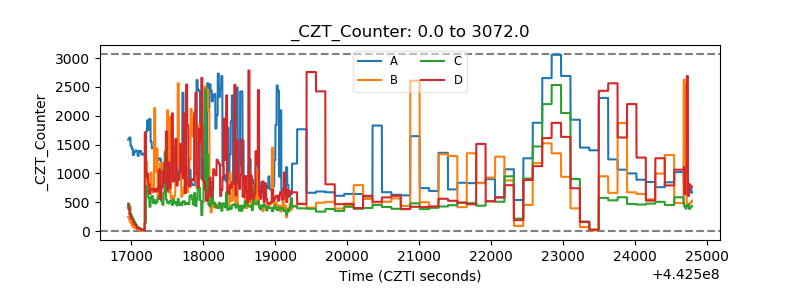 |
| +2.5 Volts monitor | 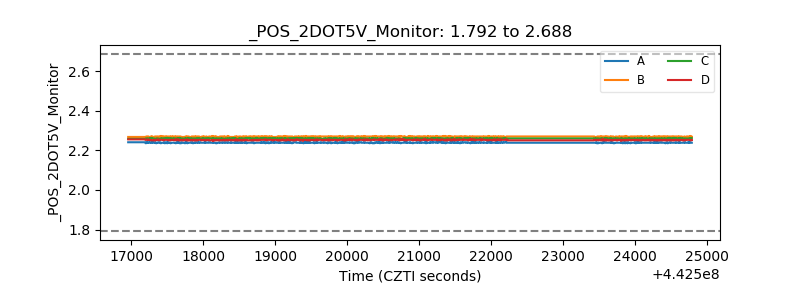 |
| +5 Volts monitor |  |
| _ROLL_ROT | 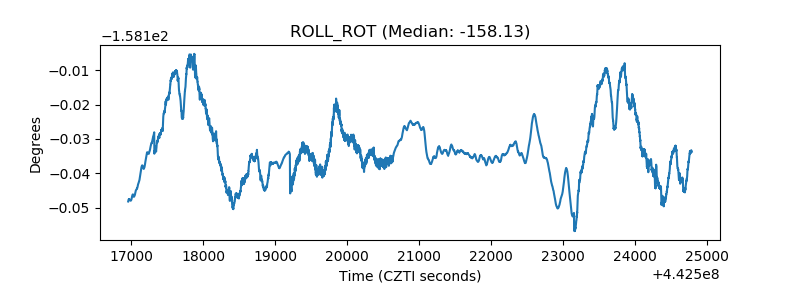 |
| _Roll_DEC | 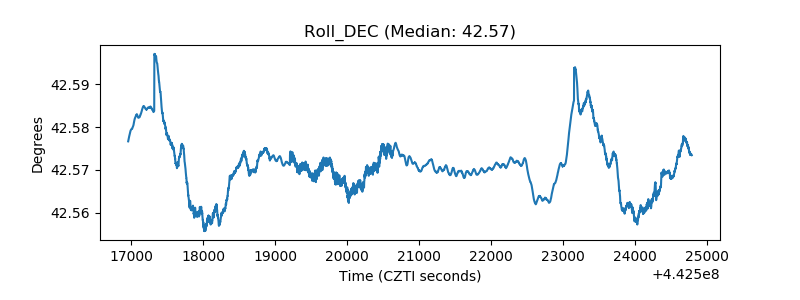 |
| _Roll_RA | 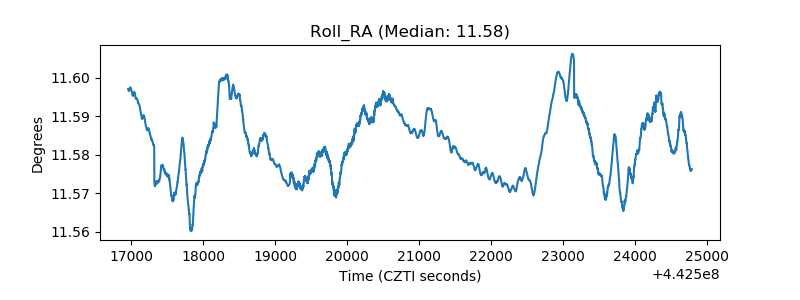 |
| Veto Counter | 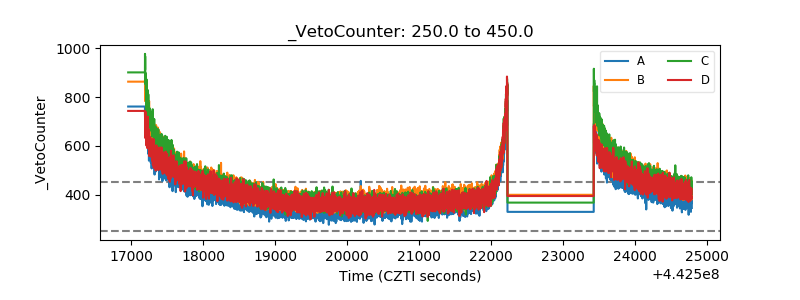 |