| Param | Original file | Final file |
|---|---|---|
| Filename | modeM0/AS1A13_004T13_9000006022_44794cztM0_level2.fits | modeM0/AS1A13_004T13_9000006022_44794cztM0_level2_quad_clean.evt |
| Size (bytes) | 597,510,720 | 102,876,480 |
| Size | 569.8 MB | 98.1 MB |
| Events in quadrant A | 8,194,085 | 620,067 |
| Events in quadrant B | 4,231,617 | 722,961 |
| Events in quadrant C | 2,891,778 | 723,261 |
| Events in quadrant D | 6,305,087 | 603,076 |
| Mode M9 | |||
|---|---|---|---|
| Quadrant | BADHDUFLAG | Total packets | Discarded packets |
| A | 0 | 12 | 0 |
| B | 0 | 12 | 0 |
| C | 0 | 12 | 0 |
| D | 0 | 12 | 0 |
| Mode M0 | |||
|---|---|---|---|
| Quadrant | BADHDUFLAG | Total packets | Discarded packets |
| A | 0 | 28941 | 2 |
| B | 0 | 16920 | 2 |
| C | 0 | 13191 | 2 |
| D | 0 | 23229 | 6 |
| Mode SS | |||
|---|---|---|---|
| Quadrant | BADHDUFLAG | Total packets | Discarded packets |
| A | 0 | 128 | 0 |
| B | 0 | 128 | 0 |
| C | 0 | 128 | 0 |
| D | 0 | 128 | 0 |
| Quadrant | Total seconds | Saturated seconds | Saturation percentage |
|---|---|---|---|
| A | 6393 | 1148 | 17.957141% |
| B | 6393 | 354 | 5.537306% |
| C | 6394 | 26 | 0.406631% |
| D | 6393 | 711 | 11.121539% |
Noise dominated data is calculated using 1-second bins in cleaned event files. If a bin has >2000 counts, and if more than 50% of those come from <1% of pixels, then it is considered to be noise-dominated and hence unusable.
| Quadrant | # 1 sec bins | Bins with >0 counts | Bins with >2000 counts | High rate bins dominated by noise | Noise dominated (total time) | Noise dominated (detector-on time) | Marked lightcurve |
|---|---|---|---|---|---|---|---|
| A | 7538 | 6393 | 1005 | 1005 | 13.33% | 15.72% | 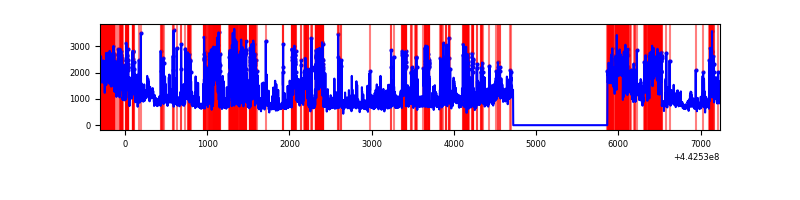 |
| B | 7538 | 6393 | 244 | 244 | 3.24% | 3.82% | 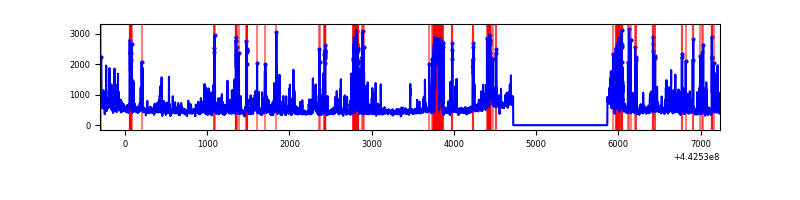 |
| C | 7539 | 6395 | 6 | 6 | 0.08% | 0.09% | 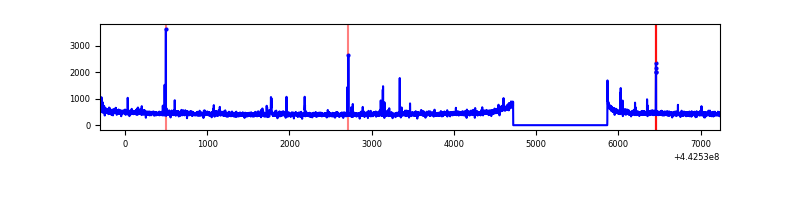 |
| D | 7538 | 6394 | 709 | 709 | 9.41% | 11.09% | 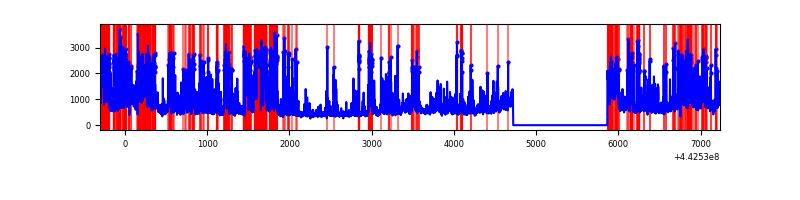 |
Top three noisy pixels from each quadrant. If the there are fewer than three noisy pixels in the level2.evt file, extra rows are filled as -1
| Pixel properties | Quadrant properties | ||||||
|---|---|---|---|---|---|---|---|
| Quadrant | DetID | PixID | Counts | Sigma | Mean | Median | Sigma |
| A | 15 | 223 | 3603344 | 25955.55 | 673 | 660 | 138.8 |
| A | 10 | 83 | 1906254 | 13728.86 | 673 | 660 | 138.8 |
| A | 10 | 248 | 33937 | 239.74 | 673 | 660 | 138.8 |
| B | 5 | 255 | 541264 | 3940.13 | 708 | 688 | 137.2 |
| B | 0 | 189 | 487711 | 3549.8 | 708 | 688 | 137.2 |
| B | 5 | 172 | 91961 | 665.27 | 708 | 688 | 137.2 |
| C | 12 | 2 | 38051 | 222.04 | 718 | 722 | 168.1 |
| C | 2 | 14 | 25486 | 147.3 | 718 | 722 | 168.1 |
| C | 14 | 254 | 12690 | 71.19 | 718 | 722 | 168.1 |
| D | 13 | 187 | 935379 | 5392.69 | 685 | 664 | 173.3 |
| D | 13 | 249 | 671239 | 3868.77 | 685 | 664 | 173.3 |
| D | 5 | 235 | 574551 | 3310.95 | 685 | 664 | 173.3 |
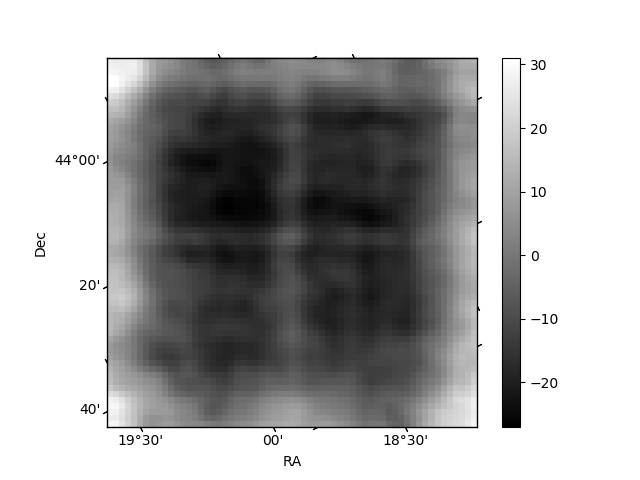
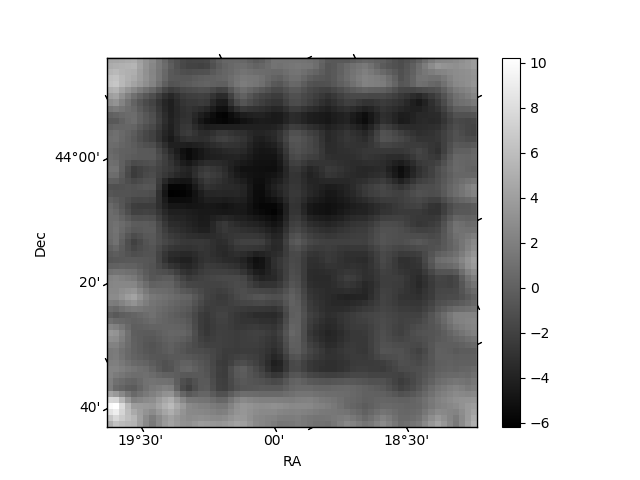
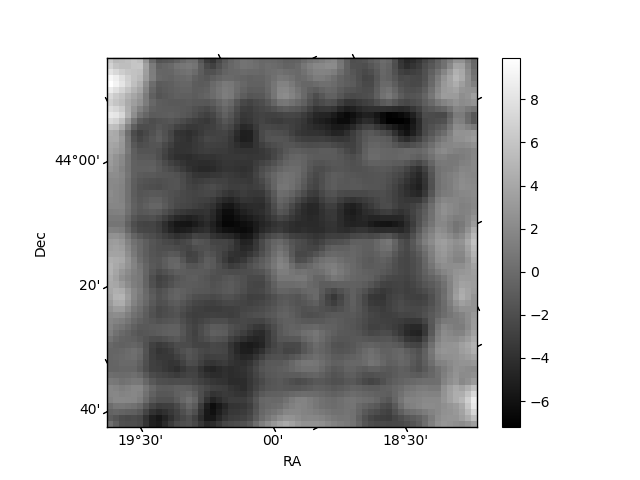
Histogram calculated using DETX and DETY for each event in the final _common_clean file
| Quadrant A | 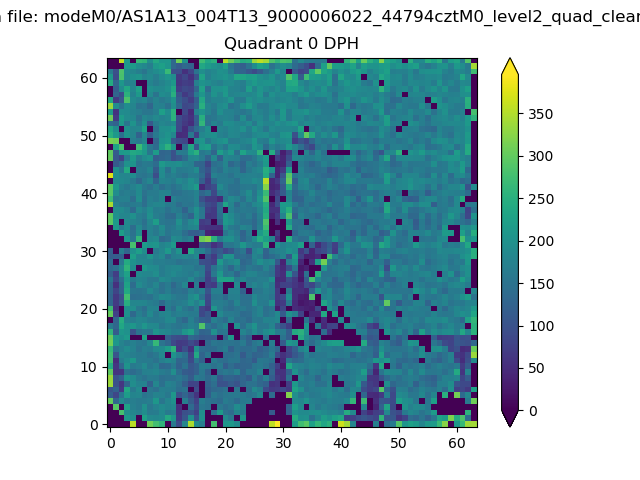 |
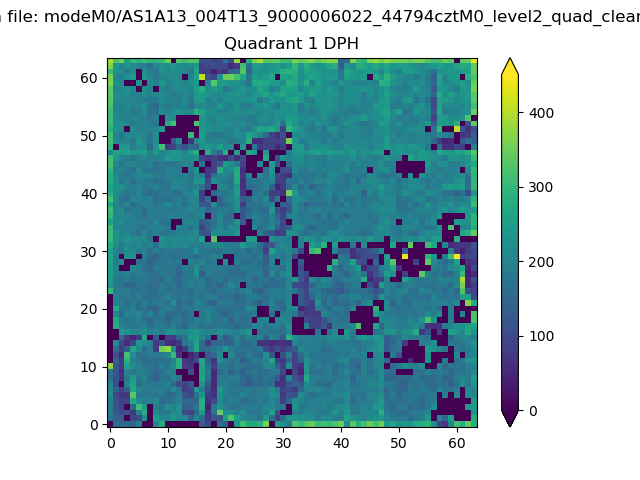 |
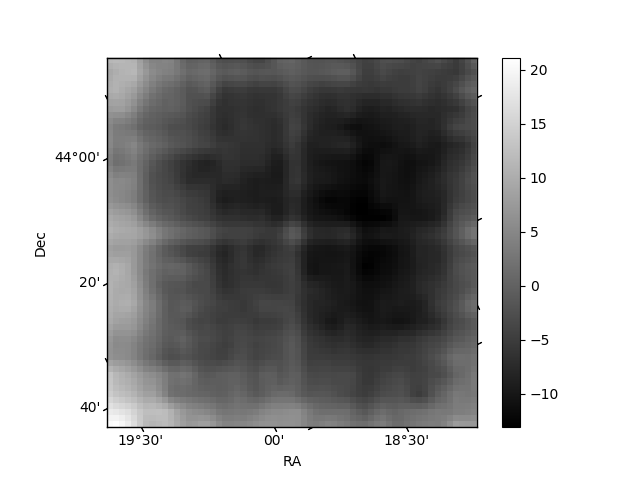
Quadrant B |
|---|---|---|---|
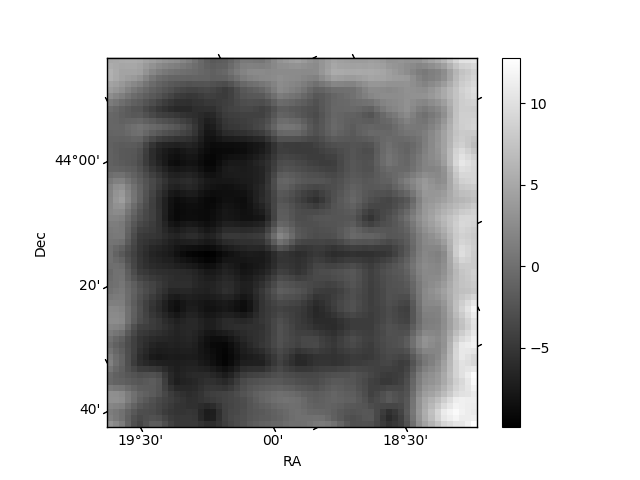
| Quadrant D | 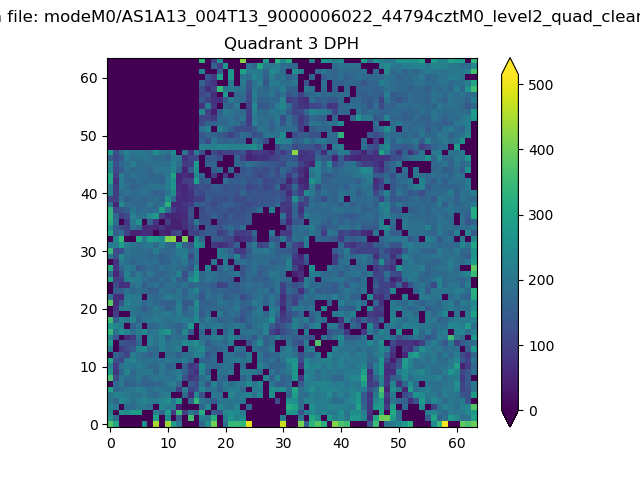 |
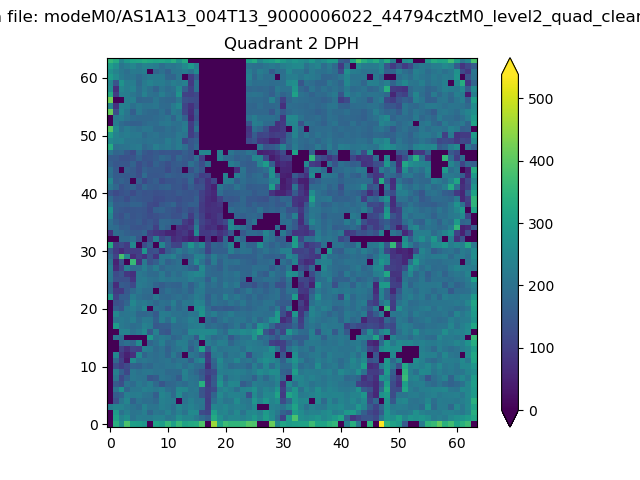 |
Quadrant C |
| Plot type | Count rate plots | Images |
|---|---|---|
| Comparison with Poisson distribution Blue bars denote a histogram of data divided into 1 sec bins. Red curve is a Poisson curve with rate = median count rate of data. |
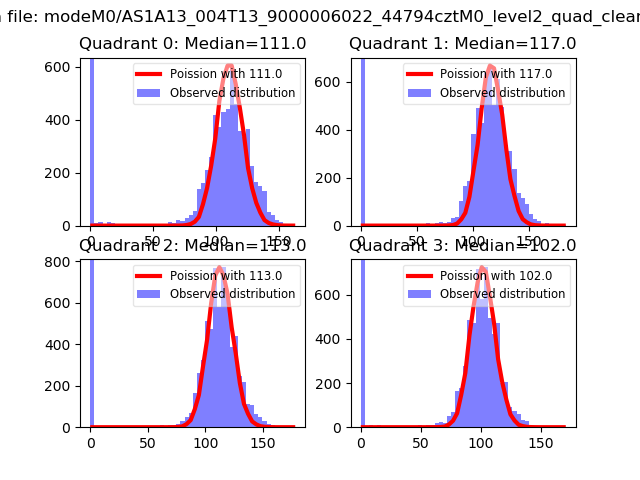 |
 |
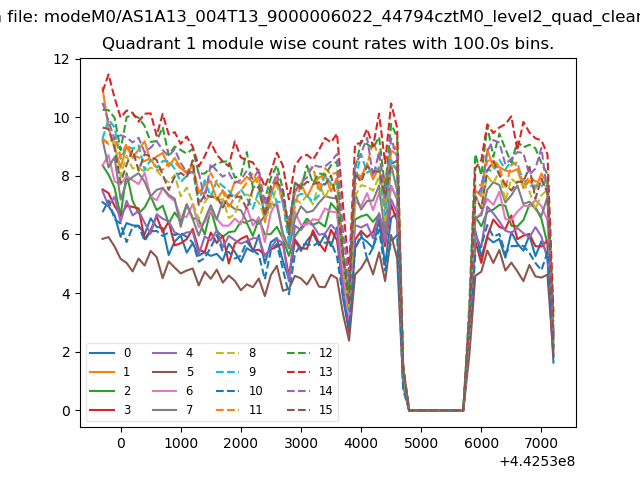
| Quadrant-wise count rates Data is divided into 100 sec bins |
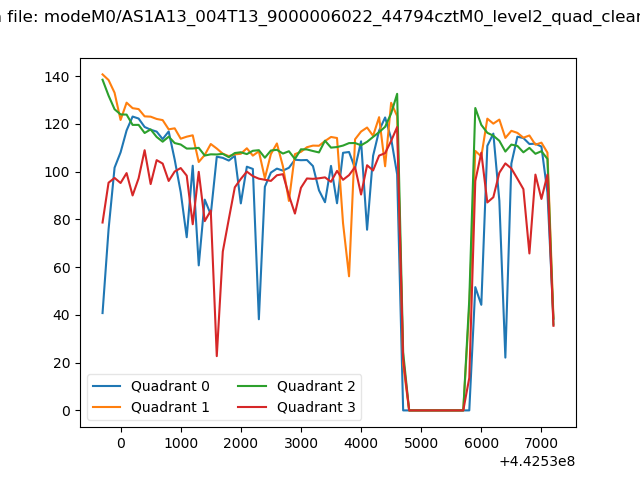 |
|
| Module-wise count rates for Quadrant A Data is divided into 100 sec bins |
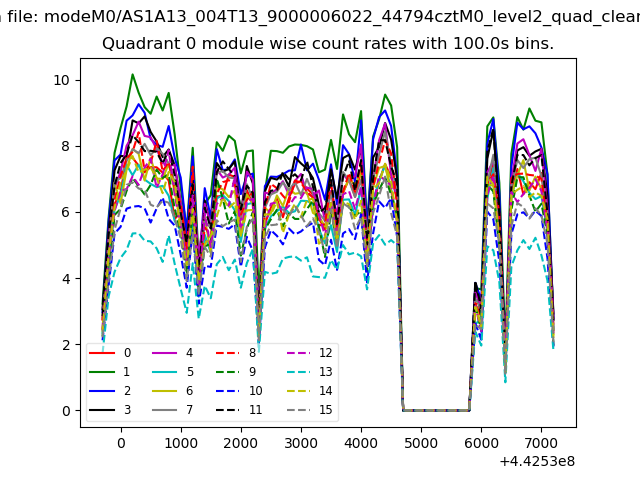 |
 |
| Module-wise count rates for Quadrant B Data is divided into 100 sec bins |
 |
 |
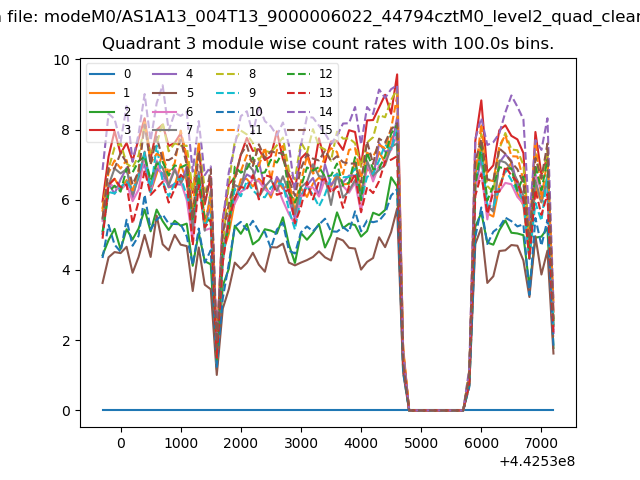
| Module-wise count rates for Quadrant C Data is divided into 100 sec bins |
 |
 |
| Module-wise count rates for Quadrant D Data is divided into 100 sec bins |
 |
 |
| Parameter | Plot |
|---|---|
| CZT HV Monitor |  |
| D_VDD | 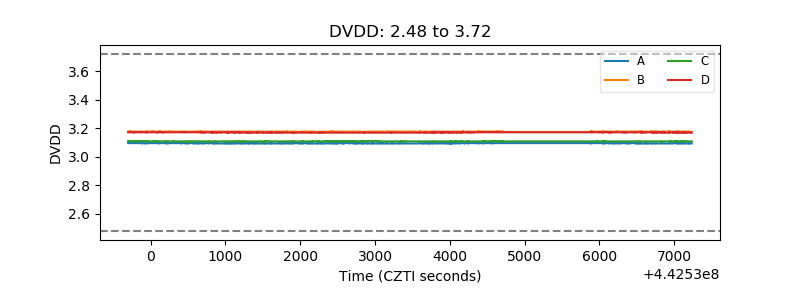 |
| Temperature 1 | 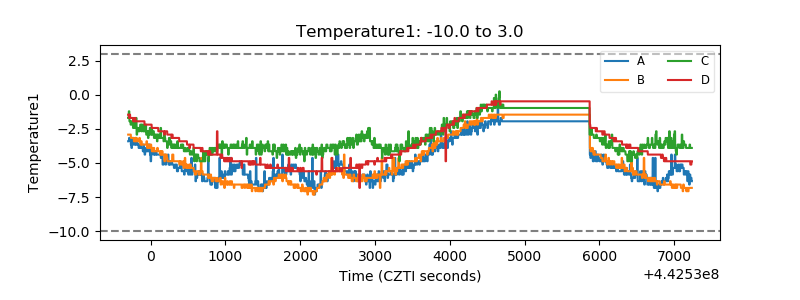 |
| Veto HV Monitor | 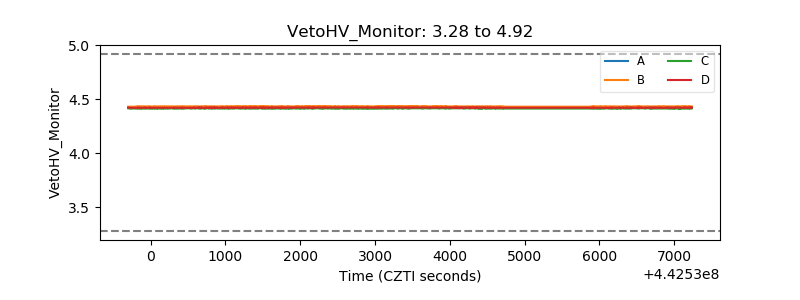 |
| Veto LLD | 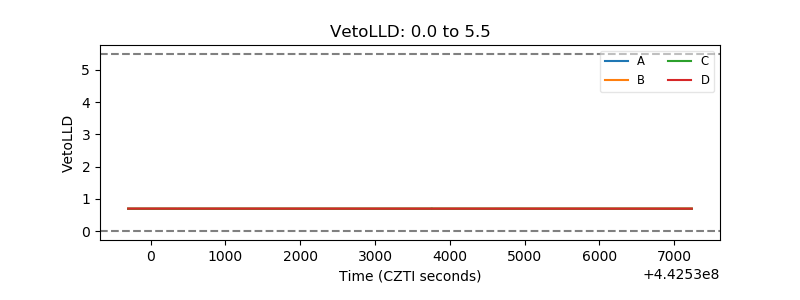 |
| Alpha Counter | 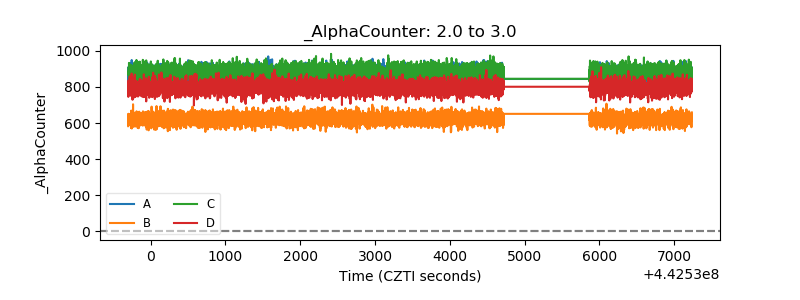 |
| _CPM_Rate | 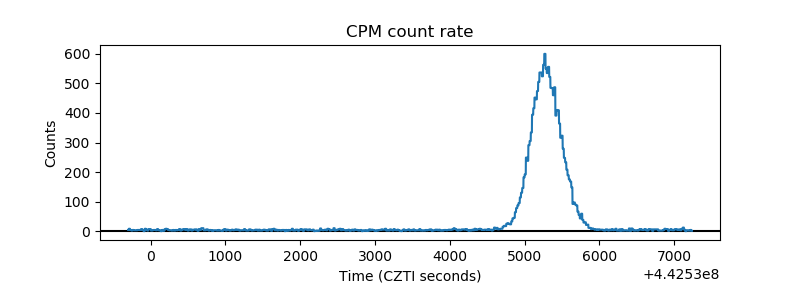 |
| CZT Counter | 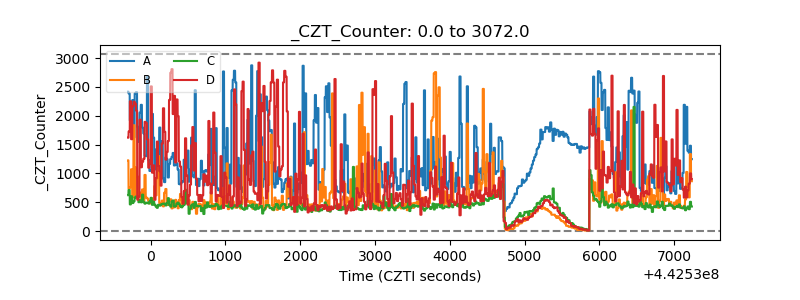 |
| +2.5 Volts monitor | 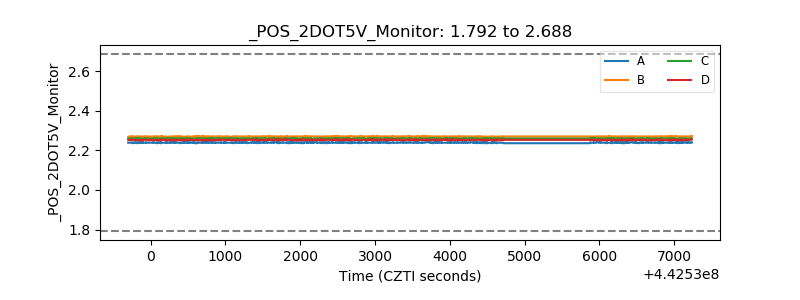 |
| +5 Volts monitor | 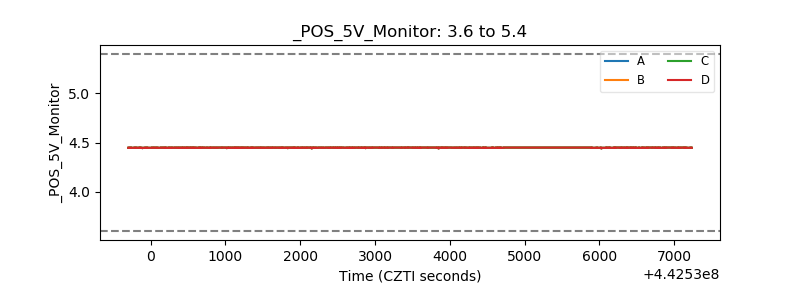 |
| _ROLL_ROT | 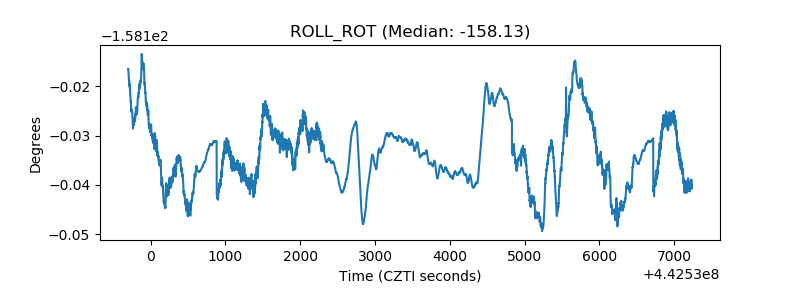 |
| _Roll_DEC | 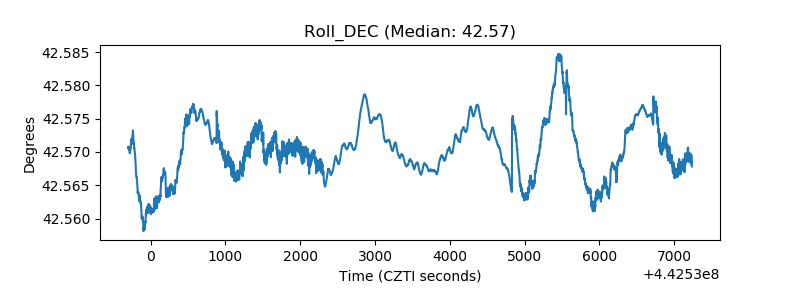 |
| _Roll_RA | 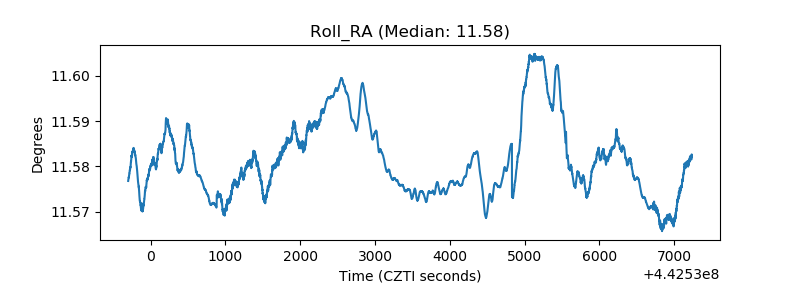 |
| Veto Counter | 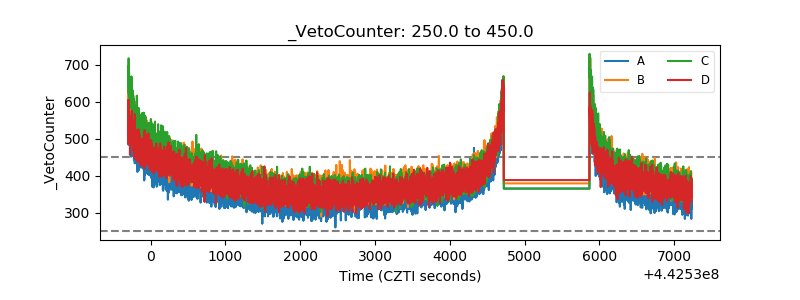 |