| Param | Original file | Final file |
|---|---|---|
| Filename | modeM0/AS1A13_004T13_9000006022_44795cztM0_level2.fits | modeM0/AS1A13_004T13_9000006022_44795cztM0_level2_quad_clean.evt |
| Size (bytes) | 684,809,280 | 109,192,320 |
| Size | 653.1 MB | 104.1 MB |
| Events in quadrant A | 8,200,194 | 703,547 |
| Events in quadrant B | 4,169,799 | 772,454 |
| Events in quadrant C | 3,135,775 | 764,726 |
| Events in quadrant D | 9,297,343 | 574,025 |
| Mode M9 | |||
|---|---|---|---|
| Quadrant | BADHDUFLAG | Total packets | Discarded packets |
| A | 0 | 22 | 0 |
| B | 0 | 22 | 0 |
| C | 0 | 22 | 0 |
| D | 0 | 22 | 0 |
| Mode M0 | |||
|---|---|---|---|
| Quadrant | BADHDUFLAG | Total packets | Discarded packets |
| A | 0 | 29372 | 2 |
| B | 0 | 17258 | 2 |
| C | 0 | 14589 | 3 |
| D | 0 | 32622 | 2 |
| Mode SS | |||
|---|---|---|---|
| Quadrant | BADHDUFLAG | Total packets | Discarded packets |
| A | 0 | 142 | 0 |
| B | 0 | 142 | 0 |
| C | 0 | 142 | 0 |
| D | 0 | 142 | 0 |
| Quadrant | Total seconds | Saturated seconds | Saturation percentage |
|---|---|---|---|
| A | 7064 | 807 | 11.424122% |
| B | 7064 | 284 | 4.020385% |
| C | 7063 | 43 | 0.608806% |
| D | 7064 | 1575 | 22.296149% |
Noise dominated data is calculated using 1-second bins in cleaned event files. If a bin has >2000 counts, and if more than 50% of those come from <1% of pixels, then it is considered to be noise-dominated and hence unusable.
| Quadrant | # 1 sec bins | Bins with >0 counts | Bins with >2000 counts | High rate bins dominated by noise | Noise dominated (total time) | Noise dominated (detector-on time) | Marked lightcurve |
|---|---|---|---|---|---|---|---|
| A | 9139 | 7064 | 573 | 573 | 6.27% | 8.11% | 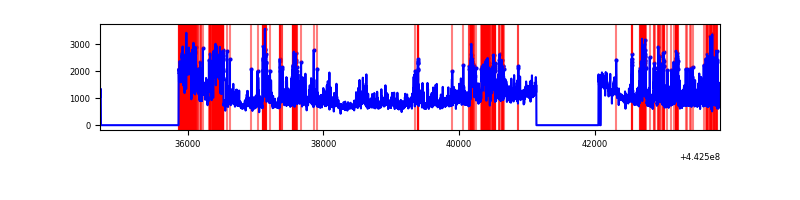 |
| B | 9139 | 7065 | 149 | 149 | 1.63% | 2.11% | 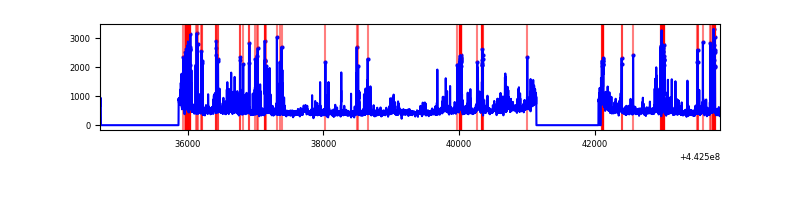 |
| C | 9138 | 7065 | 8 | 8 | 0.09% | 0.11% | 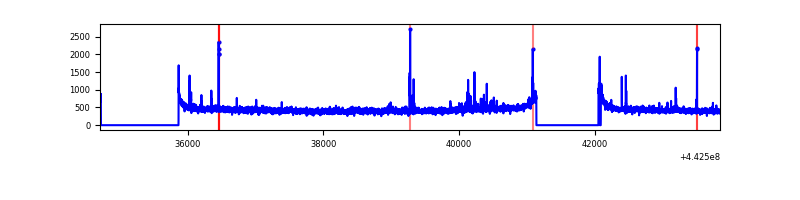 |
| D | 9138 | 7065 | 1600 | 1600 | 17.51% | 22.65% |  |
Top three noisy pixels from each quadrant. If the there are fewer than three noisy pixels in the level2.evt file, extra rows are filled as -1
| Pixel properties | Quadrant properties | ||||||
|---|---|---|---|---|---|---|---|
| Quadrant | DetID | PixID | Counts | Sigma | Mean | Median | Sigma |
| A | 15 | 223 | 3103526 | 19779.83 | 754 | 737 | 156.9 |
| A | 10 | 83 | 2132518 | 13589.79 | 754 | 737 | 156.9 |
| A | 10 | 248 | 22361 | 137.85 | 754 | 737 | 156.9 |
| B | 0 | 189 | 566657 | 3724.5 | 776 | 753 | 151.9 |
| B | 5 | 172 | 105855 | 691.73 | 776 | 753 | 151.9 |
| B | 5 | 255 | 92471 | 603.64 | 776 | 753 | 151.9 |
| C | 1 | 3 | 25385 | 134.6 | 780 | 782 | 182.8 |
| C | 2 | 14 | 20416 | 107.41 | 780 | 782 | 182.8 |
| C | 14 | 254 | 19686 | 103.42 | 780 | 782 | 182.8 |
| D | 13 | 187 | 3999114 | 22158.99 | 720 | 694 | 180.4 |
| D | 13 | 249 | 657445 | 3639.67 | 720 | 694 | 180.4 |
| D | 5 | 235 | 514432 | 2847.1 | 720 | 694 | 180.4 |
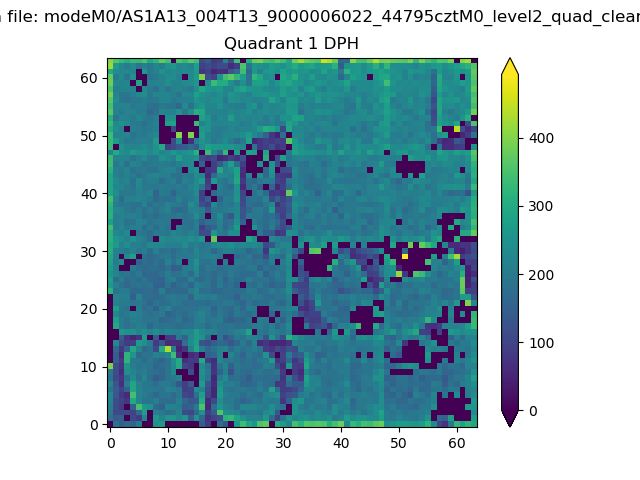
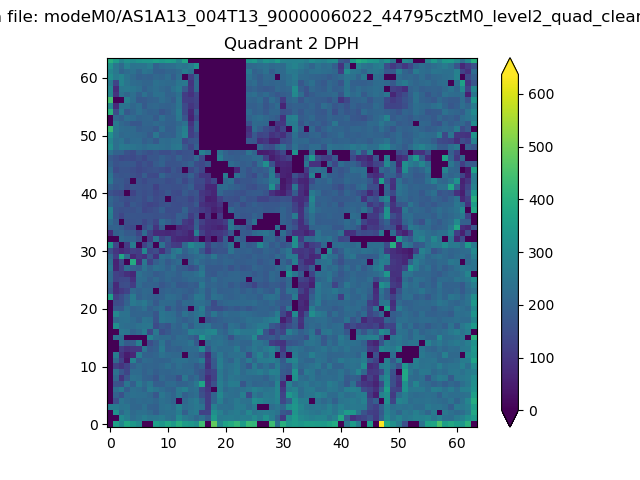
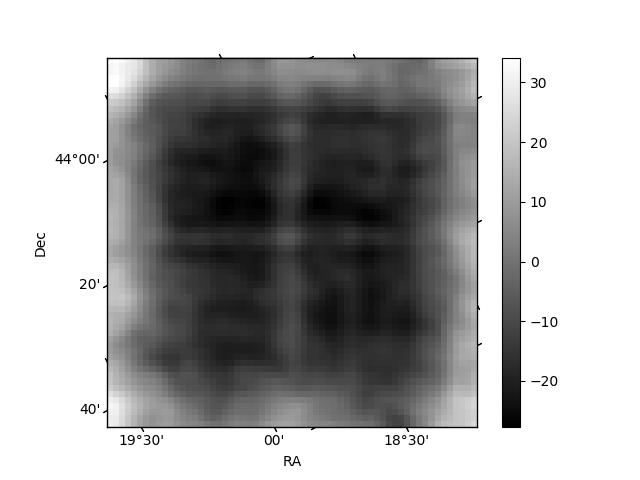
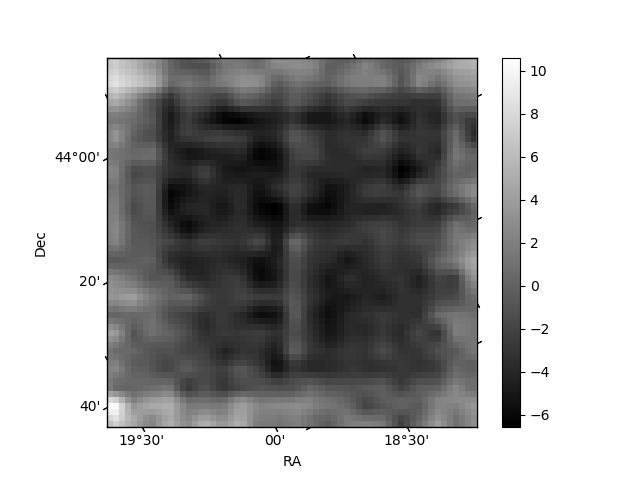
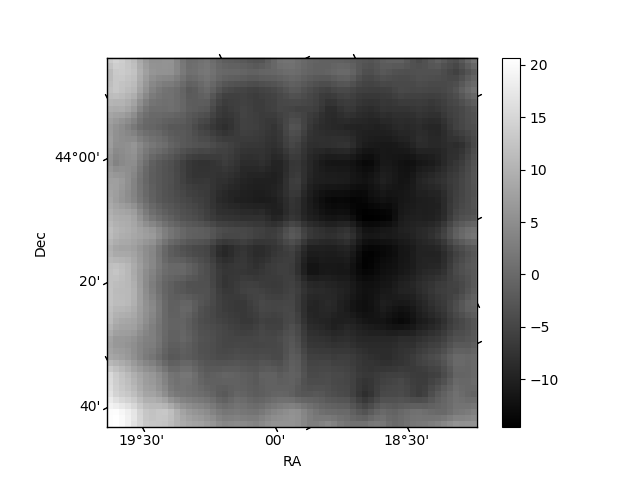
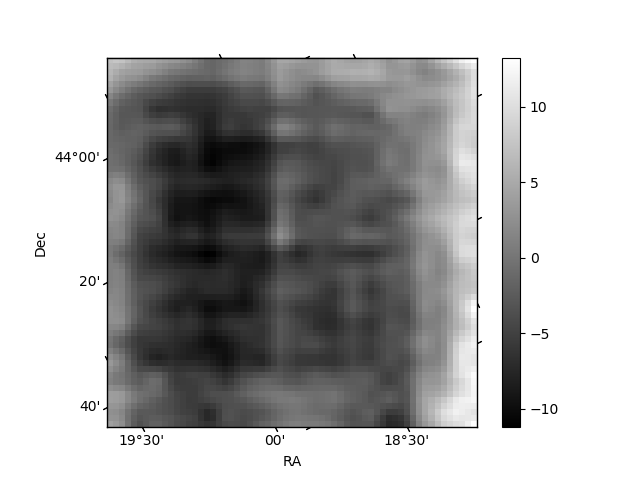
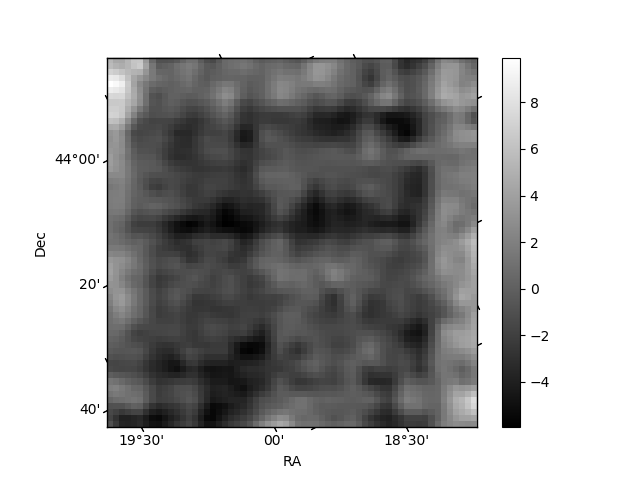
Histogram calculated using DETX and DETY for each event in the final _common_clean file
| Quadrant A | 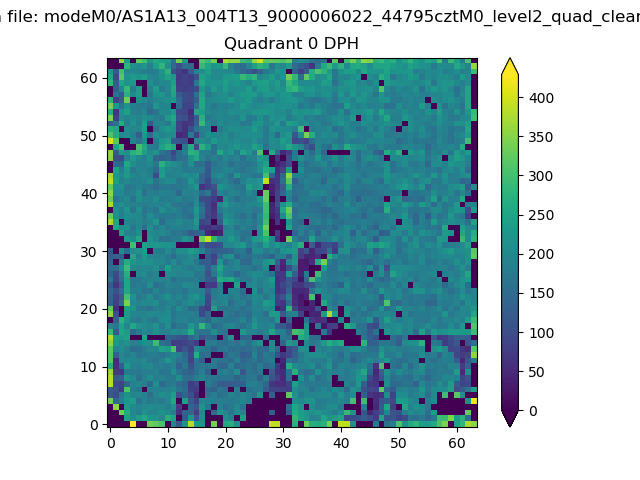 |
 |
Quadrant B |
|---|---|---|---|
| Quadrant D | 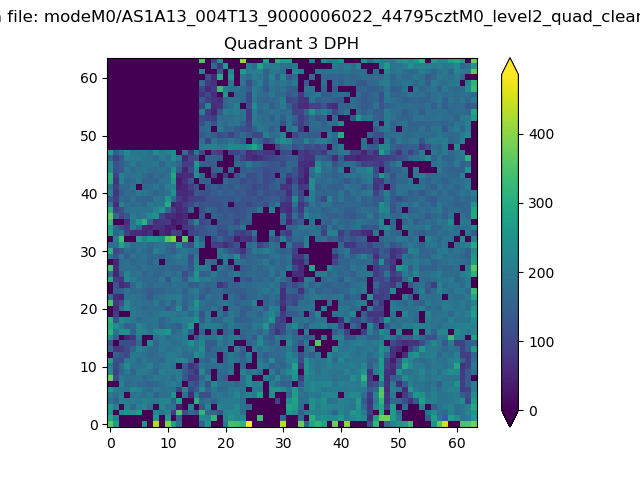 |
 |
Quadrant C |
| Plot type | Count rate plots | Images |
|---|---|---|
| Comparison with Poisson distribution Blue bars denote a histogram of data divided into 1 sec bins. Red curve is a Poisson curve with rate = median count rate of data. |
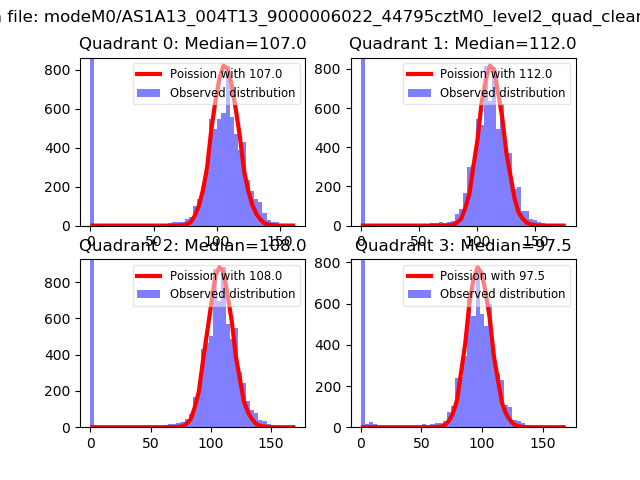 |
 |
| Quadrant-wise count rates Data is divided into 100 sec bins |
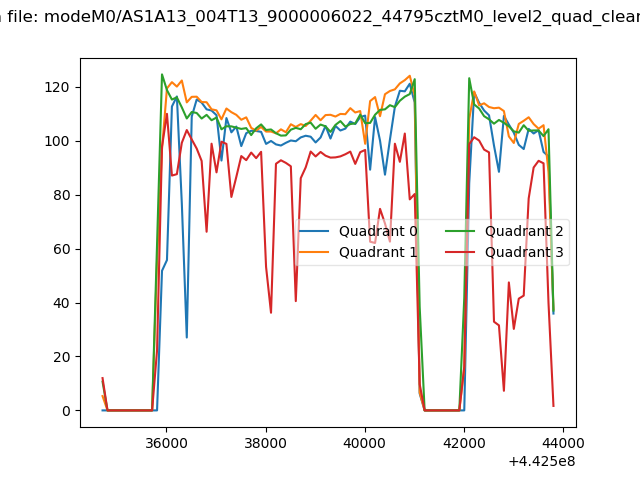 |
|
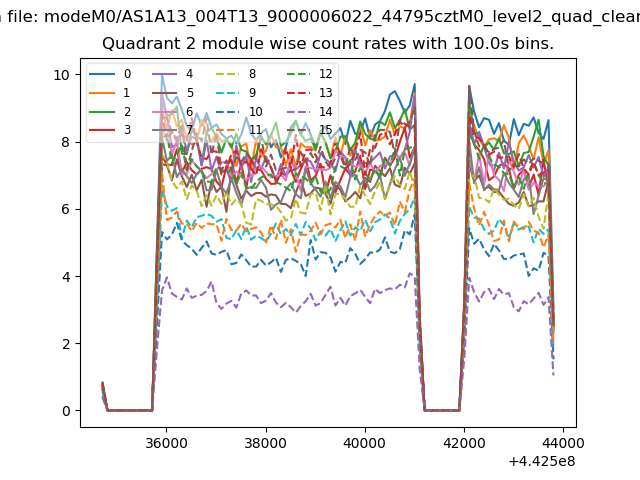
| Module-wise count rates for Quadrant A Data is divided into 100 sec bins |
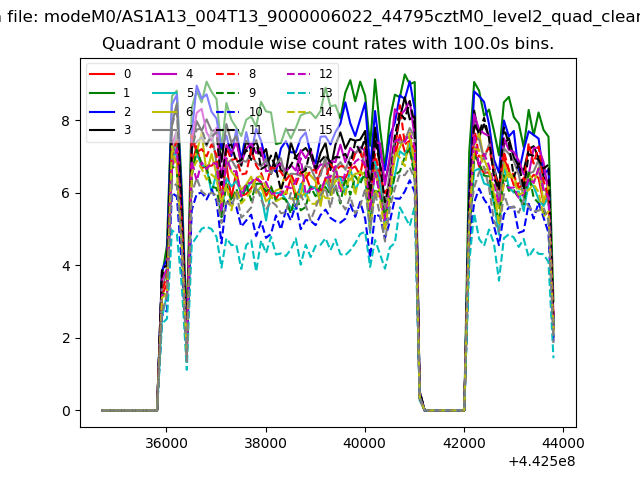 |
 |
| Module-wise count rates for Quadrant B Data is divided into 100 sec bins |
 |
 |
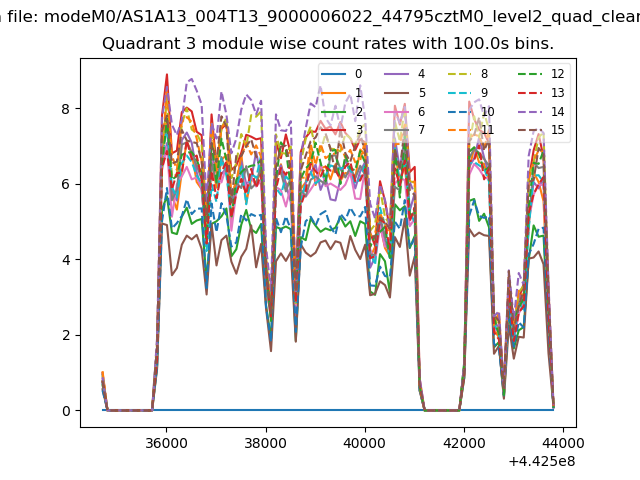
| Module-wise count rates for Quadrant C Data is divided into 100 sec bins |
 |
 |
| Module-wise count rates for Quadrant D Data is divided into 100 sec bins |
 |
 |
| Parameter | Plot |
|---|---|
| CZT HV Monitor |  |
| D_VDD | 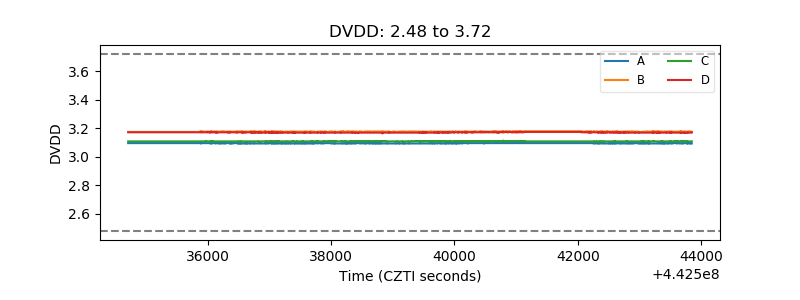 |
| Temperature 1 | 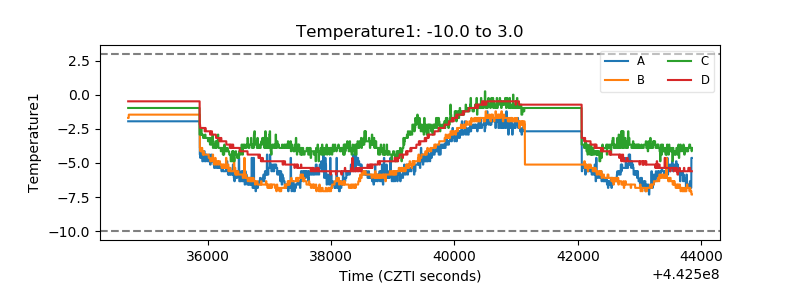 |
| Veto HV Monitor | 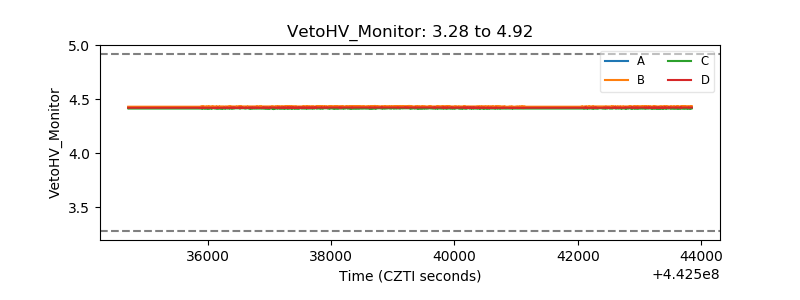 |
| Veto LLD | 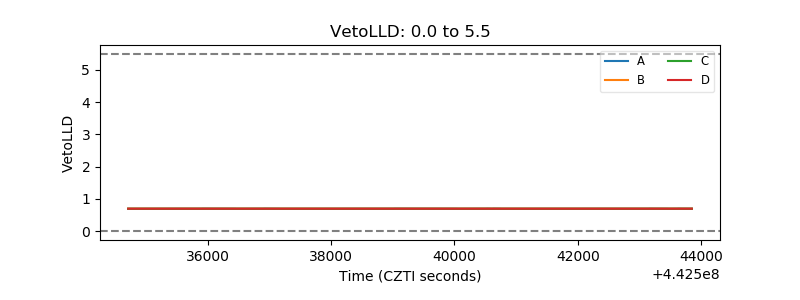 |
| Alpha Counter | 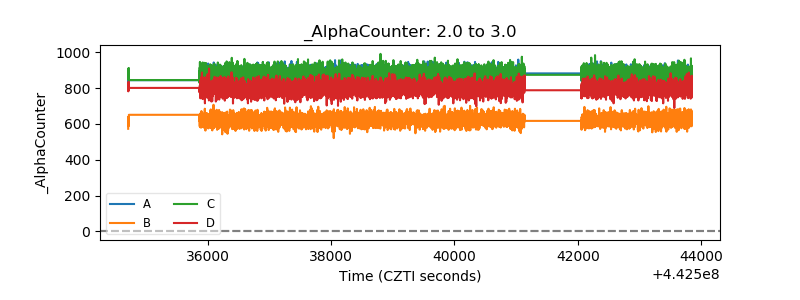 |
| _CPM_Rate | 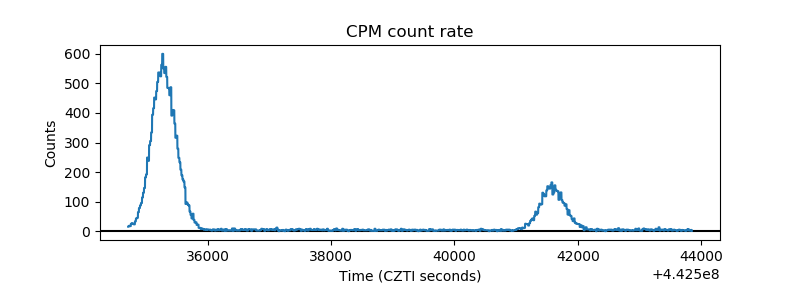 |
| CZT Counter | 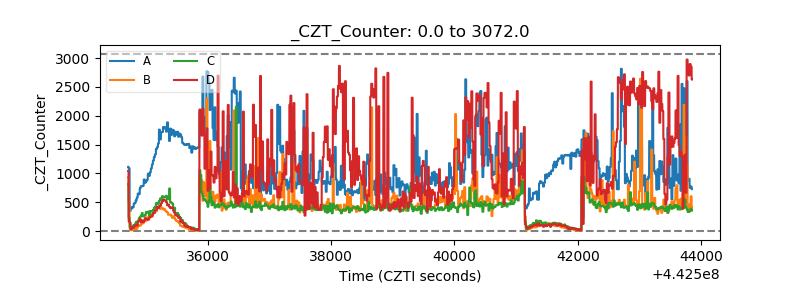 |
| +2.5 Volts monitor | 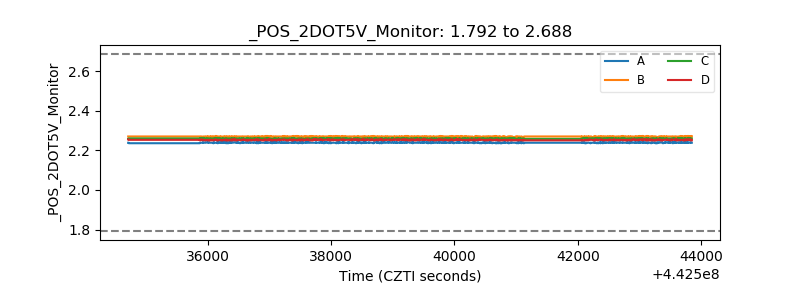 |
| +5 Volts monitor | 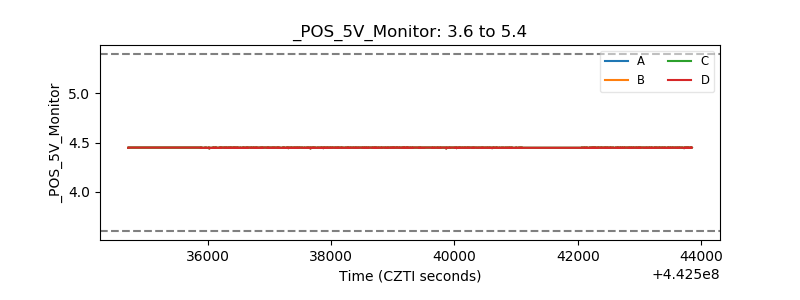 |
| _ROLL_ROT |  |
| _Roll_DEC | 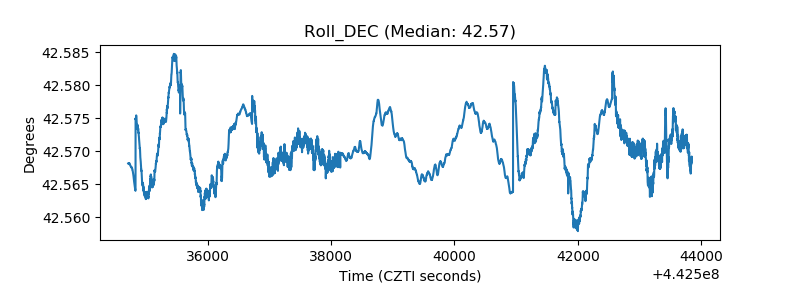 |
| _Roll_RA | 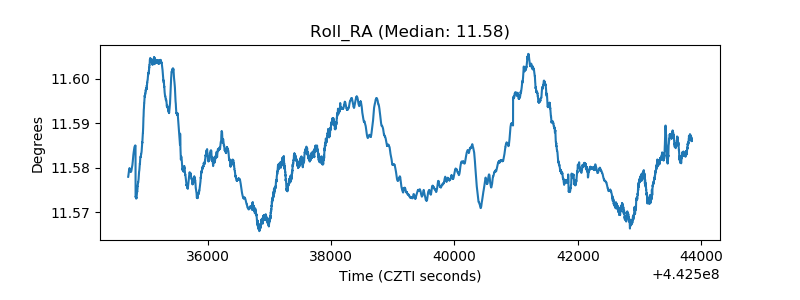 |
| Veto Counter | 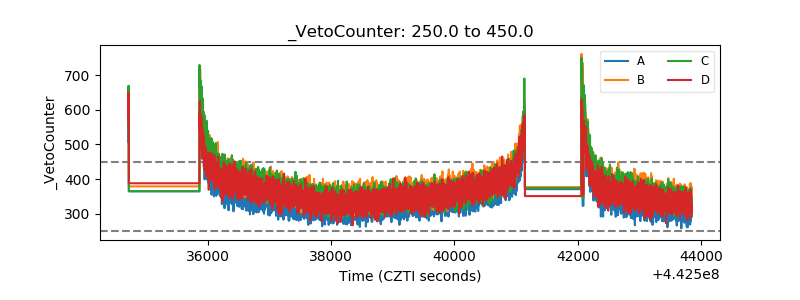 |