| Param | Original file | Final file |
|---|---|---|
| Filename | modeM0/AS1A13_004T13_9000006022_44796cztM0_level2.fits | modeM0/AS1A13_004T13_9000006022_44796cztM0_level2_quad_clean.evt |
| Size (bytes) | 815,771,520 | 95,440,320 |
| Size | 778.0 MB | 91.0 MB |
| Events in quadrant A | 11,989,492 | 454,611 |
| Events in quadrant B | 4,855,817 | 699,129 |
| Events in quadrant C | 3,050,351 | 742,689 |
| Events in quadrant D | 9,758,335 | 504,478 |
| Mode M9 | |||
|---|---|---|---|
| Quadrant | BADHDUFLAG | Total packets | Discarded packets |
| A | 0 | 5 | 0 |
| B | 0 | 5 | 0 |
| C | 0 | 5 | 0 |
| D | 0 | 5 | 0 |
| Mode M0 | |||
|---|---|---|---|
| Quadrant | BADHDUFLAG | Total packets | Discarded packets |
| A | 0 | 40510 | 1 |
| B | 0 | 19351 | 1 |
| C | 0 | 14391 | 2 |
| D | 0 | 33820 | 1 |
| Mode SS | |||
|---|---|---|---|
| Quadrant | BADHDUFLAG | Total packets | Discarded packets |
| A | 0 | 142 | 0 |
| B | 0 | 142 | 0 |
| C | 0 | 142 | 0 |
| D | 0 | 142 | 0 |
| Quadrant | Total seconds | Saturated seconds | Saturation percentage |
|---|---|---|---|
| A | 7016 | 3029 | 43.172748% |
| B | 7017 | 654 | 9.320222% |
| C | 7016 | 26 | 0.370582% |
| D | 7016 | 2065 | 29.432725% |
Noise dominated data is calculated using 1-second bins in cleaned event files. If a bin has >2000 counts, and if more than 50% of those come from <1% of pixels, then it is considered to be noise-dominated and hence unusable.
| Quadrant | # 1 sec bins | Bins with >0 counts | Bins with >2000 counts | High rate bins dominated by noise | Noise dominated (total time) | Noise dominated (detector-on time) | Marked lightcurve |
|---|---|---|---|---|---|---|---|
| A | 7551 | 7016 | 2748 | 2748 | 36.39% | 39.17% | 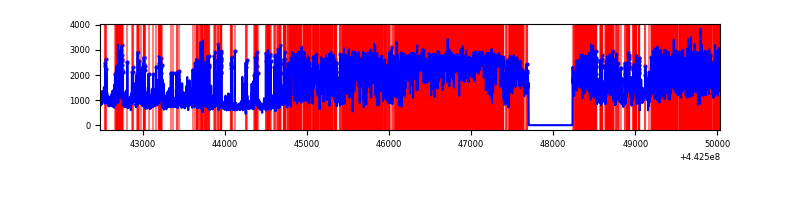 |
| B | 7552 | 7017 | 454 | 454 | 6.01% | 6.47% | 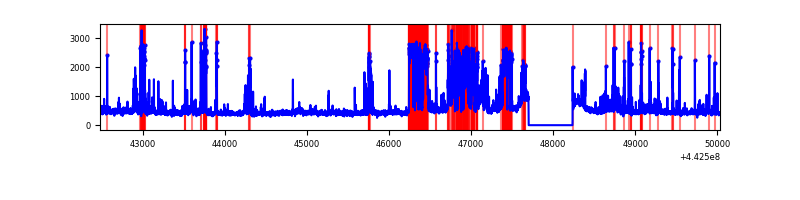 |
| C | 7551 | 7017 | 2 | 2 | 0.03% | 0.03% | 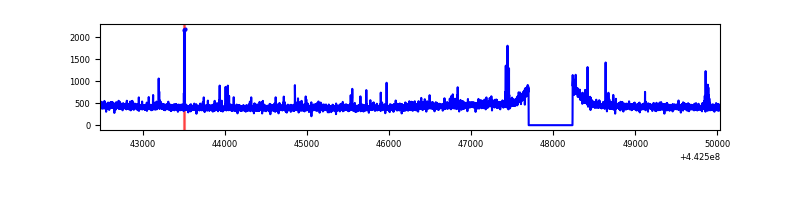 |
| D | 7551 | 7016 | 2156 | 2156 | 28.55% | 30.73% | 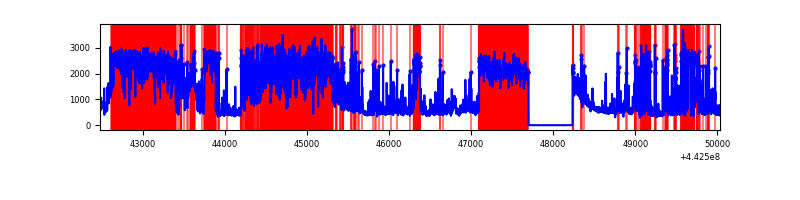 |
Top three noisy pixels from each quadrant. If the there are fewer than three noisy pixels in the level2.evt file, extra rows are filled as -1
| Pixel properties | Quadrant properties | ||||||
|---|---|---|---|---|---|---|---|
| Quadrant | DetID | PixID | Counts | Sigma | Mean | Median | Sigma |
| A | 15 | 223 | 7619172 | 57641.62 | 630 | 615 | 132.2 |
| A | 10 | 83 | 1719776 | 13007.09 | 630 | 615 | 132.2 |
| A | 10 | 248 | 158865 | 1197.31 | 630 | 615 | 132.2 |
| B | 0 | 189 | 1453280 | 9814.03 | 745 | 722 | 148.0 |
| B | 5 | 255 | 115617 | 776.27 | 745 | 722 | 148.0 |
| B | 15 | 36 | 77486 | 518.65 | 745 | 722 | 148.0 |
| C | 1 | 3 | 27135 | 146.2 | 763 | 767 | 180.4 |
| C | 14 | 254 | 18387 | 97.7 | 763 | 767 | 180.4 |
| C | 2 | 14 | 15004 | 78.94 | 763 | 767 | 180.4 |
| D | 13 | 187 | 5060618 | 29125.61 | 687 | 666 | 173.7 |
| D | 7 | 96 | 479495 | 2756.19 | 687 | 666 | 173.7 |
| D | 5 | 235 | 408840 | 2349.49 | 687 | 666 | 173.7 |
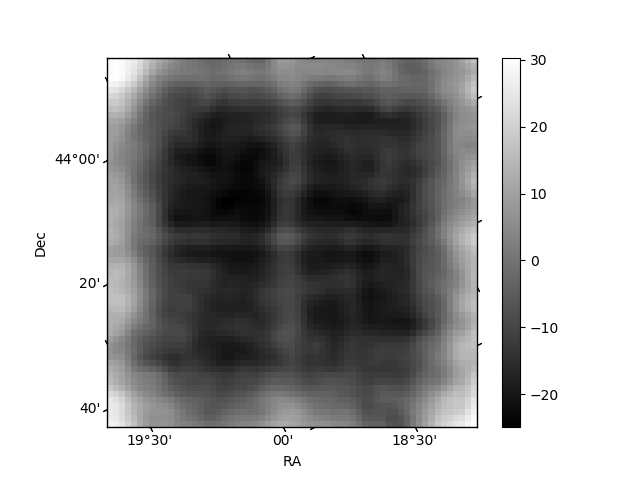
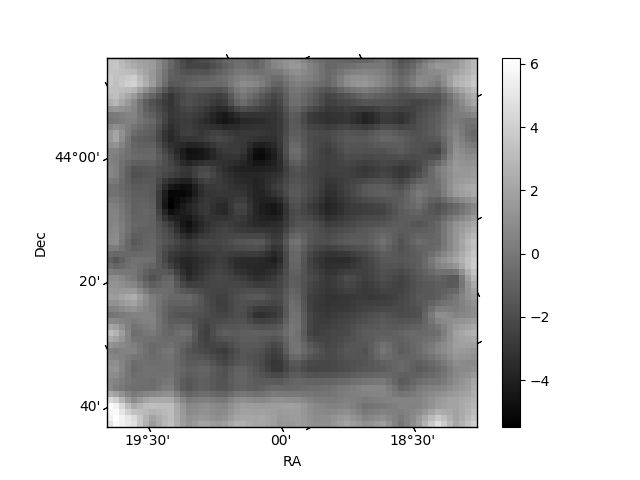
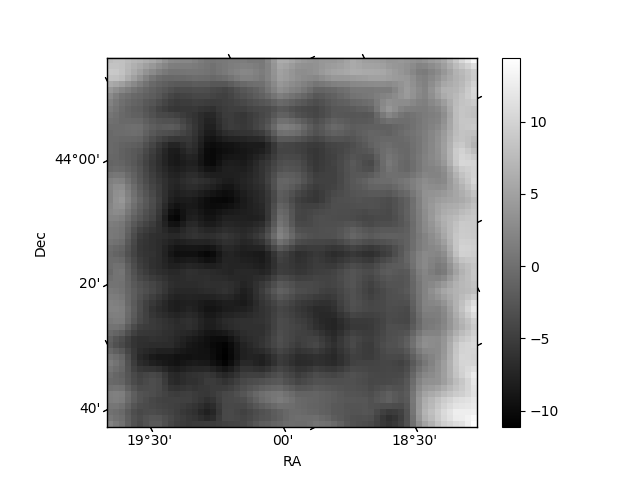
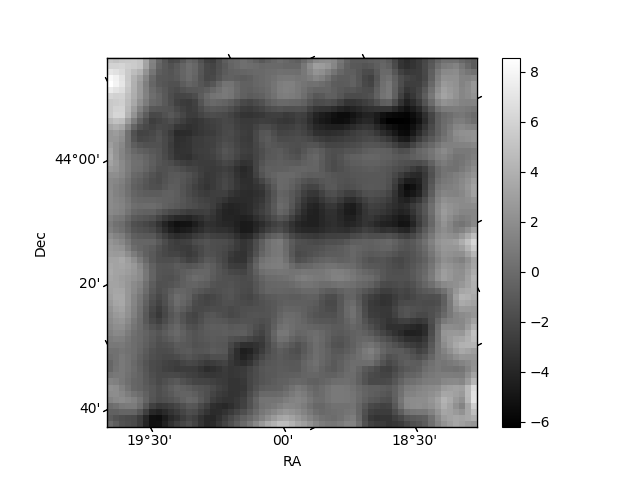
Histogram calculated using DETX and DETY for each event in the final _common_clean file
| Quadrant A | 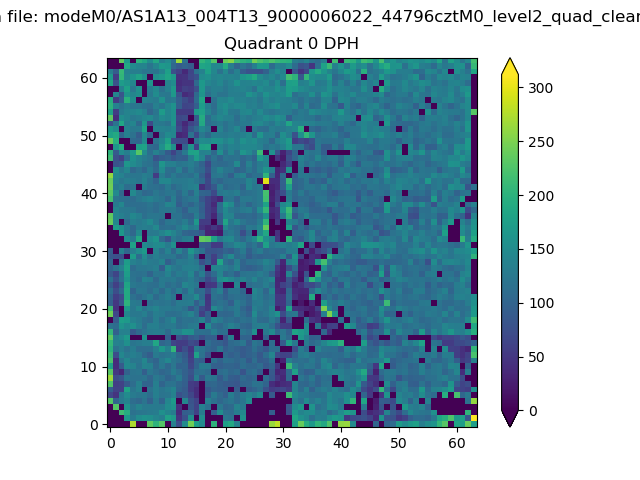 |
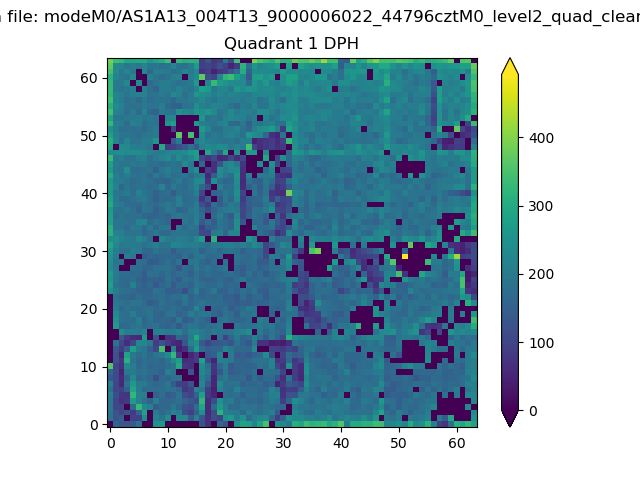 |
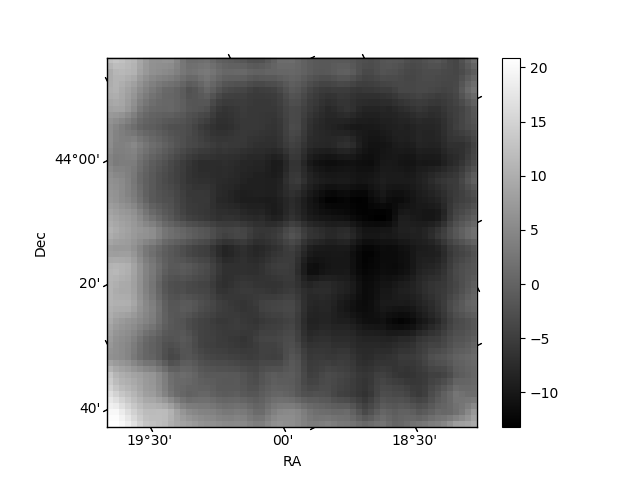
Quadrant B |
|---|---|---|---|
| Quadrant D | 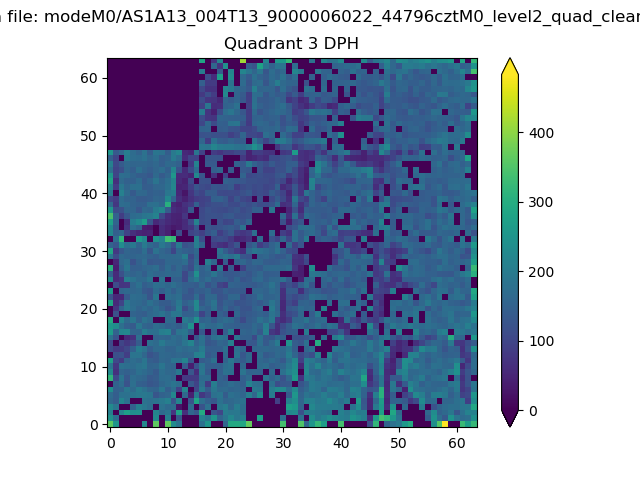 |
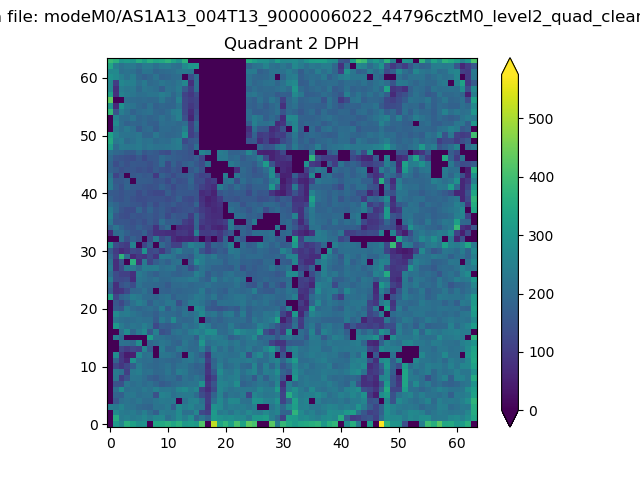 |
Quadrant C |
| Plot type | Count rate plots | Images |
|---|---|---|
| Comparison with Poisson distribution Blue bars denote a histogram of data divided into 1 sec bins. Red curve is a Poisson curve with rate = median count rate of data. |
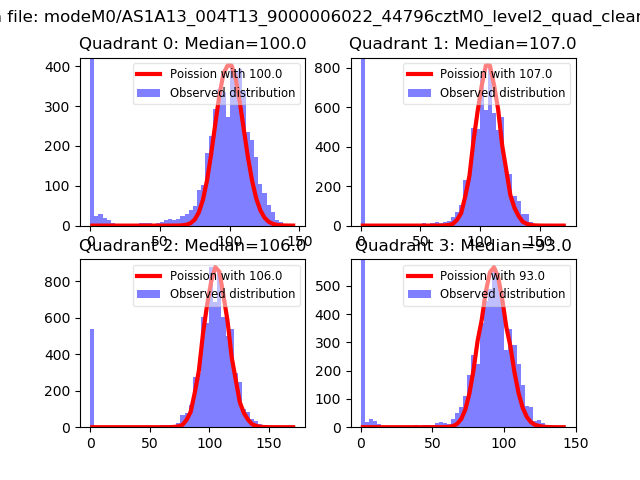 |
 |
| Quadrant-wise count rates Data is divided into 100 sec bins |
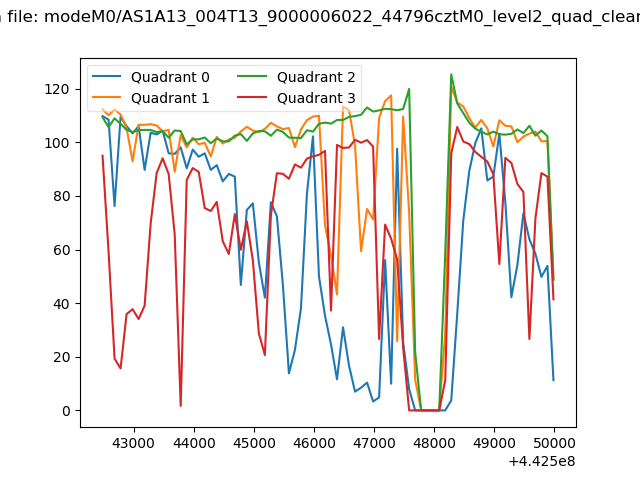 |
|
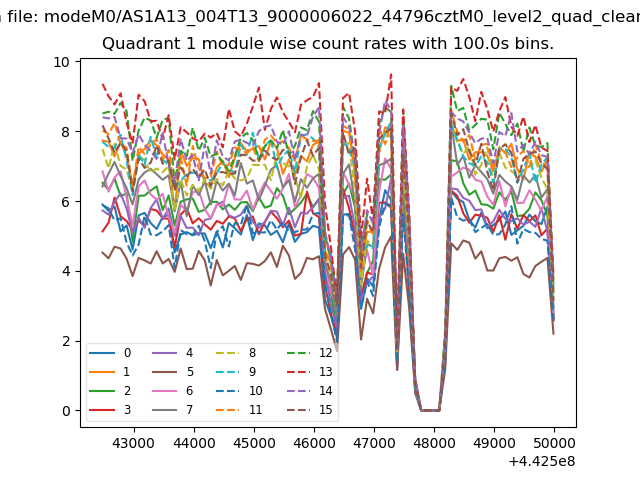
| Module-wise count rates for Quadrant A Data is divided into 100 sec bins |
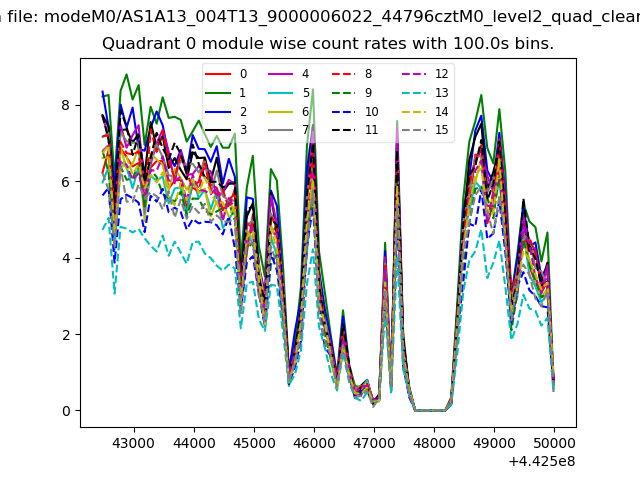 |
 |
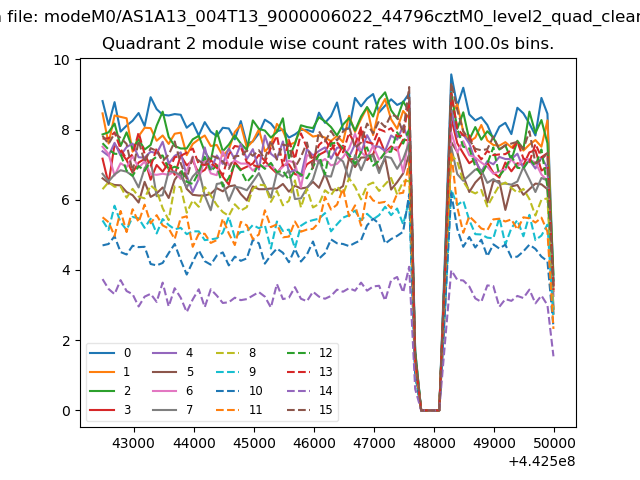
| Module-wise count rates for Quadrant B Data is divided into 100 sec bins |
 |
 |
| Module-wise count rates for Quadrant C Data is divided into 100 sec bins |
 |
 |
| Module-wise count rates for Quadrant D Data is divided into 100 sec bins |
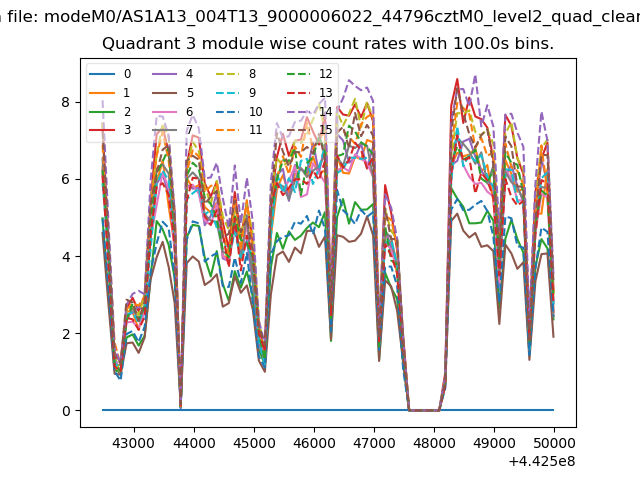 |
 |
| Parameter | Plot |
|---|---|
| CZT HV Monitor | 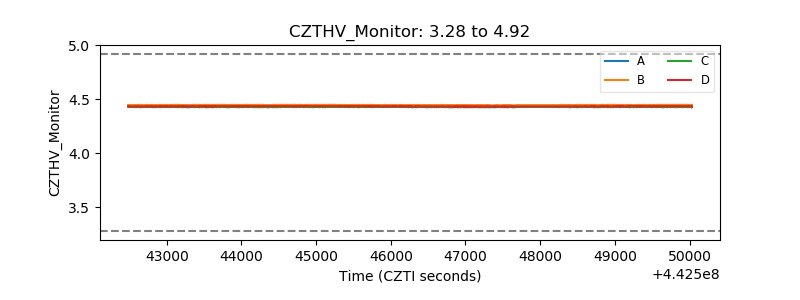 |
| D_VDD | 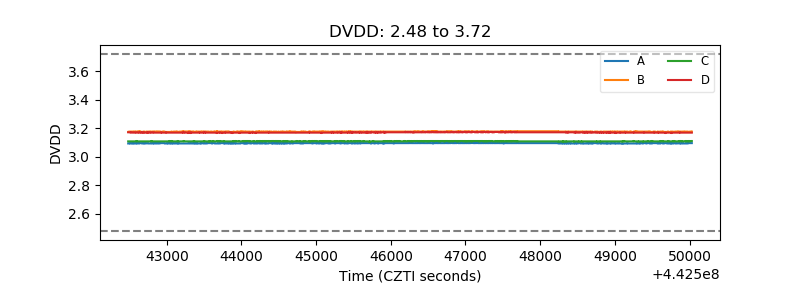 |
| Temperature 1 | 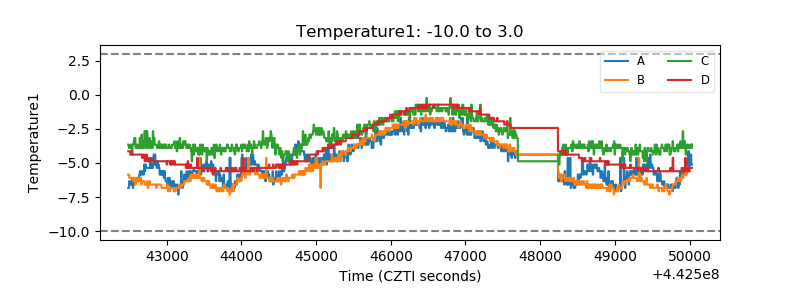 |
| Veto HV Monitor | 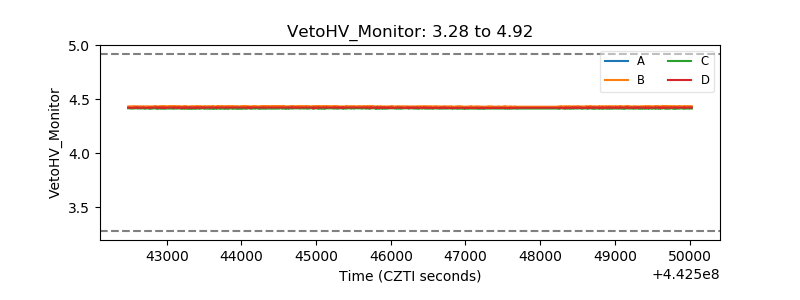 |
| Veto LLD | 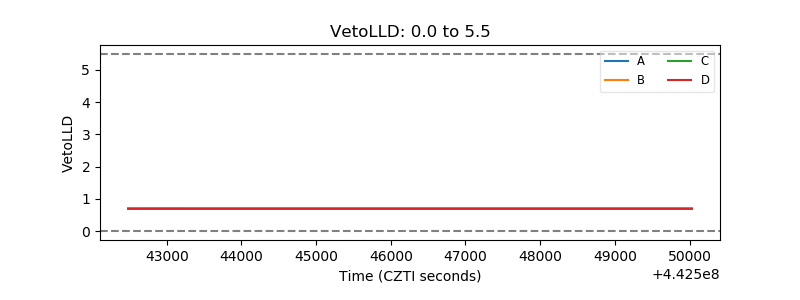 |
| Alpha Counter | 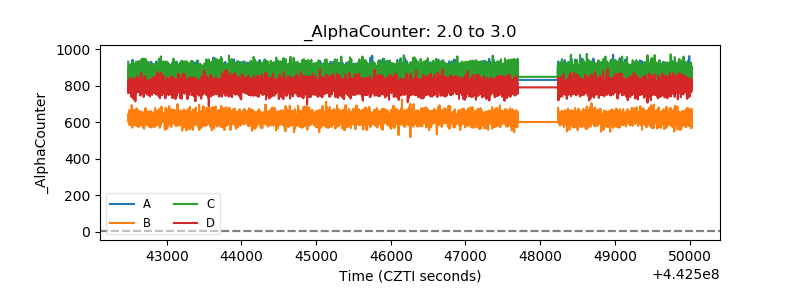 |
| _CPM_Rate | 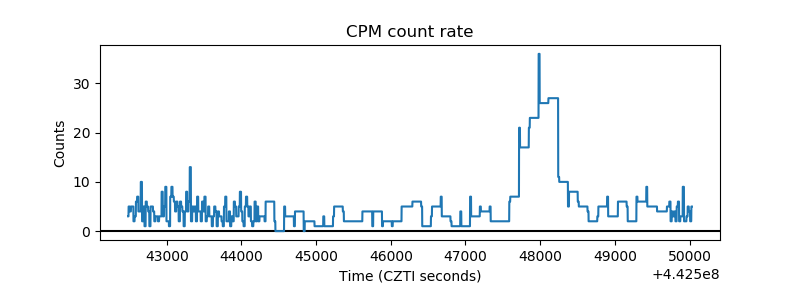 |
| CZT Counter | 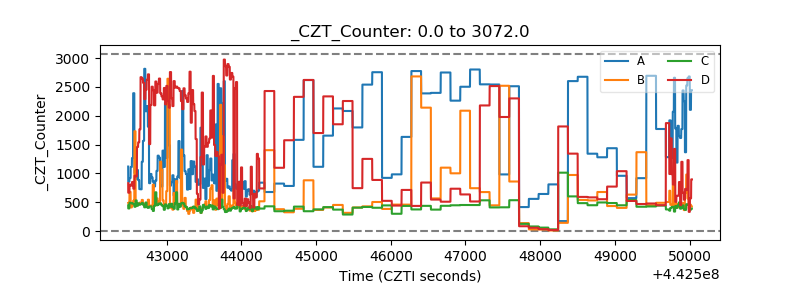 |
| +2.5 Volts monitor | 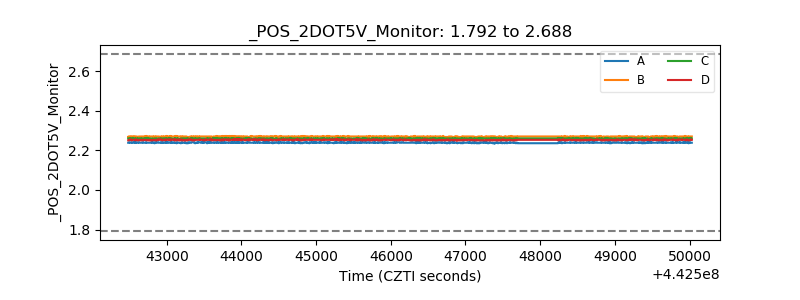 |
| +5 Volts monitor | 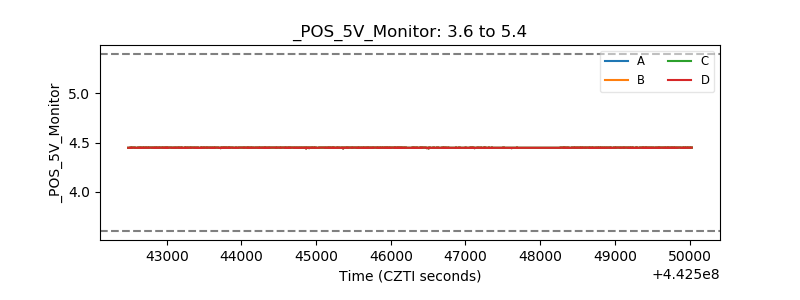 |
| _ROLL_ROT | 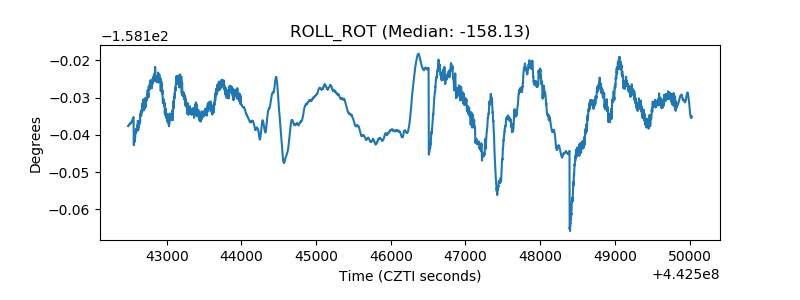 |
| _Roll_DEC | 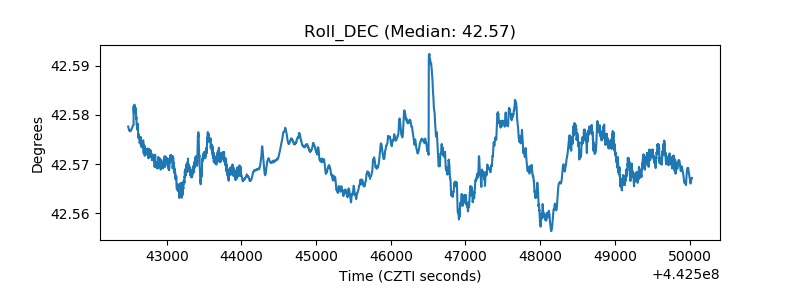 |
| _Roll_RA | 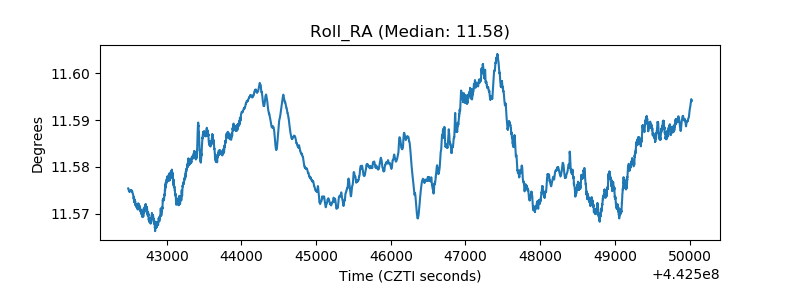 |
| Veto Counter | 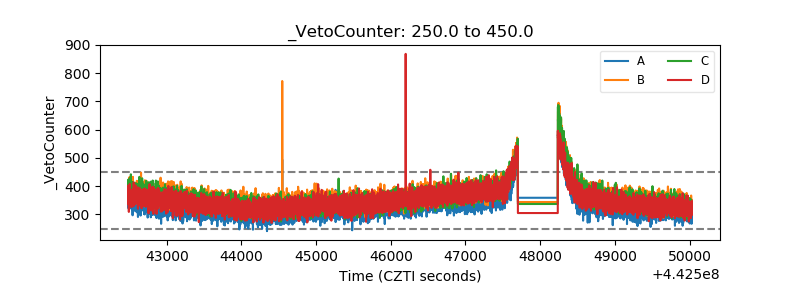 |