| Param | Original file | Final file |
|---|---|---|
| Filename | modeM0/AS1A13_004T13_9000006022_44797cztM0_level2.fits | modeM0/AS1A13_004T13_9000006022_44797cztM0_level2_quad_clean.evt |
| Size (bytes) | 825,393,600 | 115,312,320 |
| Size | 787.2 MB | 110.0 MB |
| Events in quadrant A | 12,848,758 | 605,912 |
| Events in quadrant B | 5,216,952 | 828,149 |
| Events in quadrant C | 3,721,653 | 843,122 |
| Events in quadrant D | 8,149,192 | 659,457 |
| Mode M9 | |||
|---|---|---|---|
| Quadrant | BADHDUFLAG | Total packets | Discarded packets |
| A | 0 | 5 | 0 |
| B | 0 | 5 | 0 |
| C | 0 | 5 | 0 |
| D | 0 | 5 | 0 |
| Mode M0 | |||
|---|---|---|---|
| Quadrant | BADHDUFLAG | Total packets | Discarded packets |
| A | 0 | 43759 | 1 |
| B | 0 | 20996 | 1 |
| C | 0 | 16980 | 1 |
| D | 0 | 29735 | 3 |
| Mode SS | |||
|---|---|---|---|
| Quadrant | BADHDUFLAG | Total packets | Discarded packets |
| A | 0 | 162 | 0 |
| B | 0 | 162 | 0 |
| C | 0 | 162 | 0 |
| D | 0 | 162 | 0 |
| Quadrant | Total seconds | Saturated seconds | Saturation percentage |
|---|---|---|---|
| A | 7973 | 2797 | 35.080898% |
| B | 7973 | 547 | 6.860655% |
| C | 7973 | 56 | 0.702371% |
| D | 7972 | 1354 | 16.984446% |
Noise dominated data is calculated using 1-second bins in cleaned event files. If a bin has >2000 counts, and if more than 50% of those come from <1% of pixels, then it is considered to be noise-dominated and hence unusable.
| Quadrant | # 1 sec bins | Bins with >0 counts | Bins with >2000 counts | High rate bins dominated by noise | Noise dominated (total time) | Noise dominated (detector-on time) | Marked lightcurve |
|---|---|---|---|---|---|---|---|
| A | 8508 | 7973 | 2345 | 2345 | 27.56% | 29.41% | 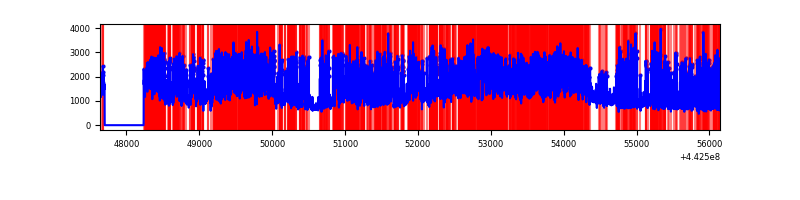 |
| B | 8508 | 7973 | 221 | 221 | 2.60% | 2.77% | 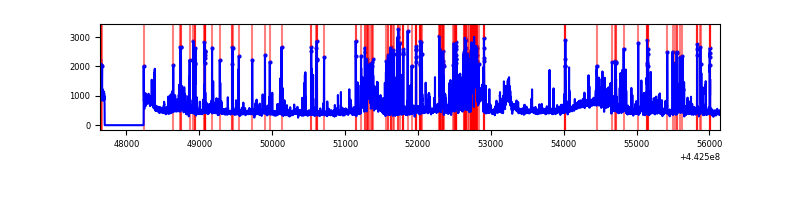 |
| C | 8508 | 7974 | 8 | 8 | 0.09% | 0.10% | 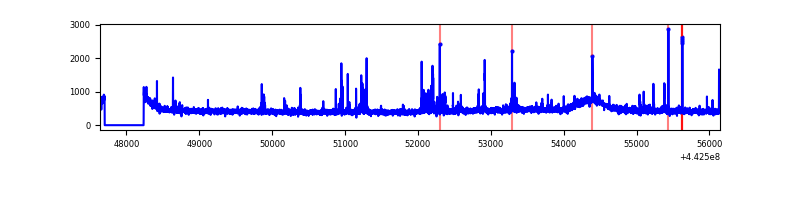 |
| D | 8508 | 7973 | 1162 | 1162 | 13.66% | 14.57% | 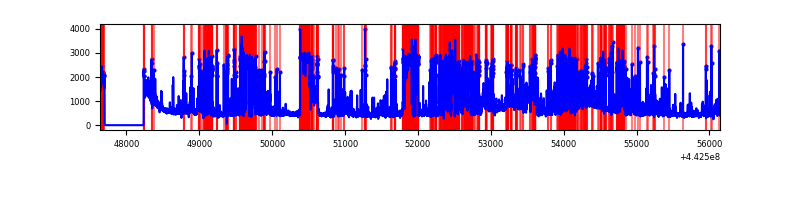 |
Top three noisy pixels from each quadrant. If the there are fewer than three noisy pixels in the level2.evt file, extra rows are filled as -1
| Pixel properties | Quadrant properties | ||||||
|---|---|---|---|---|---|---|---|
| Quadrant | DetID | PixID | Counts | Sigma | Mean | Median | Sigma |
| A | 15 | 223 | 7800141 | 47960.91 | 780 | 760 | 162.6 |
| A | 10 | 83 | 1980416 | 12173.54 | 780 | 760 | 162.6 |
| A | 10 | 248 | 41485 | 250.43 | 780 | 760 | 162.6 |
| B | 0 | 189 | 1196624 | 6751.2 | 888 | 857 | 177.1 |
| B | 5 | 255 | 223169 | 1255.16 | 888 | 857 | 177.1 |
| B | 5 | 172 | 61529 | 342.55 | 888 | 857 | 177.1 |
| C | 14 | 254 | 134490 | 633.0 | 897 | 901 | 211.0 |
| C | 2 | 14 | 41286 | 191.36 | 897 | 901 | 211.0 |
| C | 1 | 3 | 24402 | 111.36 | 897 | 901 | 211.0 |
| D | 13 | 187 | 2657525 | 12956.55 | 819 | 793 | 205.0 |
| D | 5 | 235 | 483045 | 2351.88 | 819 | 793 | 205.0 |
| D | 5 | 171 | 477647 | 2325.56 | 819 | 793 | 205.0 |
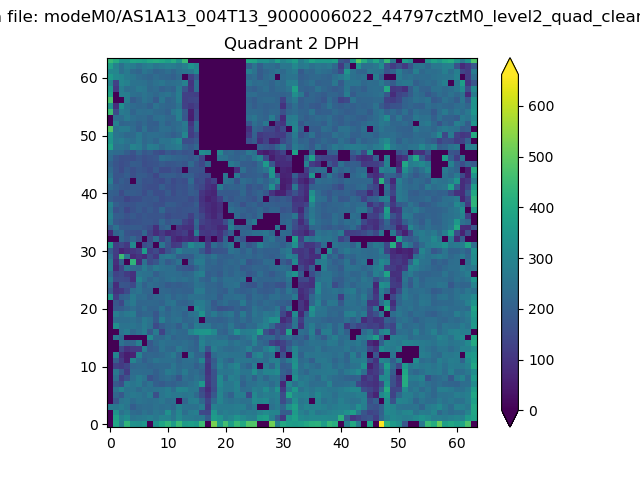
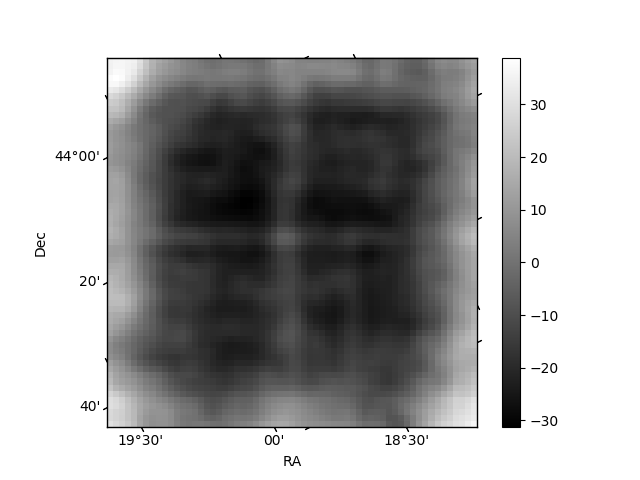
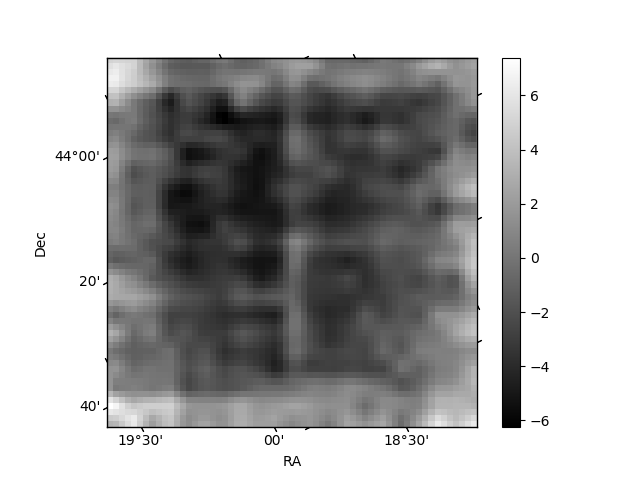
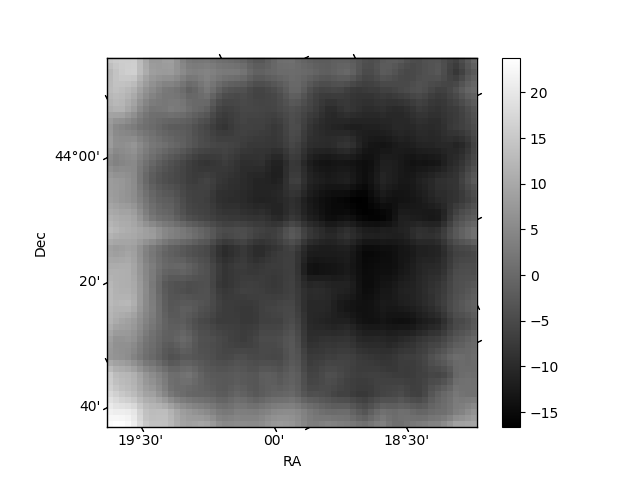
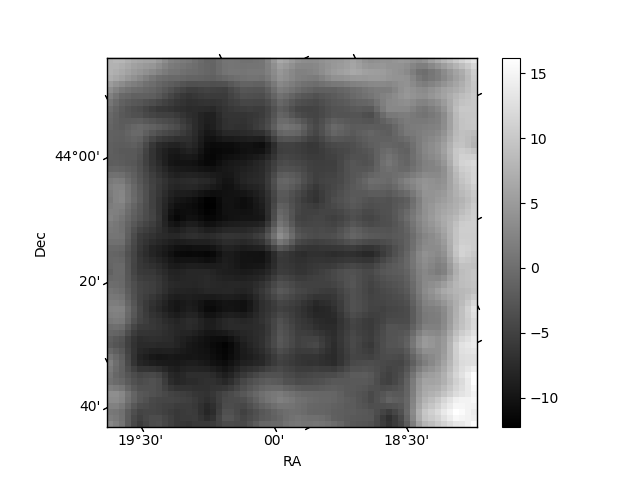
Histogram calculated using DETX and DETY for each event in the final _common_clean file
| Quadrant A | 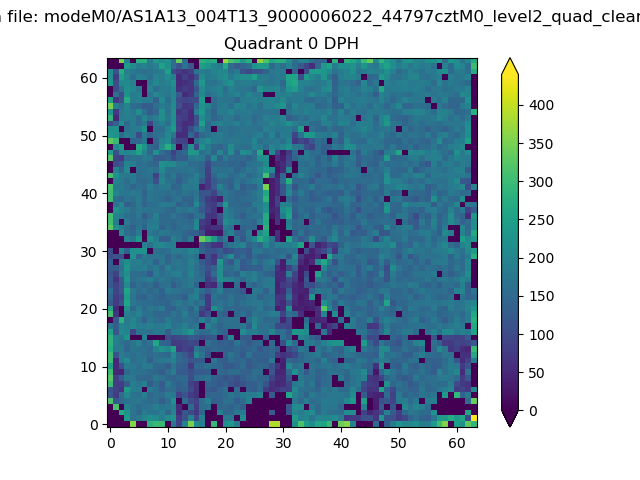 |
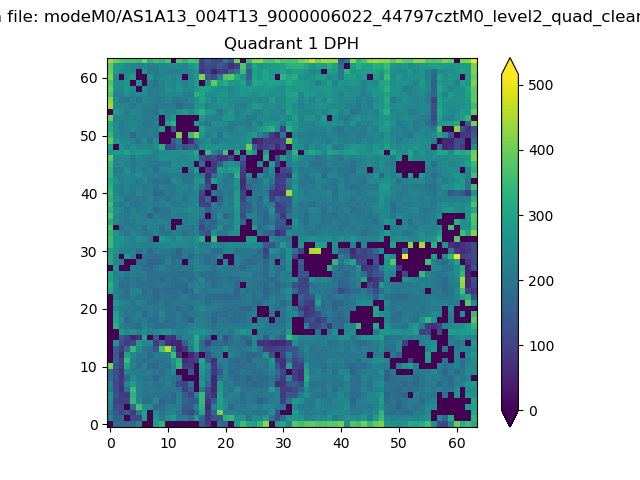 |
Quadrant B |
|---|---|---|---|
| Quadrant D | 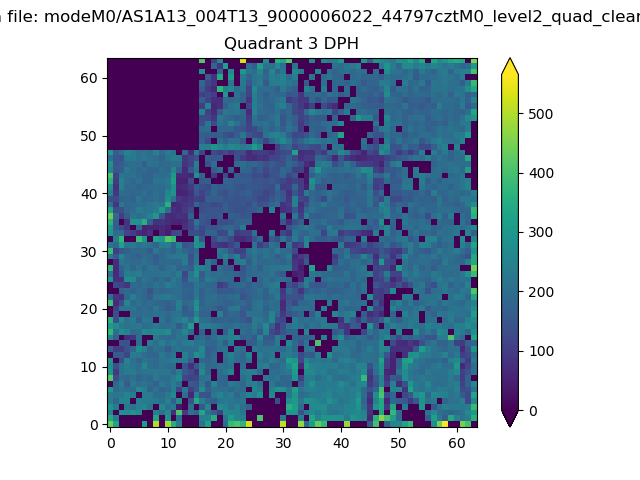 |
 |
Quadrant C |
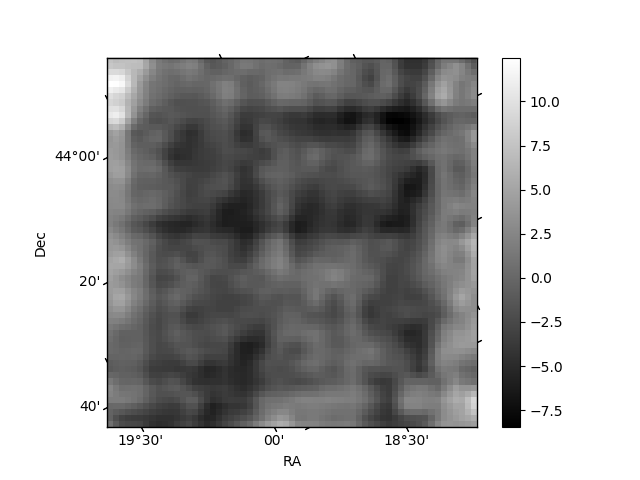
| Plot type | Count rate plots | Images |
|---|---|---|
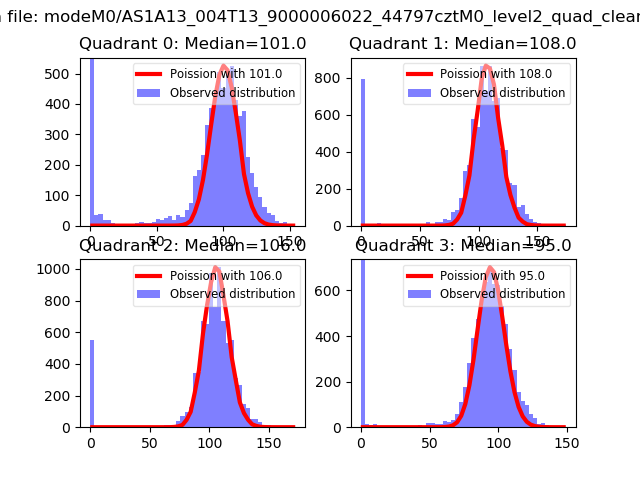
| Comparison with Poisson distribution Blue bars denote a histogram of data divided into 1 sec bins. Red curve is a Poisson curve with rate = median count rate of data. |
 |
 |
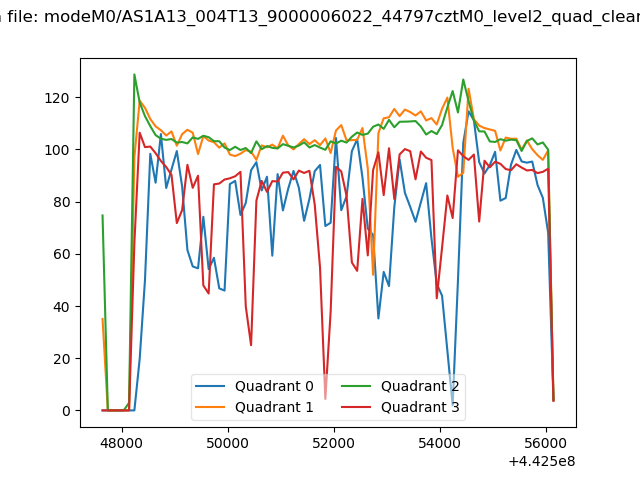
| Quadrant-wise count rates Data is divided into 100 sec bins |
 |
|
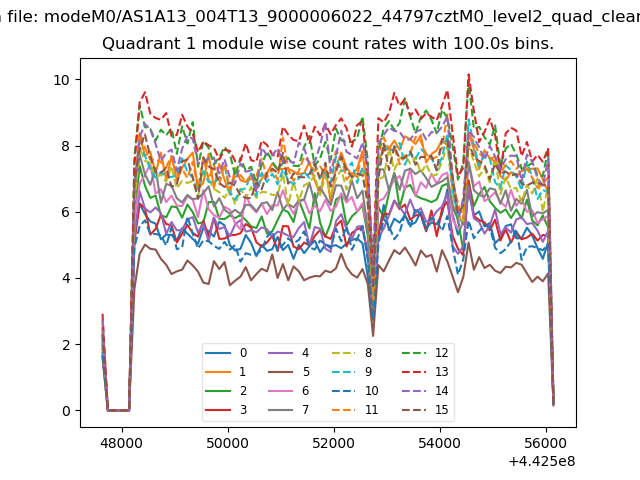
| Module-wise count rates for Quadrant A Data is divided into 100 sec bins |
 |
 |
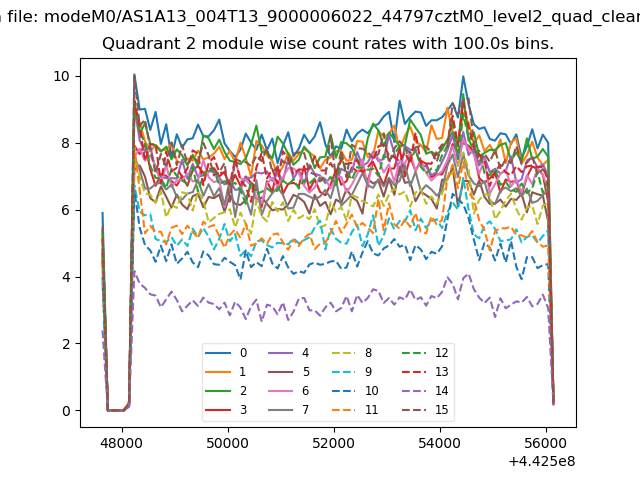
| Module-wise count rates for Quadrant B Data is divided into 100 sec bins |
 |
 |
| Module-wise count rates for Quadrant C Data is divided into 100 sec bins |
 |
 |
| Module-wise count rates for Quadrant D Data is divided into 100 sec bins |
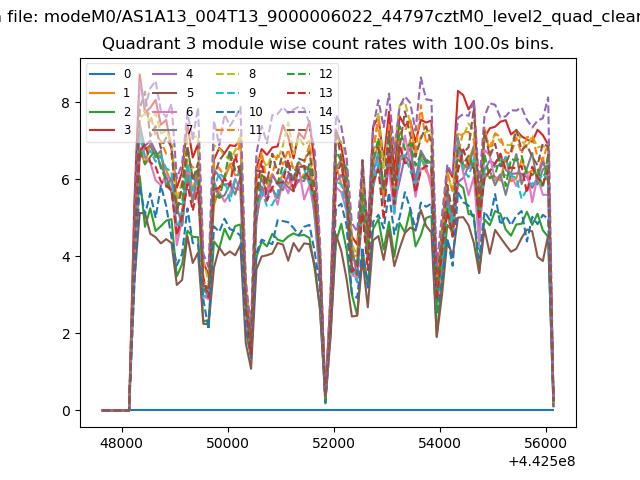 |
 |
| Parameter | Plot |
|---|---|
| CZT HV Monitor | 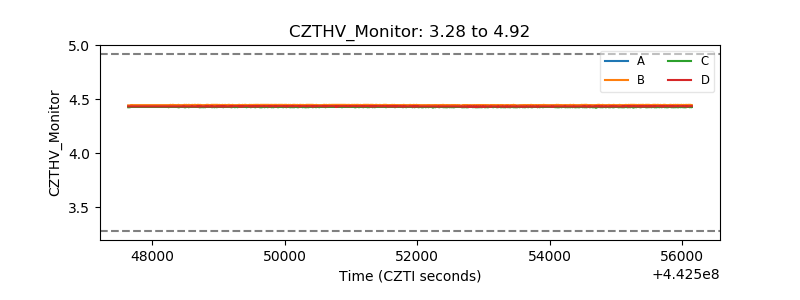 |
| D_VDD | 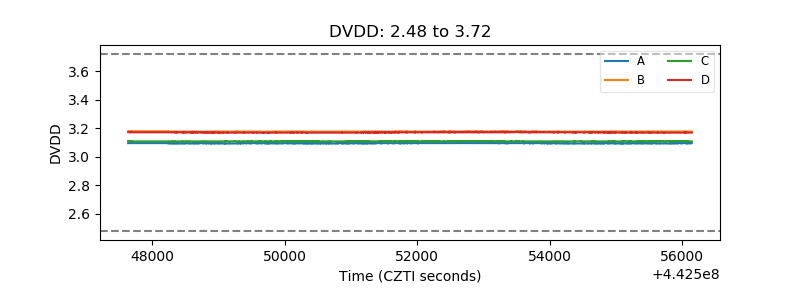 |
| Temperature 1 | 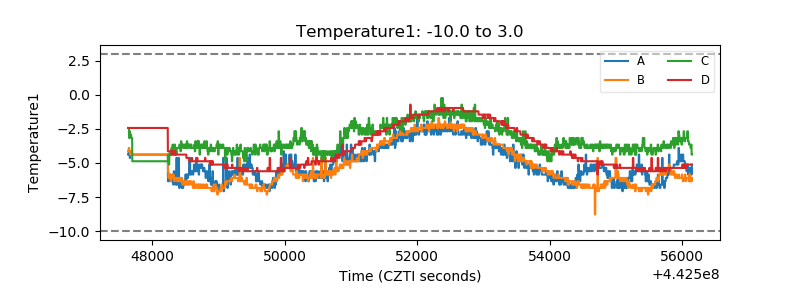 |
| Veto HV Monitor | 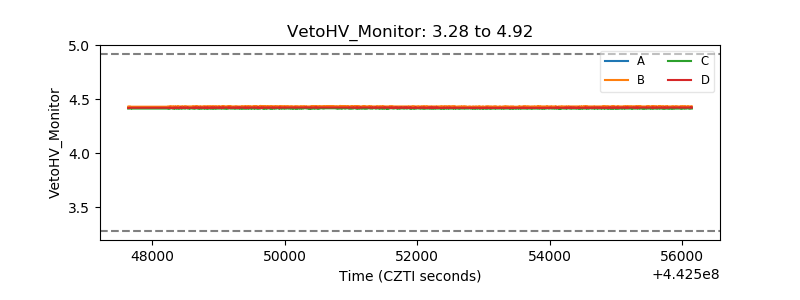 |
| Veto LLD | 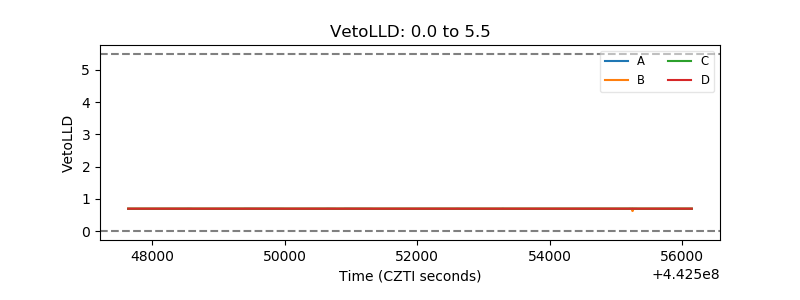 |
| Alpha Counter | 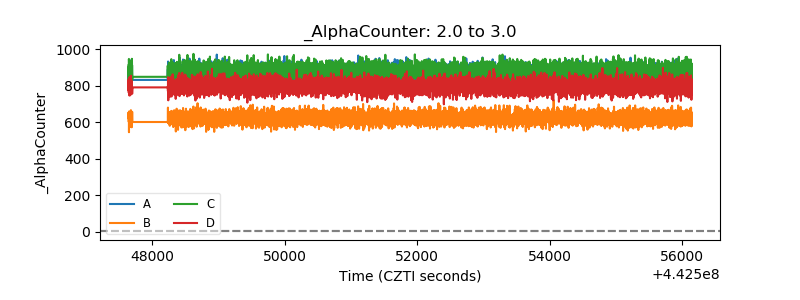 |
| _CPM_Rate | 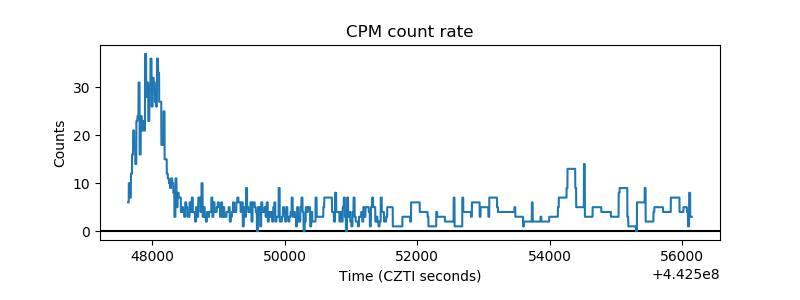 |
| CZT Counter | 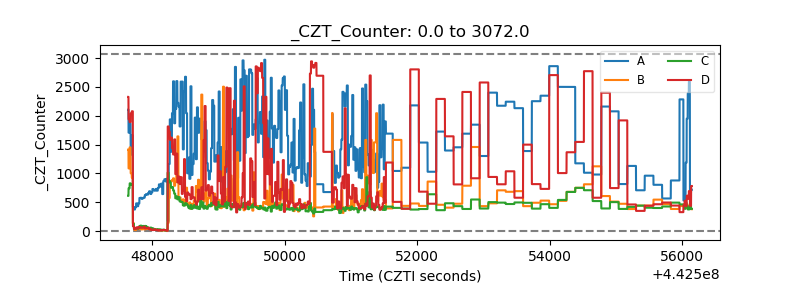 |
| +2.5 Volts monitor | 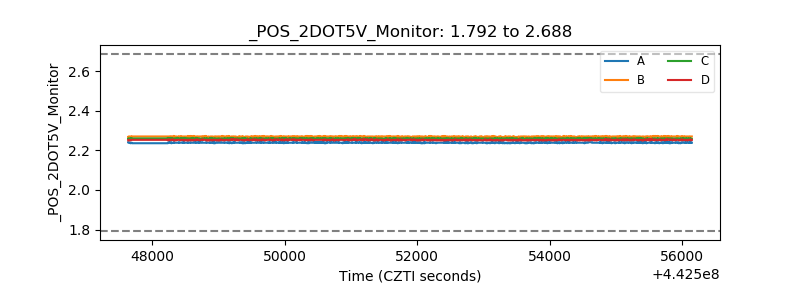 |
| +5 Volts monitor | 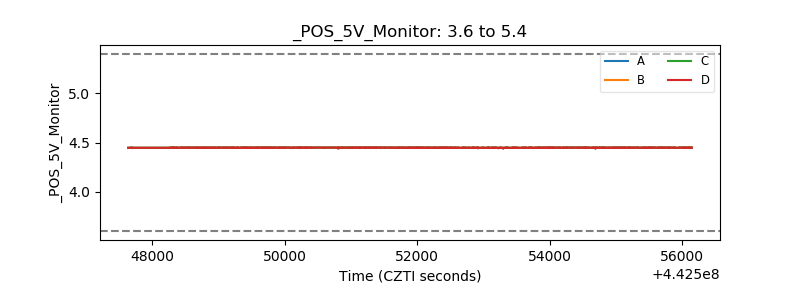 |
| _ROLL_ROT | 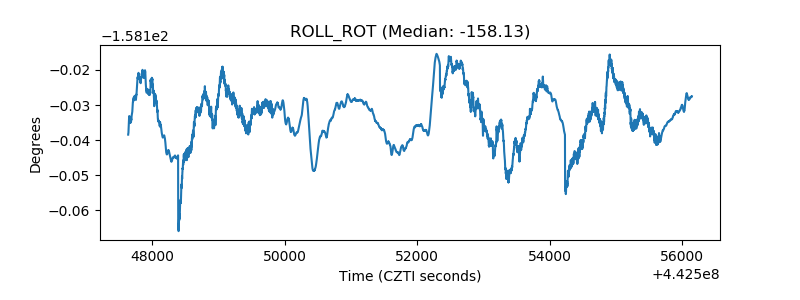 |
| _Roll_DEC | 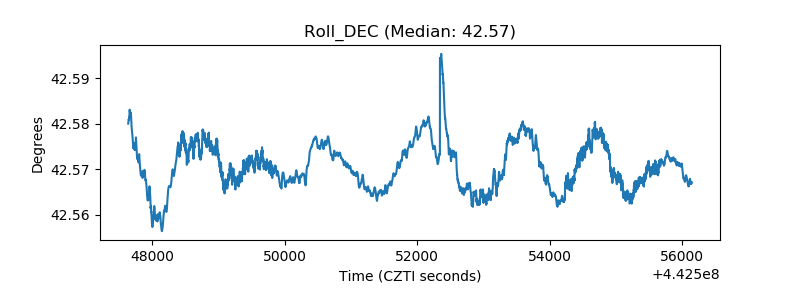 |
| _Roll_RA | 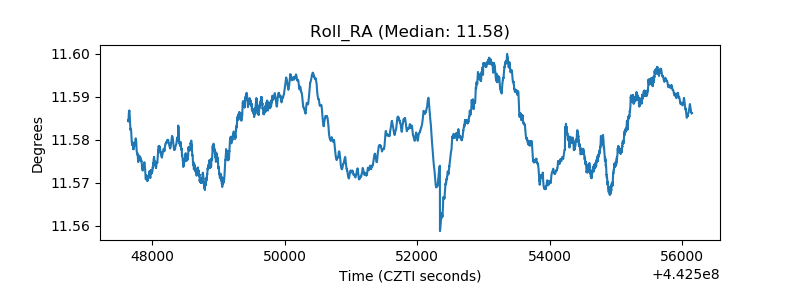 |
| Veto Counter | 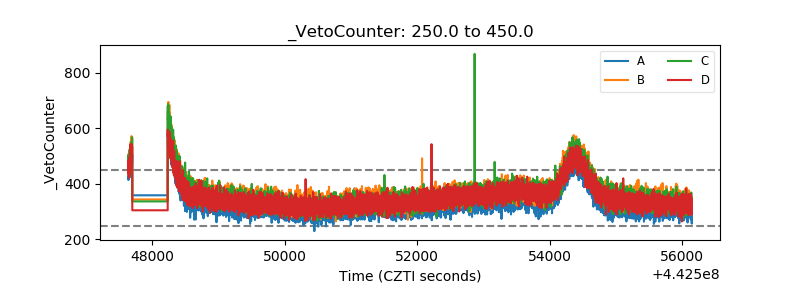 |