| Param | Original file | Final file |
|---|---|---|
| Filename | modeM0/AS1A13_004T13_9000006022_44798cztM0_level2.fits | modeM0/AS1A13_004T13_9000006022_44798cztM0_level2_quad_clean.evt |
| Size (bytes) | 729,610,560 | 115,856,640 |
| Size | 695.8 MB | 110.5 MB |
| Events in quadrant A | 11,642,526 | 594,711 |
| Events in quadrant B | 5,278,179 | 823,774 |
| Events in quadrant C | 3,500,712 | 822,112 |
| Events in quadrant D | 5,975,984 | 718,940 |
| Mode M0 | |||
|---|---|---|---|
| Quadrant | BADHDUFLAG | Total packets | Discarded packets |
| A | 0 | 40181 | 0 |
| B | 0 | 21028 | 0 |
| C | 0 | 16314 | 0 |
| D | 0 | 23302 | 0 |
| Mode SS | |||
|---|---|---|---|
| Quadrant | BADHDUFLAG | Total packets | Discarded packets |
| A | 0 | 158 | 0 |
| B | 0 | 158 | 0 |
| C | 0 | 158 | 0 |
| D | 0 | 158 | 0 |
| Quadrant | Total seconds | Saturated seconds | Saturation percentage |
|---|---|---|---|
| A | 7878 | 2616 | 33.206398% |
| B | 7878 | 395 | 5.013963% |
| C | 7878 | 24 | 0.304646% |
| D | 7878 | 519 | 6.587966% |
Noise dominated data is calculated using 1-second bins in cleaned event files. If a bin has >2000 counts, and if more than 50% of those come from <1% of pixels, then it is considered to be noise-dominated and hence unusable.
| Quadrant | # 1 sec bins | Bins with >0 counts | Bins with >2000 counts | High rate bins dominated by noise | Noise dominated (total time) | Noise dominated (detector-on time) | Marked lightcurve |
|---|---|---|---|---|---|---|---|
| A | 7878 | 7878 | 2337 | 2337 | 29.66% | 29.66% | 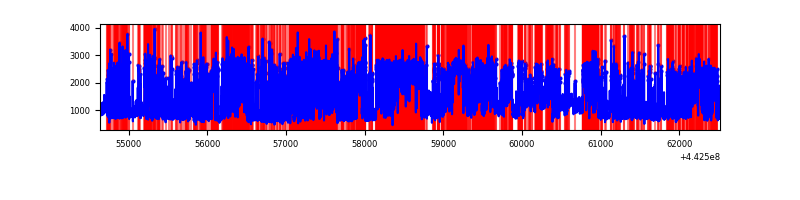 |
| B | 7878 | 7878 | 216 | 216 | 2.74% | 2.74% | 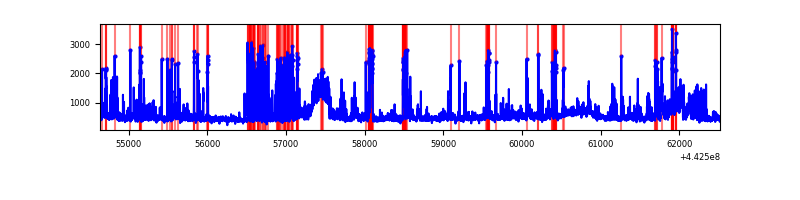 |
| C | 7878 | 7878 | 11 | 11 | 0.14% | 0.14% | 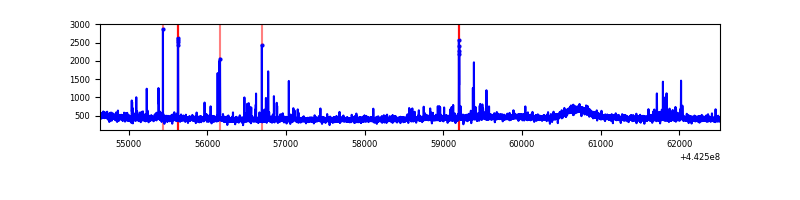 |
| D | 7878 | 7878 | 459 | 459 | 5.83% | 5.83% | 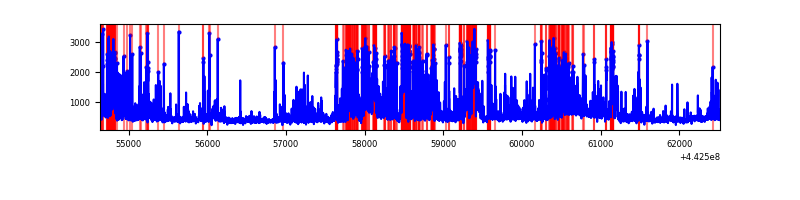 |
Top three noisy pixels from each quadrant. If the there are fewer than three noisy pixels in the level2.evt file, extra rows are filled as -1
| Pixel properties | Quadrant properties | ||||||
|---|---|---|---|---|---|---|---|
| Quadrant | DetID | PixID | Counts | Sigma | Mean | Median | Sigma |
| A | 15 | 223 | 7004050 | 45506.81 | 734 | 717 | 153.9 |
| A | 10 | 83 | 1778769 | 11553.57 | 734 | 717 | 153.9 |
| A | 7 | 3 | 12376 | 75.76 | 734 | 717 | 153.9 |
| B | 0 | 189 | 1543802 | 8990.17 | 857 | 827 | 171.6 |
| B | 5 | 255 | 162200 | 940.24 | 857 | 827 | 171.6 |
| B | 0 | 219 | 60340 | 346.75 | 857 | 827 | 171.6 |
| C | 14 | 254 | 103168 | 505.08 | 859 | 865 | 202.5 |
| C | 1 | 3 | 30532 | 146.47 | 859 | 865 | 202.5 |
| C | 2 | 14 | 14366 | 66.66 | 859 | 865 | 202.5 |
| D | 5 | 235 | 671050 | 3172.44 | 832 | 801 | 211.3 |
| D | 1 | 52 | 639906 | 3025.02 | 832 | 801 | 211.3 |
| D | 2 | 249 | 261344 | 1233.21 | 832 | 801 | 211.3 |
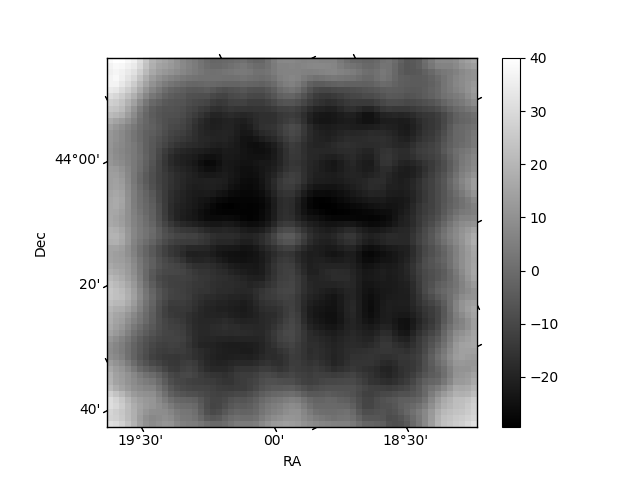
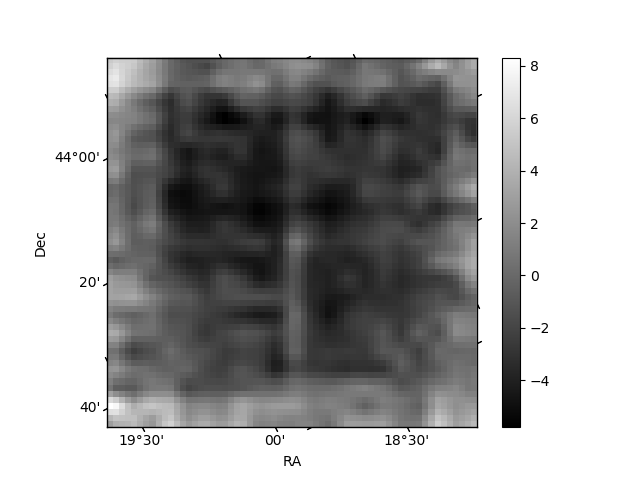
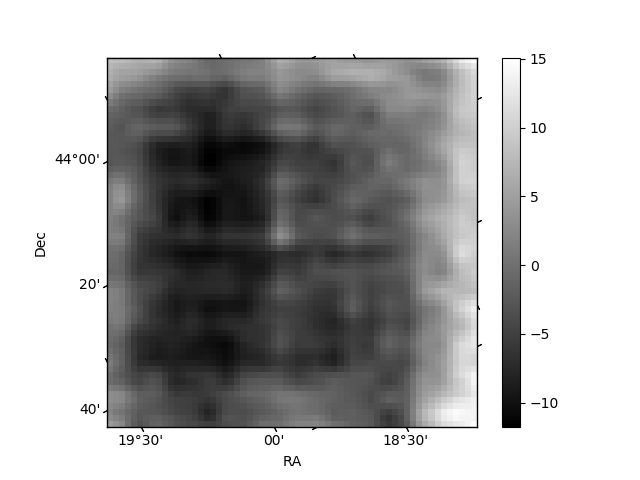
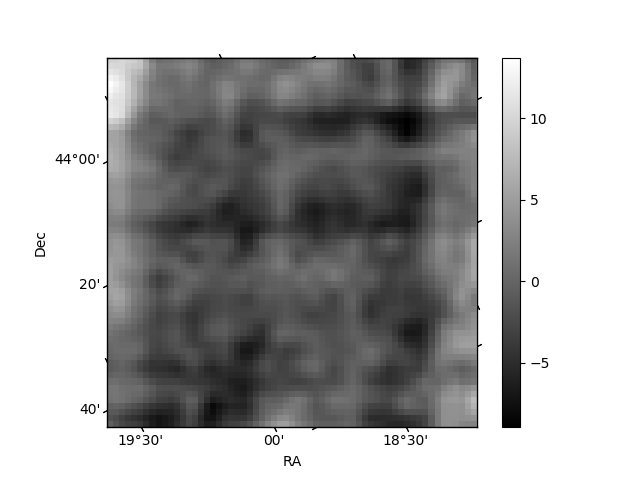
Histogram calculated using DETX and DETY for each event in the final _common_clean file
| Quadrant A | 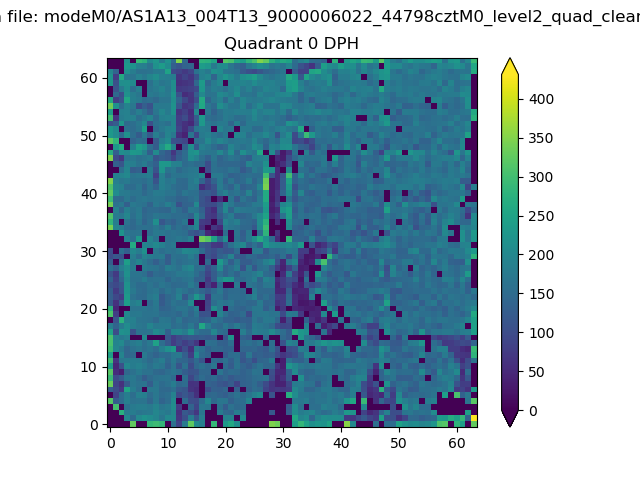 |
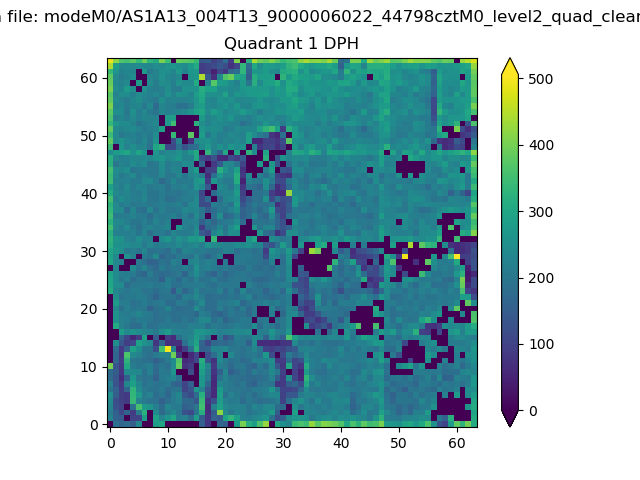 |
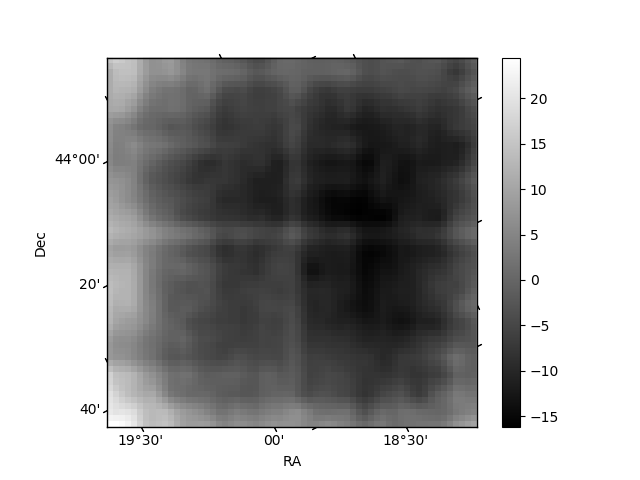
Quadrant B |
|---|---|---|---|
| Quadrant D | 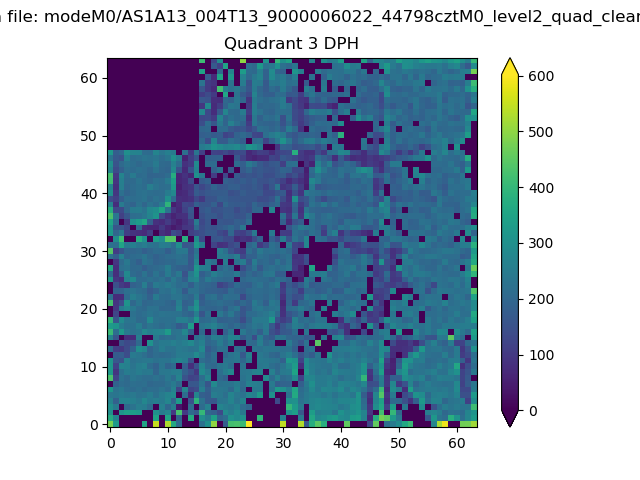 |
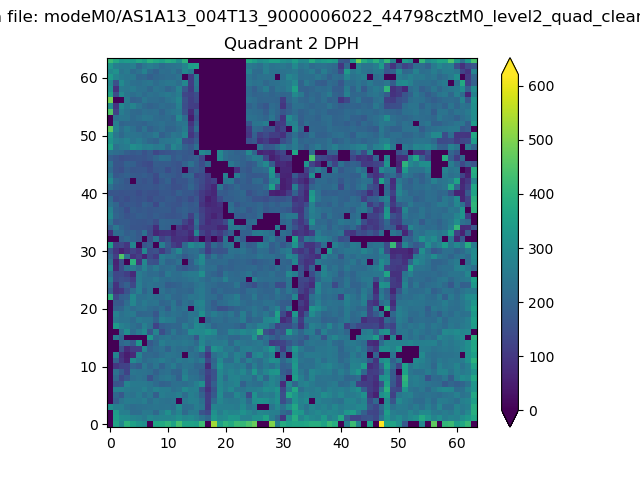 |
Quadrant C |
| Plot type | Count rate plots | Images |
|---|---|---|
| Comparison with Poisson distribution Blue bars denote a histogram of data divided into 1 sec bins. Red curve is a Poisson curve with rate = median count rate of data. |
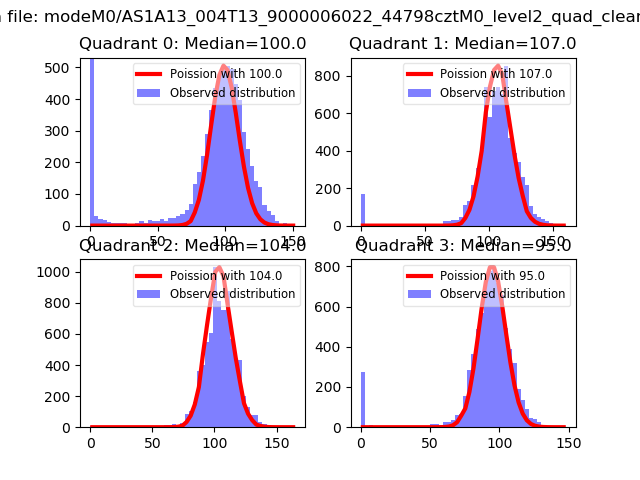 |
 |
| Quadrant-wise count rates Data is divided into 100 sec bins |
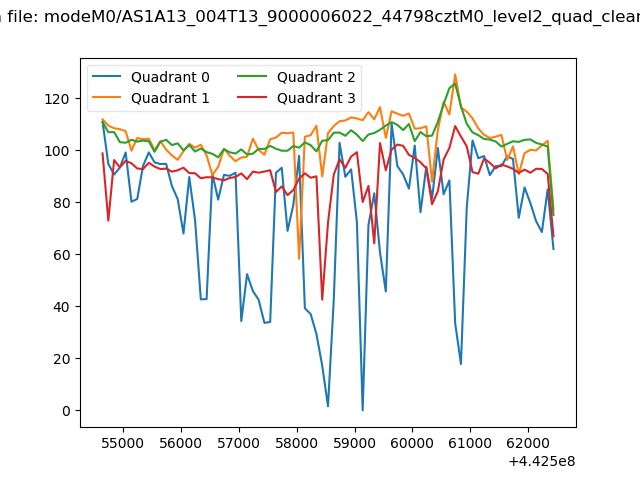 |
|
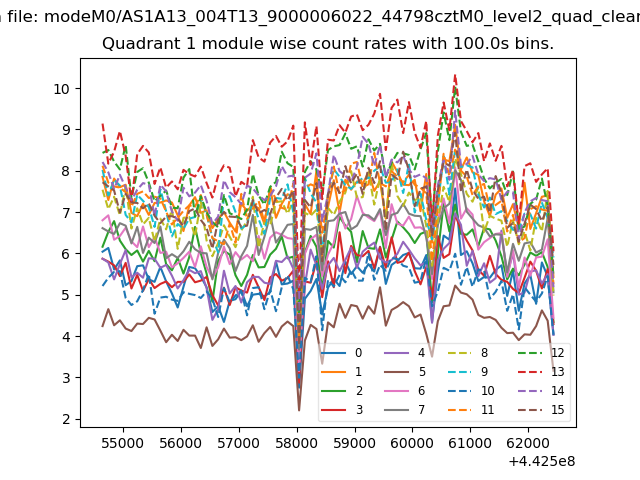
| Module-wise count rates for Quadrant A Data is divided into 100 sec bins |
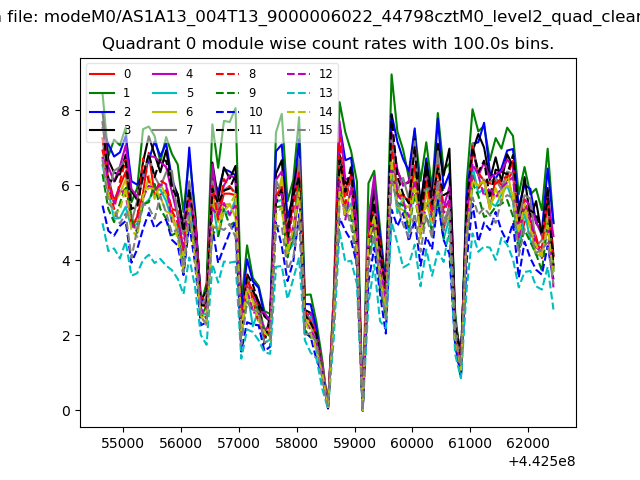 |
 |
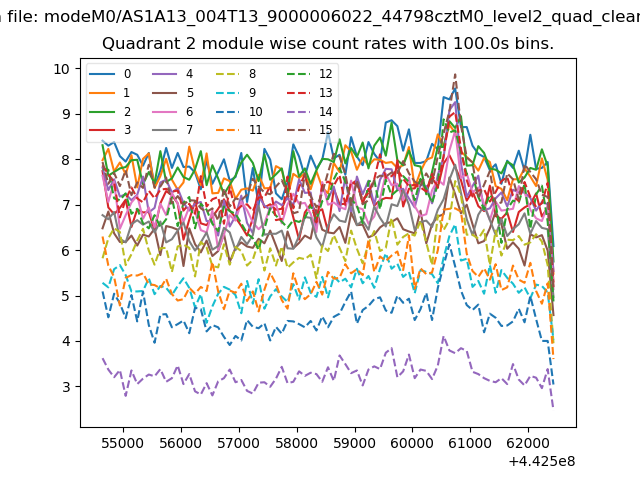
| Module-wise count rates for Quadrant B Data is divided into 100 sec bins |
 |
 |
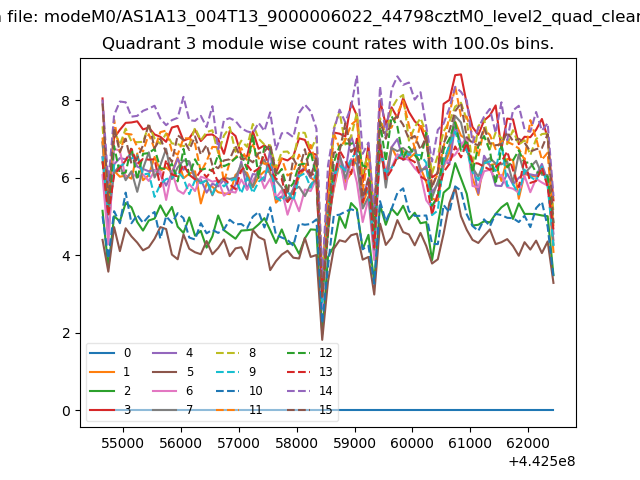
| Module-wise count rates for Quadrant C Data is divided into 100 sec bins |
 |
 |
| Module-wise count rates for Quadrant D Data is divided into 100 sec bins |
 |
 |
| Parameter | Plot |
|---|---|
| CZT HV Monitor | 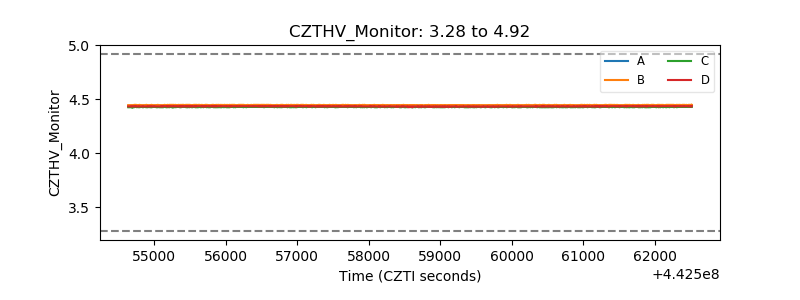 |
| D_VDD | 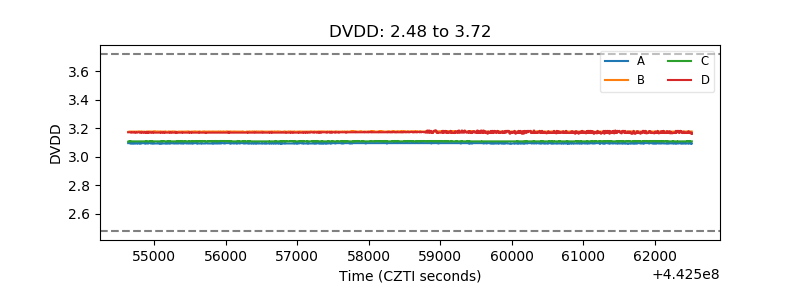 |
| Temperature 1 | 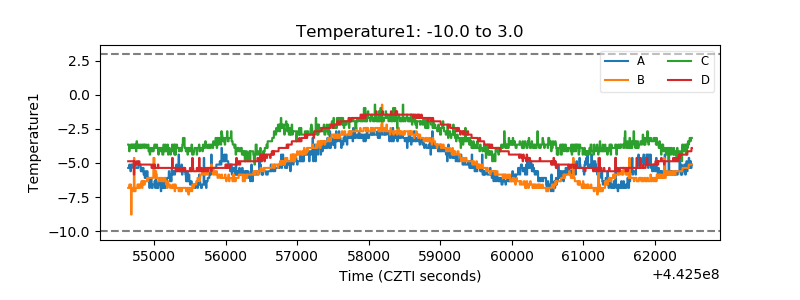 |
| Veto HV Monitor | 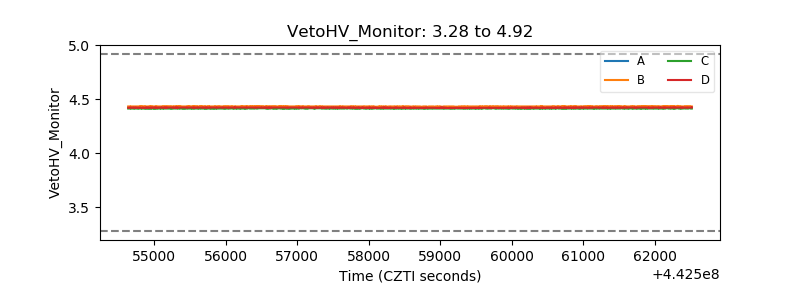 |
| Veto LLD | 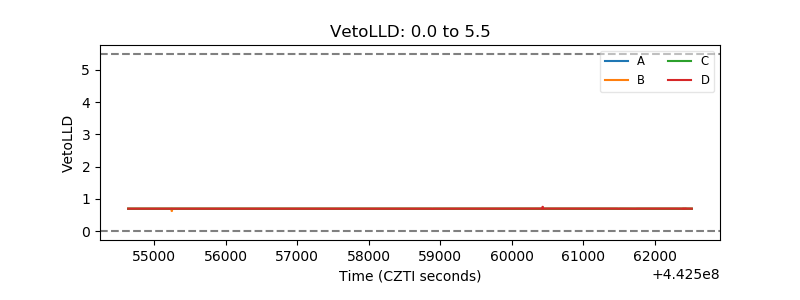 |
| Alpha Counter | 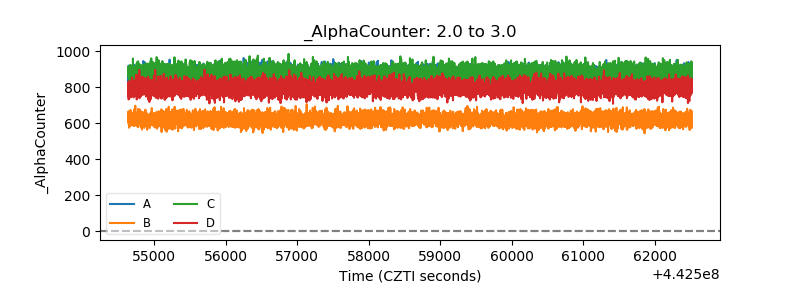 |
| _CPM_Rate | 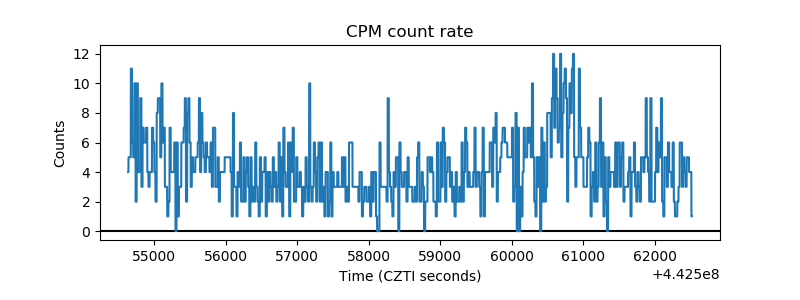 |
| CZT Counter | 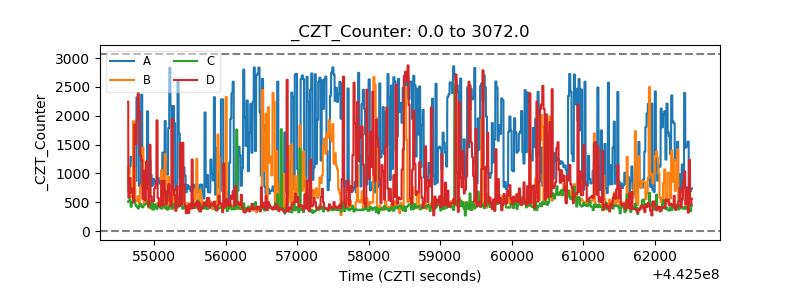 |
| +2.5 Volts monitor | 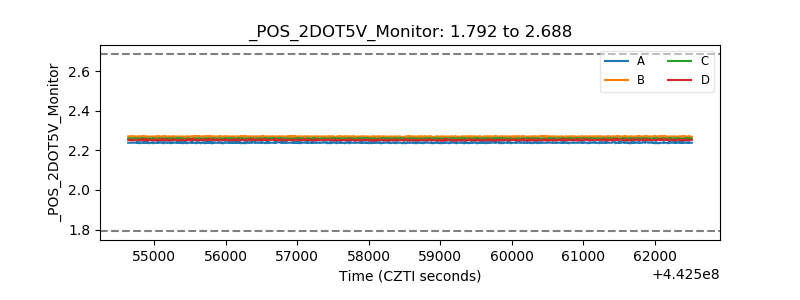 |
| +5 Volts monitor | 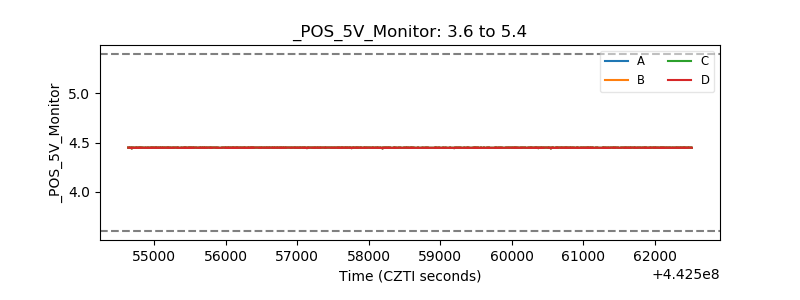 |
| _ROLL_ROT | 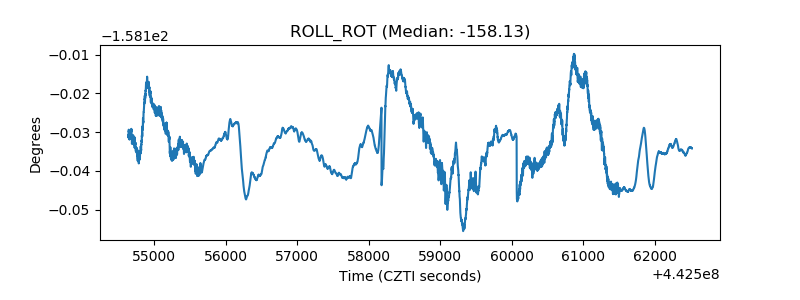 |
| _Roll_DEC | 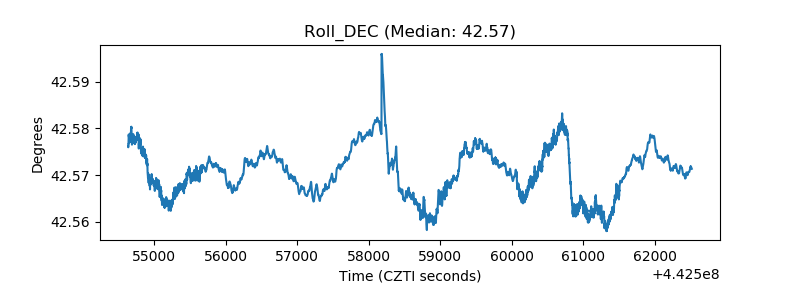 |
| _Roll_RA | 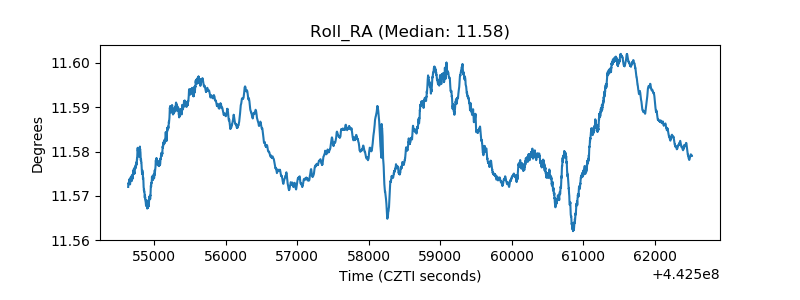 |
| Veto Counter | 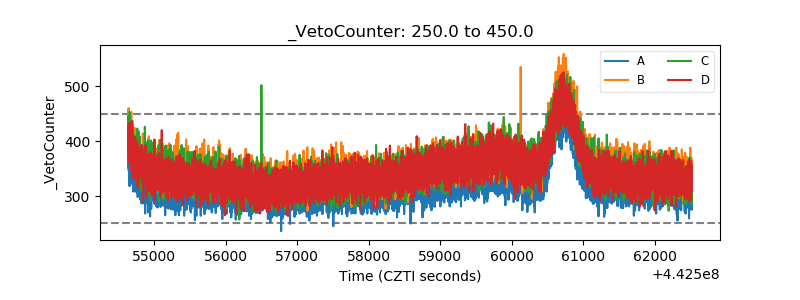 |