| Param | Original file | Final file |
|---|---|---|
| Filename | modeM0/AS1A13_004T13_9000006022_44801cztM0_level2.fits | modeM0/AS1A13_004T13_9000006022_44801cztM0_level2_quad_clean.evt |
| Size (bytes) | 1,684,857,600 | 224,939,520 |
| Size | 1.6 GB | 214.5 MB |
| Events in quadrant A | 30,056,918 | 868,134 |
| Events in quadrant B | 9,336,846 | 1,705,362 |
| Events in quadrant C | 7,552,553 | 1,687,302 |
| Events in quadrant D | 14,152,404 | 1,416,361 |
| Mode M9 | |||
|---|---|---|---|
| Quadrant | BADHDUFLAG | Total packets | Discarded packets |
| A | 0 | 5 | 0 |
| B | 0 | 5 | 0 |
| C | 0 | 5 | 0 |
| D | 0 | 5 | 0 |
| Mode M0 | |||
|---|---|---|---|
| Quadrant | BADHDUFLAG | Total packets | Discarded packets |
| A | 0 | 100682 | 18 |
| B | 0 | 39169 | 2 |
| C | 0 | 34978 | 2 |
| D | 0 | 53452 | 2 |
| Mode SS | |||
|---|---|---|---|
| Quadrant | BADHDUFLAG | Total packets | Discarded packets |
| A | 0 | 332 | 0 |
| B | 0 | 332 | 0 |
| C | 0 | 332 | 0 |
| D | 0 | 332 | 0 |
| Quadrant | Total seconds | Saturated seconds | Saturation percentage |
|---|---|---|---|
| A | 16417 | 8771 | 53.426326% |
| B | 16419 | 732 | 4.458250% |
| C | 16419 | 229 | 1.394726% |
| D | 16419 | 1660 | 10.110238% |
Noise dominated data is calculated using 1-second bins in cleaned event files. If a bin has >2000 counts, and if more than 50% of those come from <1% of pixels, then it is considered to be noise-dominated and hence unusable.
| Quadrant | # 1 sec bins | Bins with >0 counts | Bins with >2000 counts | High rate bins dominated by noise | Noise dominated (total time) | Noise dominated (detector-on time) | Marked lightcurve |
|---|---|---|---|---|---|---|---|
| A | 16878 | 16417 | 7921 | 7921 | 46.93% | 48.25% | 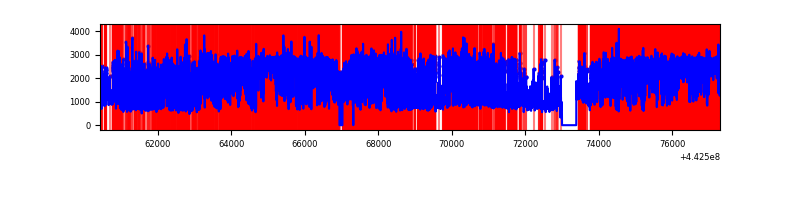 |
| B | 16879 | 16419 | 200 | 200 | 1.18% | 1.22% | 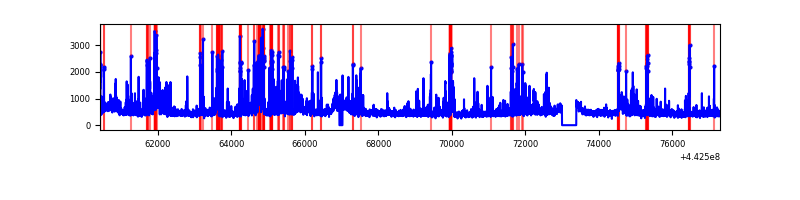 |
| C | 16879 | 16420 | 61 | 61 | 0.36% | 0.37% | 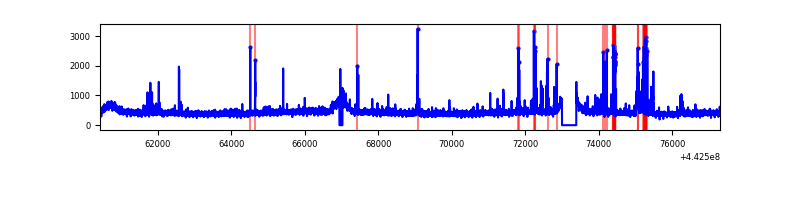 |
| D | 16879 | 16421 | 1282 | 1282 | 7.60% | 7.81% | 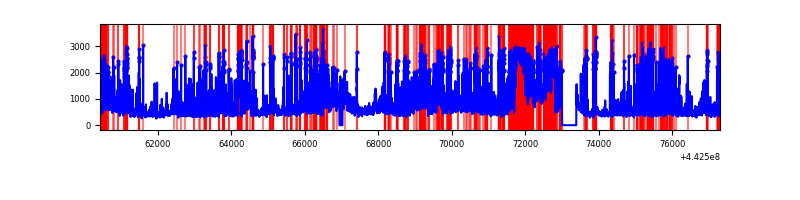 |
Top three noisy pixels from each quadrant. If the there are fewer than three noisy pixels in the level2.evt file, extra rows are filled as -1
| Pixel properties | Quadrant properties | ||||||
|---|---|---|---|---|---|---|---|
| Quadrant | DetID | PixID | Counts | Sigma | Mean | Median | Sigma |
| A | 15 | 223 | 21269230 | 74818.14 | 1357 | 1325 | 284.3 |
| A | 10 | 83 | 3412068 | 11998.62 | 1357 | 1325 | 284.3 |
| A | 7 | 3 | 46941 | 160.47 | 1357 | 1325 | 284.3 |
| B | 0 | 189 | 1341345 | 3770.44 | 1798 | 1737 | 355.3 |
| B | 5 | 255 | 275055 | 769.28 | 1798 | 1737 | 355.3 |
| B | 5 | 172 | 194625 | 542.9 | 1798 | 1737 | 355.3 |
| C | 14 | 254 | 450920 | 1066.33 | 1793 | 1797 | 421.2 |
| C | 1 | 3 | 51284 | 117.49 | 1793 | 1797 | 421.2 |
| C | 12 | 2 | 38265 | 86.58 | 1793 | 1797 | 421.2 |
| D | 13 | 187 | 3664978 | 8390.3 | 1726 | 1668 | 436.6 |
| D | 5 | 235 | 868865 | 1986.19 | 1726 | 1668 | 436.6 |
| D | 2 | 249 | 838838 | 1917.42 | 1726 | 1668 | 436.6 |
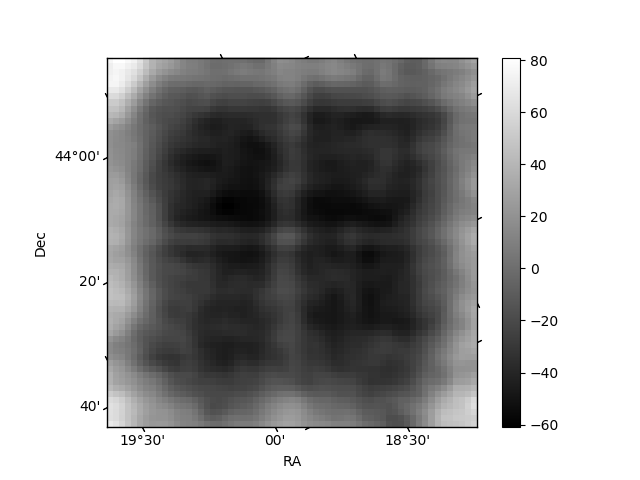
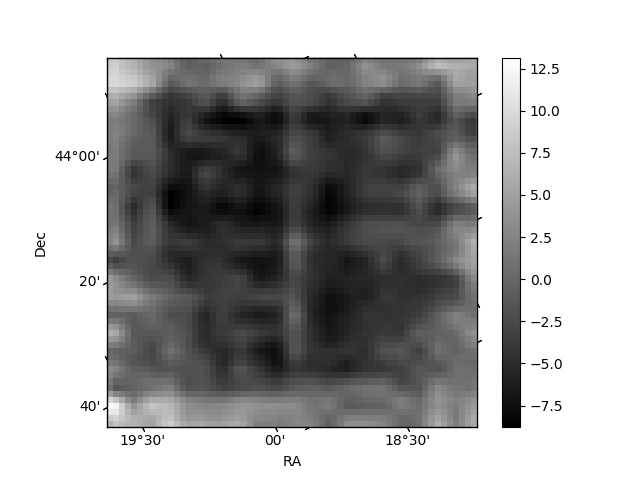
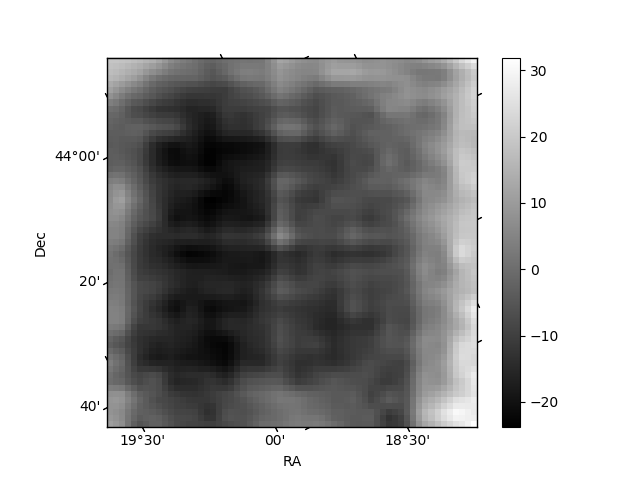
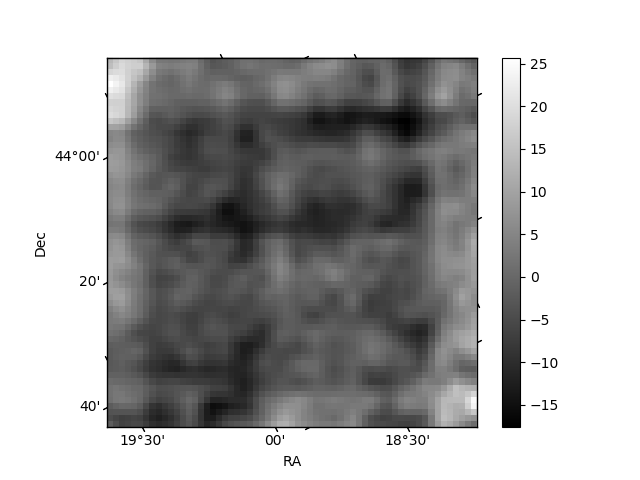
Histogram calculated using DETX and DETY for each event in the final _common_clean file
| Quadrant A | 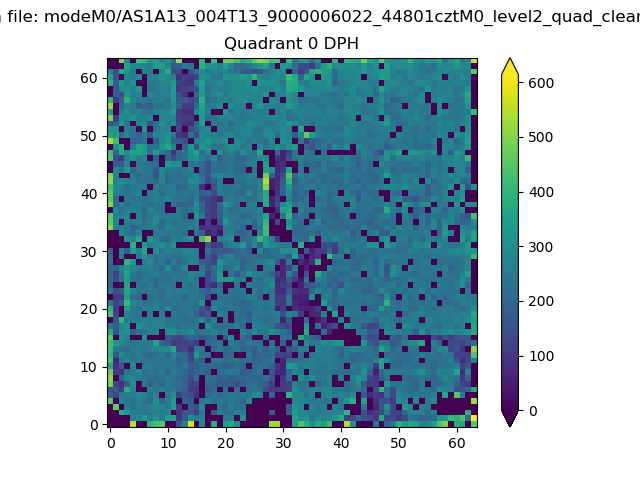 |
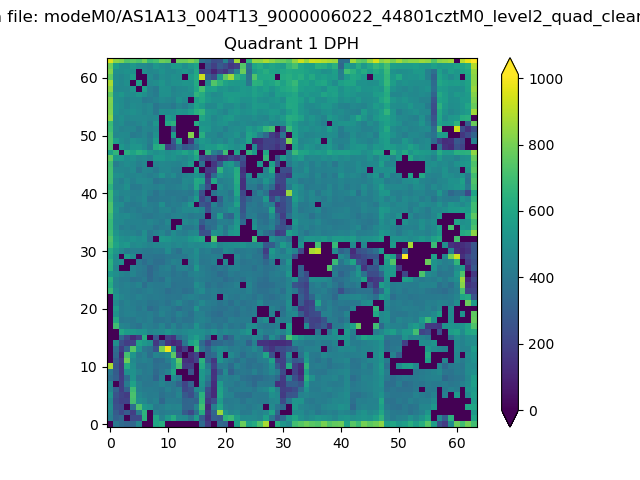 |
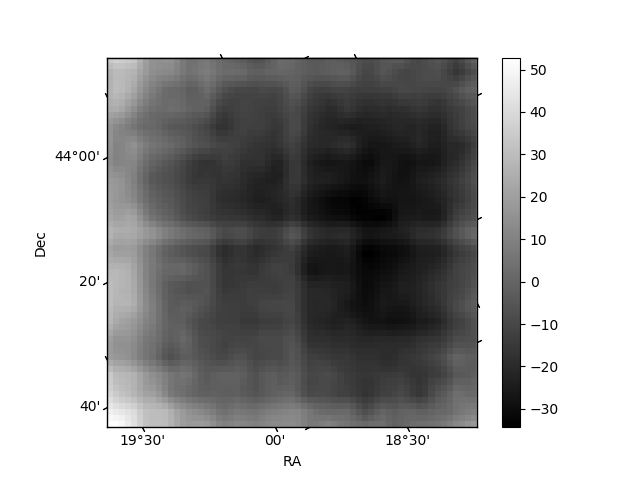
Quadrant B |
|---|---|---|---|
| Quadrant D | 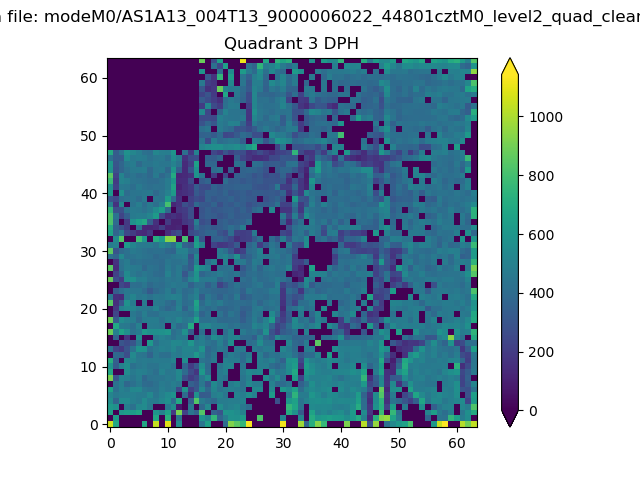 |
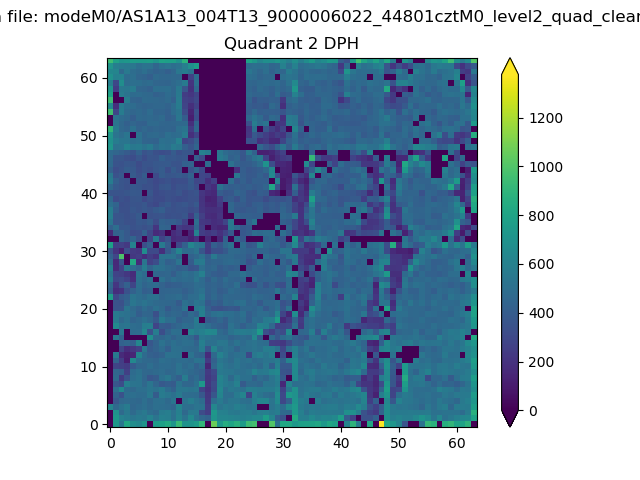 |
Quadrant C |
| Plot type | Count rate plots | Images |
|---|---|---|
| Comparison with Poisson distribution Blue bars denote a histogram of data divided into 1 sec bins. Red curve is a Poisson curve with rate = median count rate of data. |
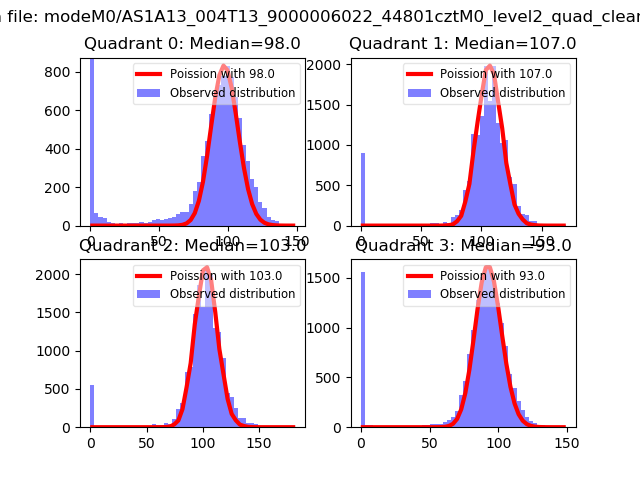 |
 |
| Quadrant-wise count rates Data is divided into 100 sec bins |
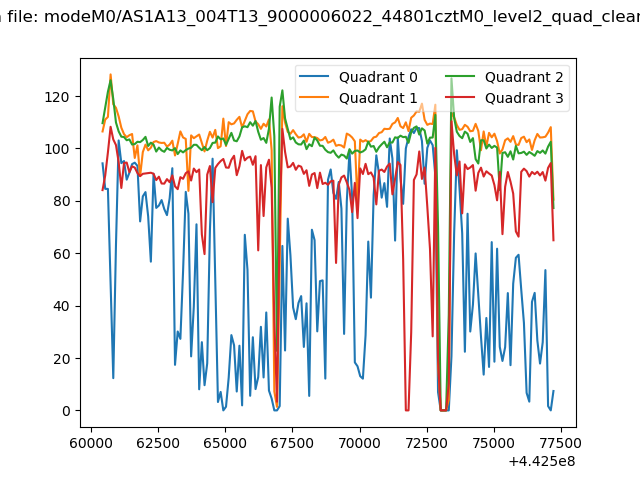 |
|
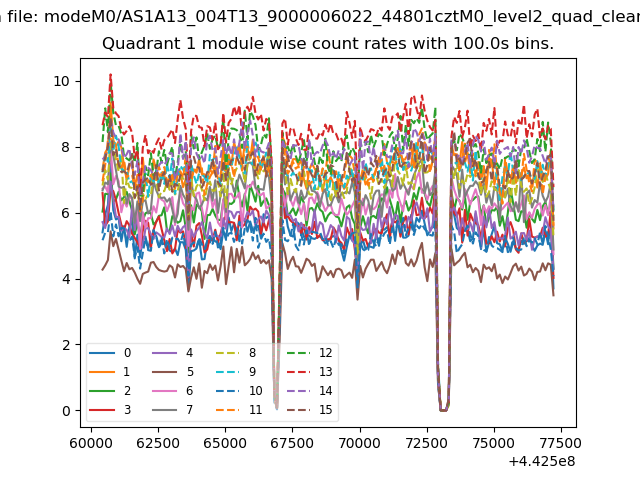
| Module-wise count rates for Quadrant A Data is divided into 100 sec bins |
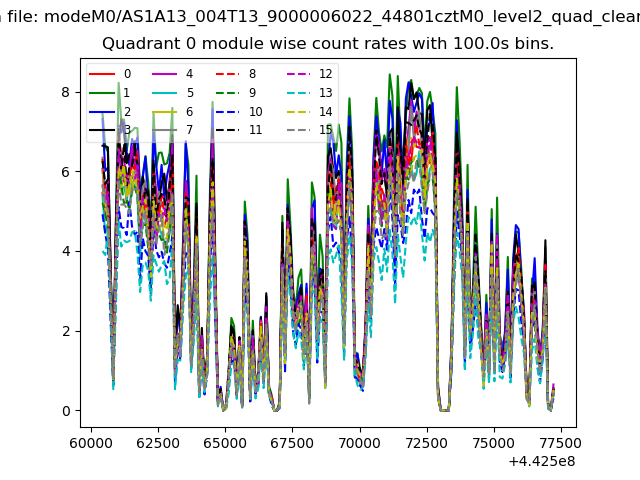 |
 |
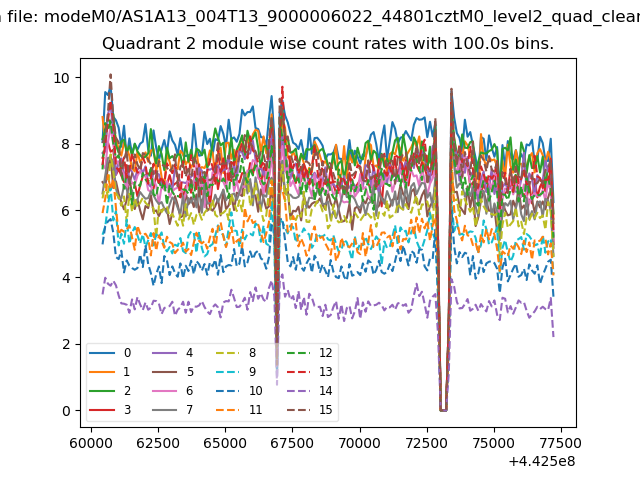
| Module-wise count rates for Quadrant B Data is divided into 100 sec bins |
 |
 |
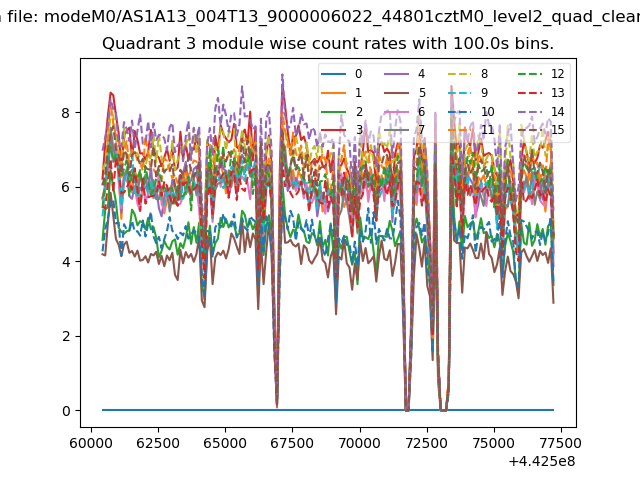
| Module-wise count rates for Quadrant C Data is divided into 100 sec bins |
 |
 |
| Module-wise count rates for Quadrant D Data is divided into 100 sec bins |
 |
 |
| Parameter | Plot |
|---|---|
| CZT HV Monitor | 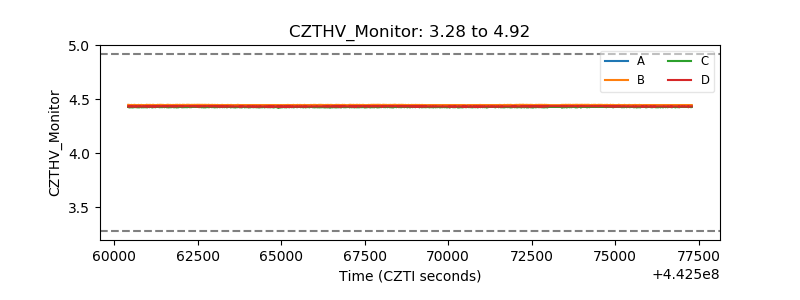 |
| D_VDD | 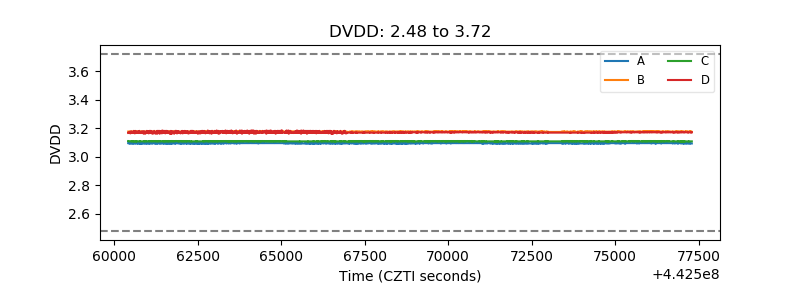 |
| Temperature 1 | 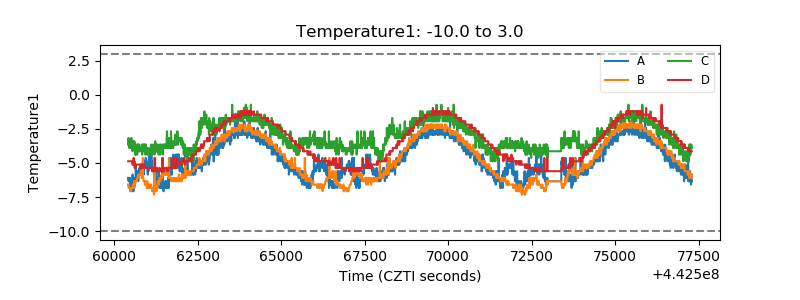 |
| Veto HV Monitor | 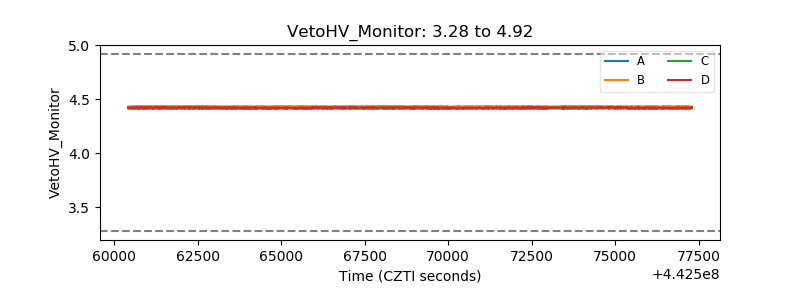 |
| Veto LLD | 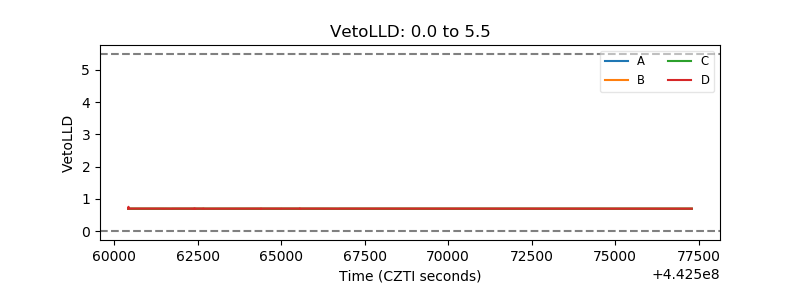 |
| Alpha Counter | 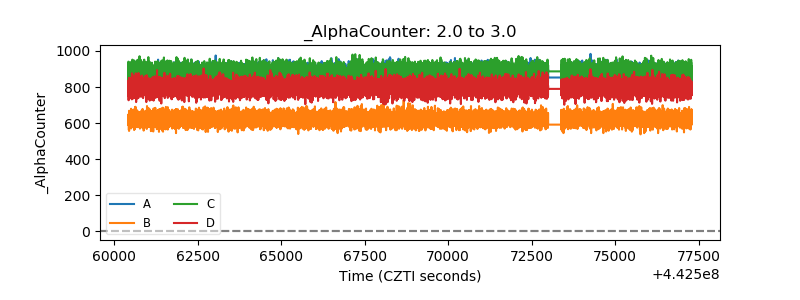 |
| _CPM_Rate | 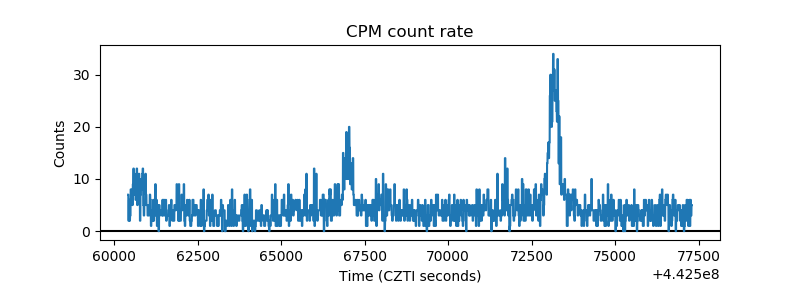 |
| CZT Counter | 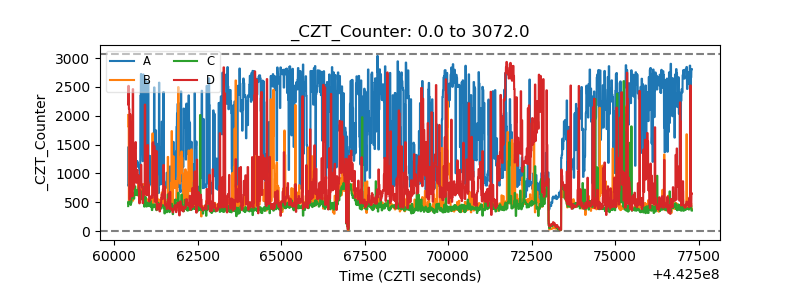 |
| +2.5 Volts monitor | 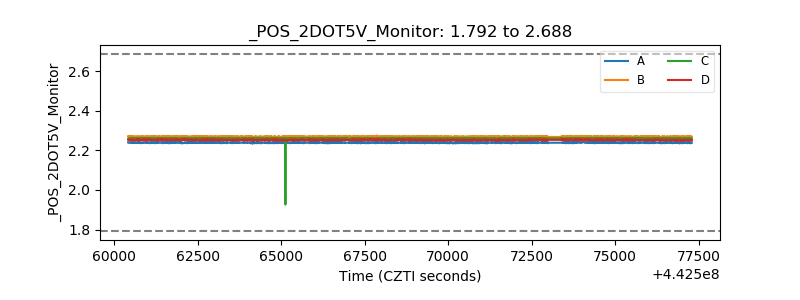 |
| +5 Volts monitor | 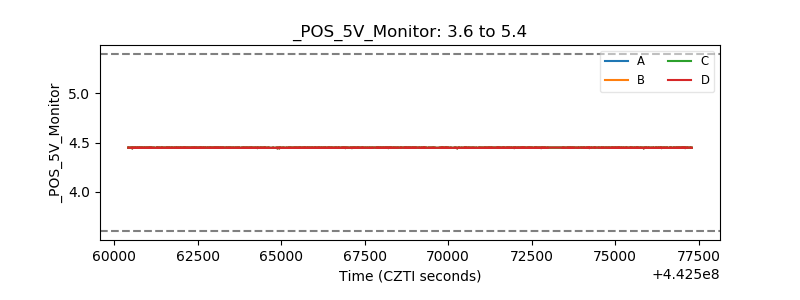 |
| _ROLL_ROT | 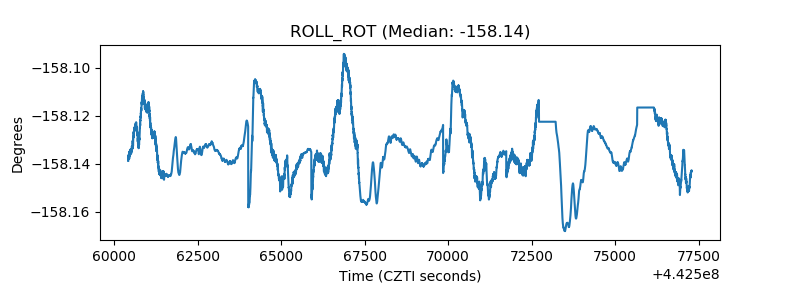 |
| _Roll_DEC | 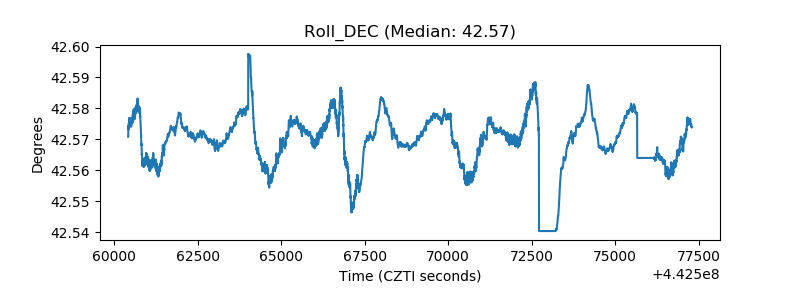 |
| _Roll_RA | 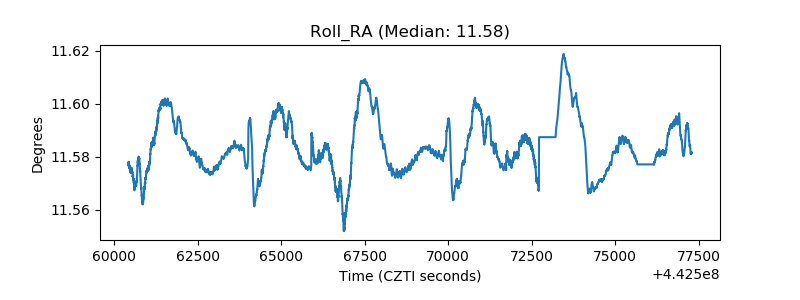 |
| Veto Counter | 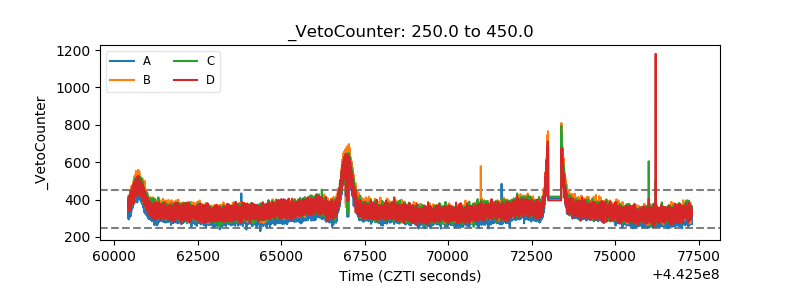 |