| Param | Original file | Final file |
|---|---|---|
| Filename | modeM0/AS1A13_004T13_9000006022_44802cztM0_level2.fits | modeM0/AS1A13_004T13_9000006022_44802cztM0_level2_quad_clean.evt |
| Size (bytes) | 1,060,922,880 | 135,187,200 |
| Size | 1011.8 MB | 128.9 MB |
| Events in quadrant A | 17,490,160 | 573,926 |
| Events in quadrant B | 5,553,367 | 1,056,506 |
| Events in quadrant C | 4,446,321 | 1,025,959 |
| Events in quadrant D | 11,014,509 | 749,477 |
| Mode M9 | |||
|---|---|---|---|
| Quadrant | BADHDUFLAG | Total packets | Discarded packets |
| A | 0 | 15 | 0 |
| B | 0 | 15 | 0 |
| C | 0 | 15 | 0 |
| D | 0 | 15 | 0 |
| Mode M0 | |||
|---|---|---|---|
| Quadrant | BADHDUFLAG | Total packets | Discarded packets |
| A | 0 | 58813 | 1 |
| B | 0 | 23192 | 1 |
| C | 0 | 20597 | 1 |
| D | 0 | 39538 | 1 |
| Mode SS | |||
|---|---|---|---|
| Quadrant | BADHDUFLAG | Total packets | Discarded packets |
| A | 0 | 202 | 0 |
| B | 0 | 202 | 0 |
| C | 0 | 202 | 0 |
| D | 0 | 202 | 0 |
| Quadrant | Total seconds | Saturated seconds | Saturation percentage |
|---|---|---|---|
| A | 9910 | 4940 | 49.848638% |
| B | 9910 | 322 | 3.249243% |
| C | 9911 | 81 | 0.817274% |
| D | 9910 | 2320 | 23.410696% |
Noise dominated data is calculated using 1-second bins in cleaned event files. If a bin has >2000 counts, and if more than 50% of those come from <1% of pixels, then it is considered to be noise-dominated and hence unusable.
| Quadrant | # 1 sec bins | Bins with >0 counts | Bins with >2000 counts | High rate bins dominated by noise | Noise dominated (total time) | Noise dominated (detector-on time) | Marked lightcurve |
|---|---|---|---|---|---|---|---|
| A | 11400 | 9910 | 4482 | 4482 | 39.32% | 45.23% | 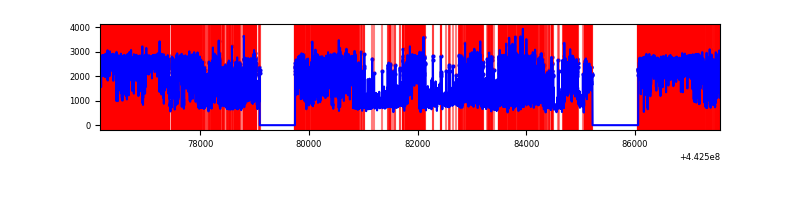 |
| B | 11400 | 9910 | 187 | 187 | 1.64% | 1.89% | 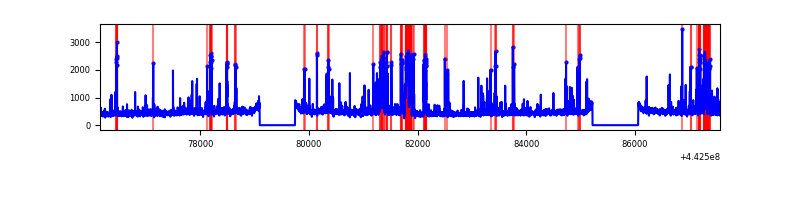 |
| C | 11401 | 9912 | 22 | 22 | 0.19% | 0.22% | 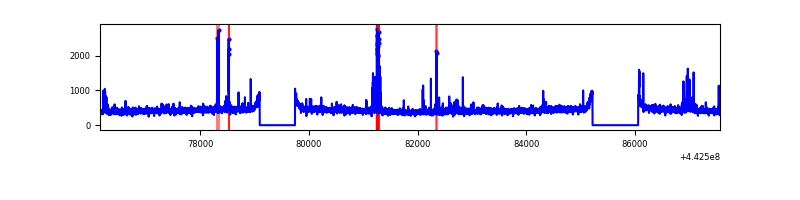 |
| D | 11400 | 9910 | 2233 | 2233 | 19.59% | 22.53% | 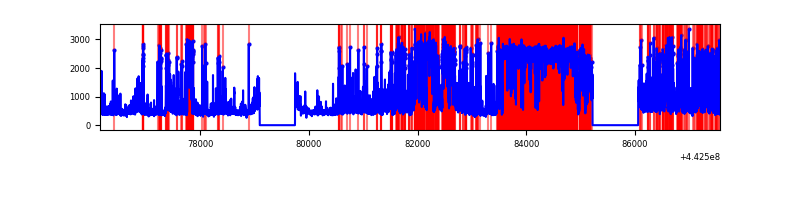 |
Top three noisy pixels from each quadrant. If the there are fewer than three noisy pixels in the level2.evt file, extra rows are filled as -1
| Pixel properties | Quadrant properties | ||||||
|---|---|---|---|---|---|---|---|
| Quadrant | DetID | PixID | Counts | Sigma | Mean | Median | Sigma |
| A | 15 | 223 | 12156798 | 72205.81 | 808 | 790 | 168.4 |
| A | 10 | 83 | 2169952 | 12884.67 | 808 | 790 | 168.4 |
| A | 10 | 248 | 21439 | 122.65 | 808 | 790 | 168.4 |
| B | 0 | 189 | 728423 | 3392.49 | 1083 | 1047 | 214.4 |
| B | 5 | 255 | 225419 | 1046.47 | 1083 | 1047 | 214.4 |
| B | 0 | 155 | 73848 | 339.54 | 1083 | 1047 | 214.4 |
| C | 2 | 14 | 101740 | 398.18 | 1079 | 1084 | 252.8 |
| C | 1 | 3 | 74335 | 289.77 | 1079 | 1084 | 252.8 |
| C | 14 | 254 | 52063 | 201.66 | 1079 | 1084 | 252.8 |
| D | 5 | 235 | 3905311 | 16603.38 | 940 | 913 | 235.2 |
| D | 13 | 187 | 827255 | 3514.0 | 940 | 913 | 235.2 |
| D | 13 | 249 | 797172 | 3386.08 | 940 | 913 | 235.2 |
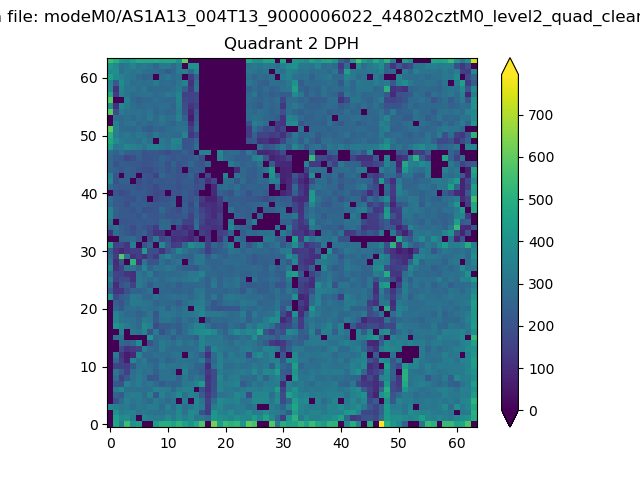
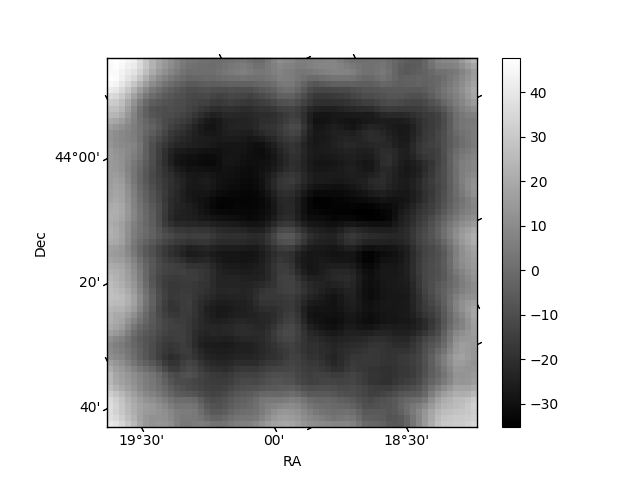
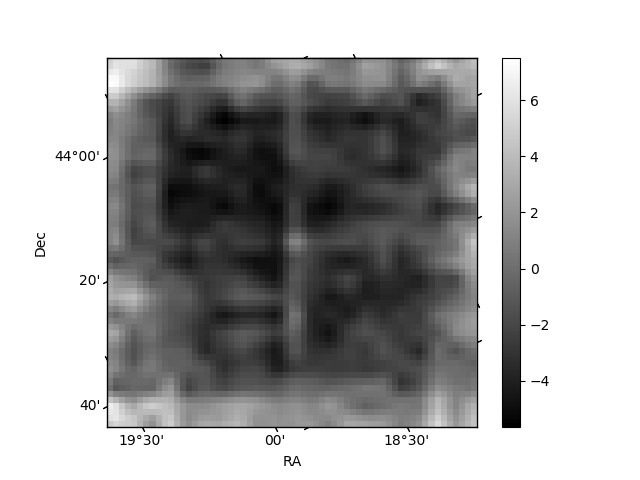
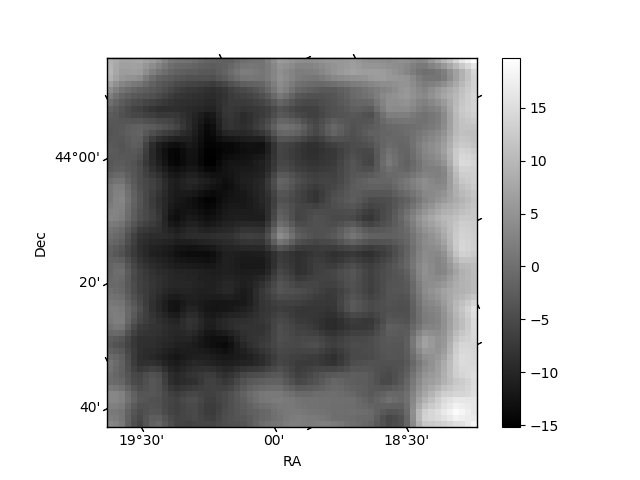
Histogram calculated using DETX and DETY for each event in the final _common_clean file
| Quadrant A | 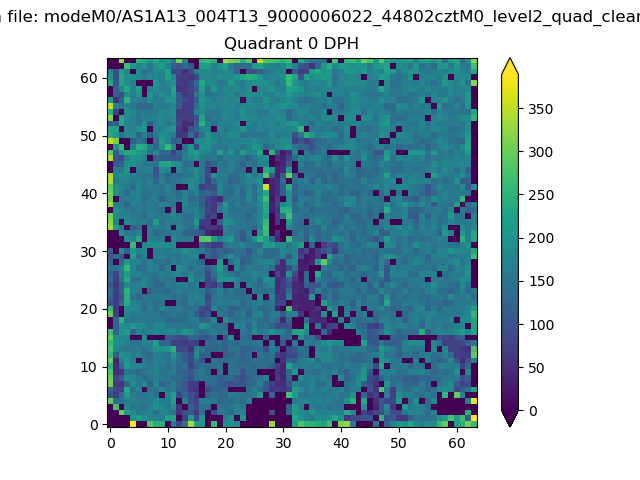 |
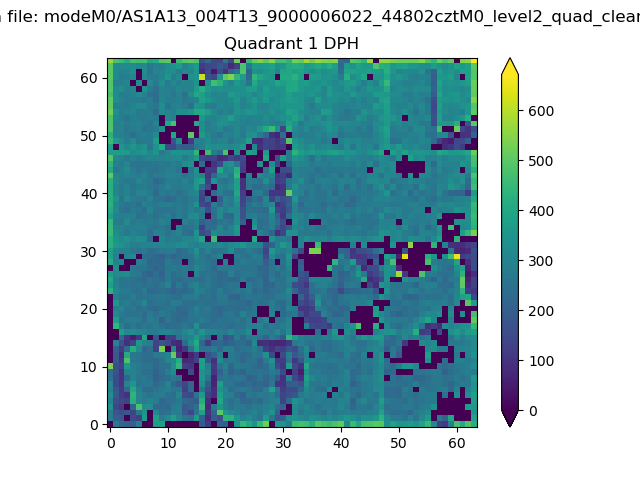 |
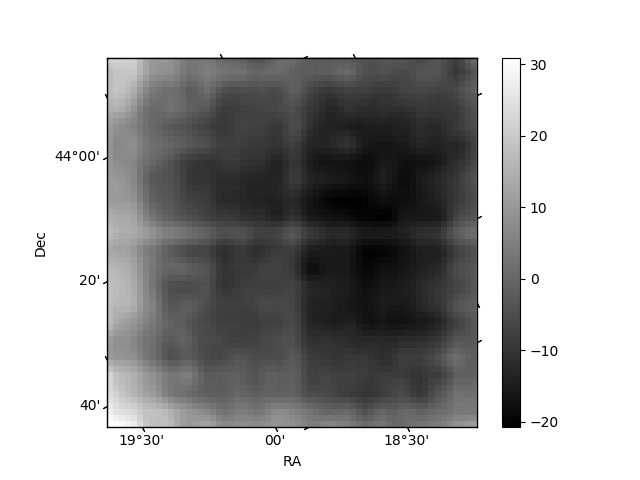
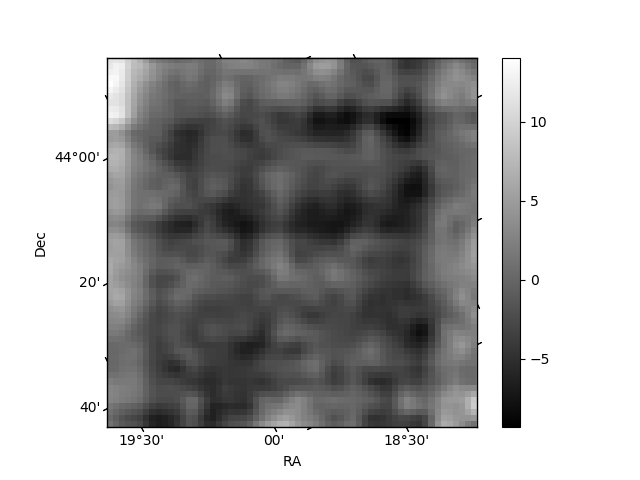
Quadrant B |
|---|---|---|---|
| Quadrant D | 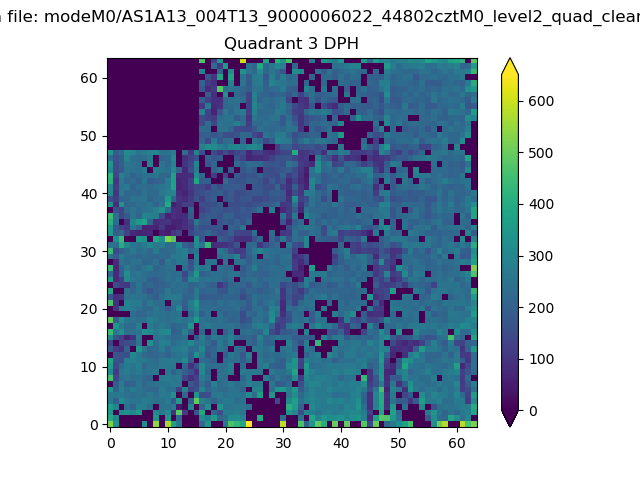 |
 |
Quadrant C |
| Plot type | Count rate plots | Images |
|---|---|---|
| Comparison with Poisson distribution Blue bars denote a histogram of data divided into 1 sec bins. Red curve is a Poisson curve with rate = median count rate of data. |
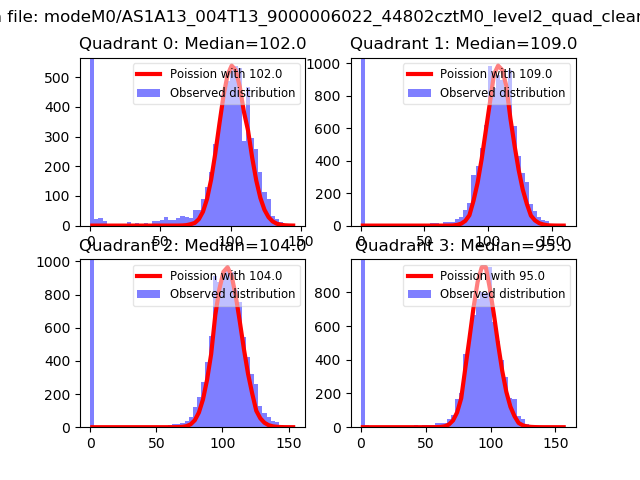 |
 |
| Quadrant-wise count rates Data is divided into 100 sec bins |
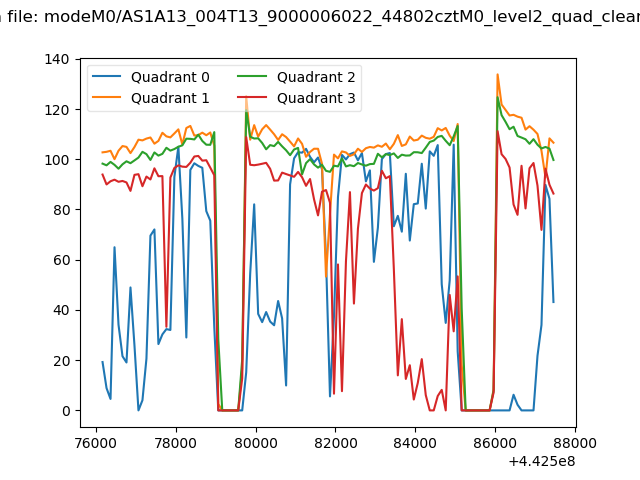 |
|
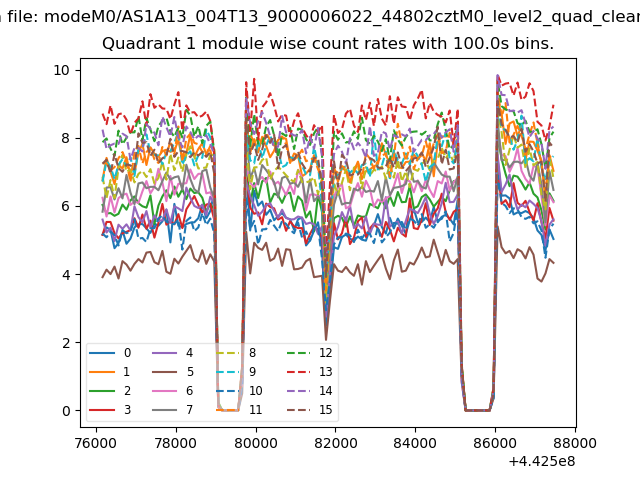
| Module-wise count rates for Quadrant A Data is divided into 100 sec bins |
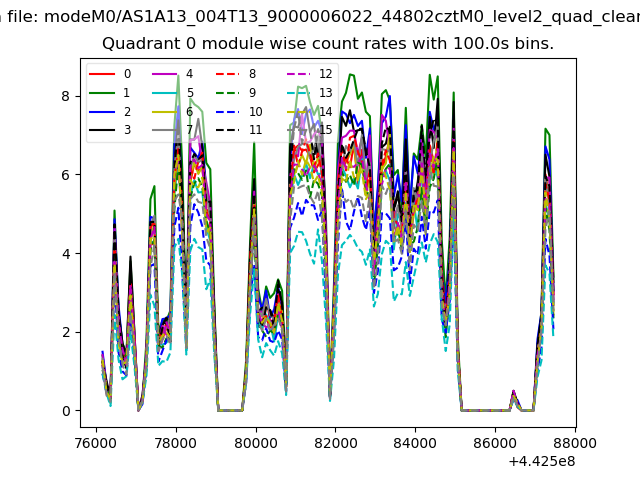 |
 |
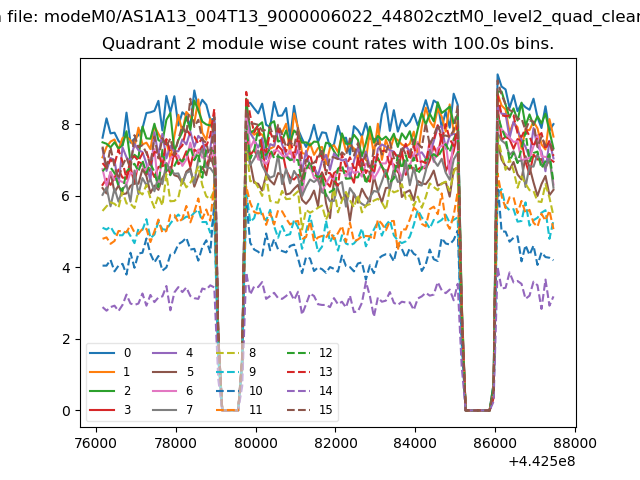
| Module-wise count rates for Quadrant B Data is divided into 100 sec bins |
 |
 |
| Module-wise count rates for Quadrant C Data is divided into 100 sec bins |
 |
 |
| Module-wise count rates for Quadrant D Data is divided into 100 sec bins |
 |
 |
| Parameter | Plot |
|---|---|
| CZT HV Monitor | 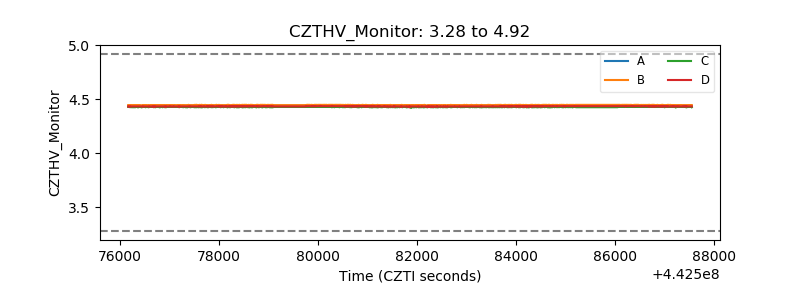 |
| D_VDD | 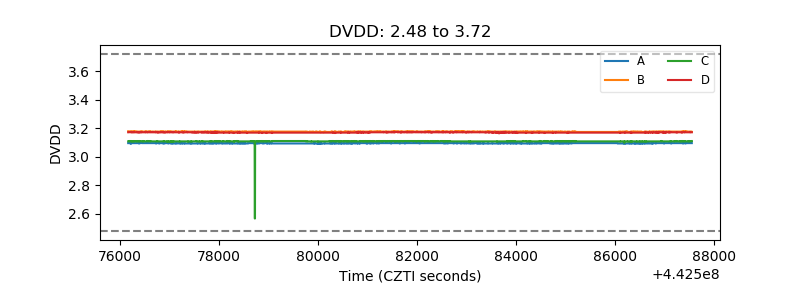 |
| Temperature 1 | 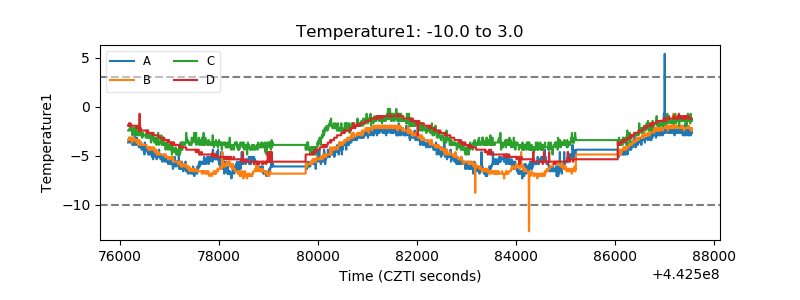 |
| Veto HV Monitor | 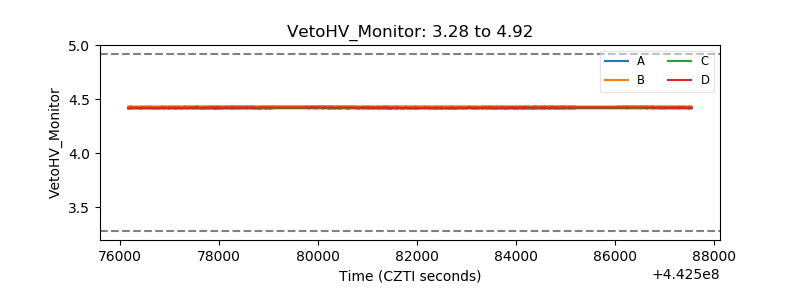 |
| Veto LLD | 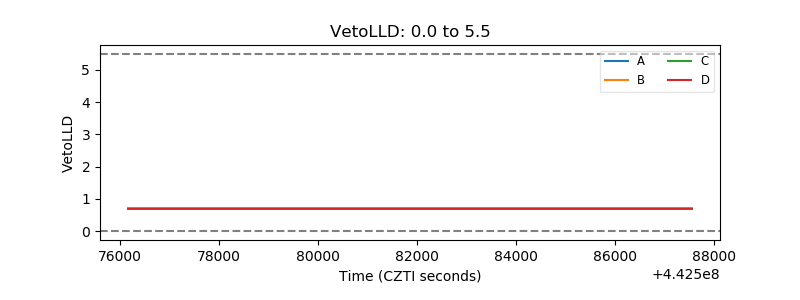 |
| Alpha Counter | 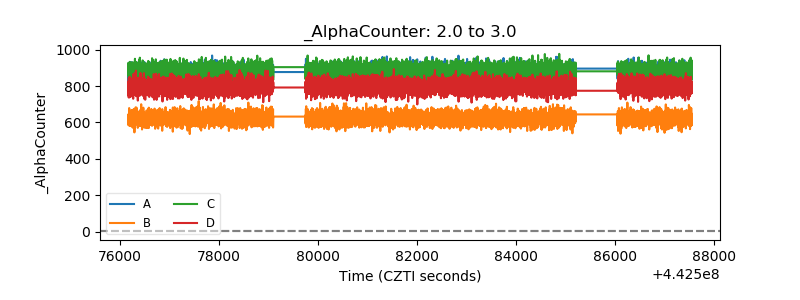 |
| _CPM_Rate | 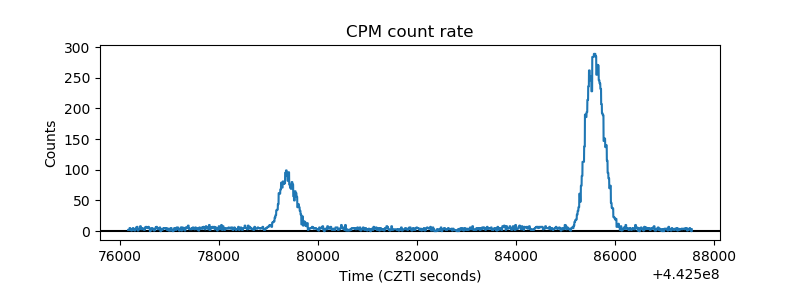 |
| CZT Counter | 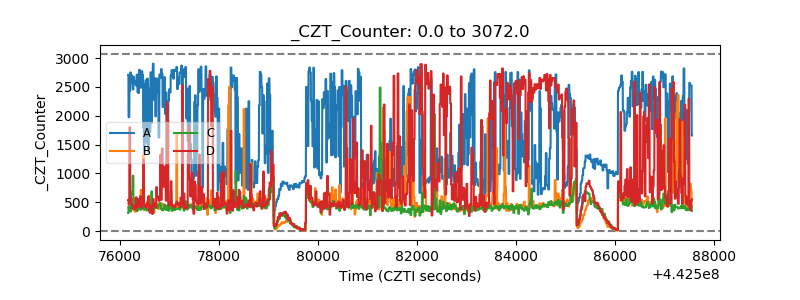 |
| +2.5 Volts monitor | 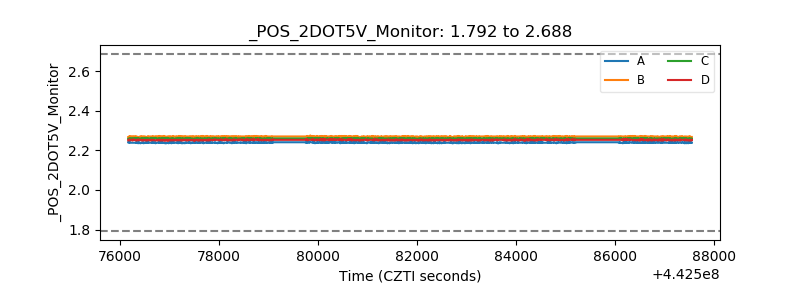 |
| +5 Volts monitor | 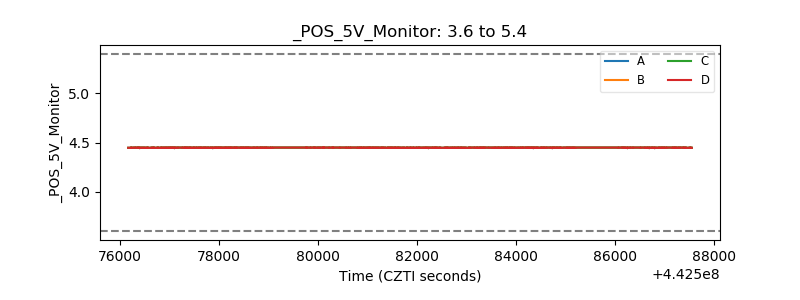 |
| _ROLL_ROT | 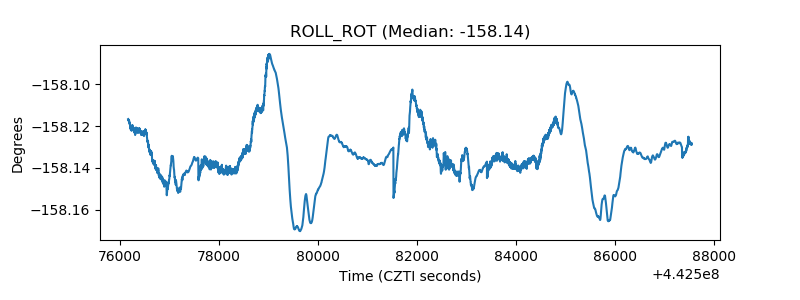 |
| _Roll_DEC | 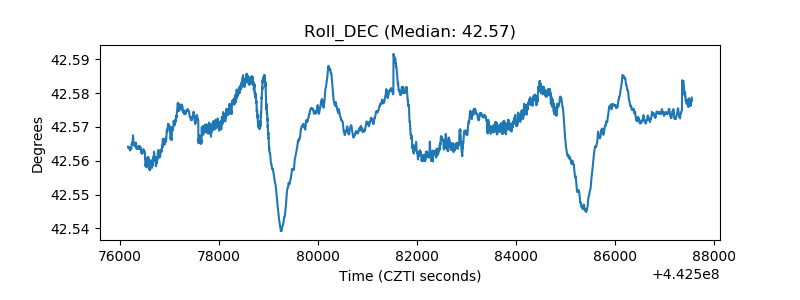 |
| _Roll_RA | 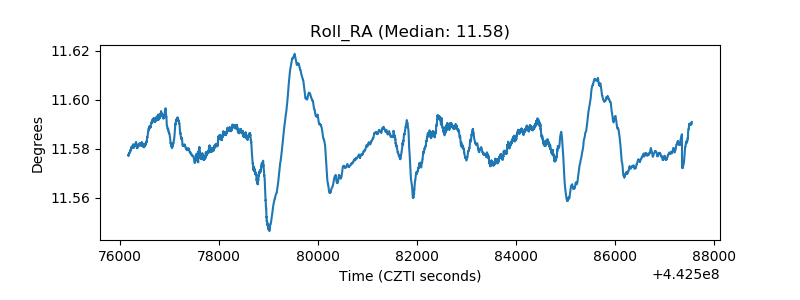 |
| Veto Counter | 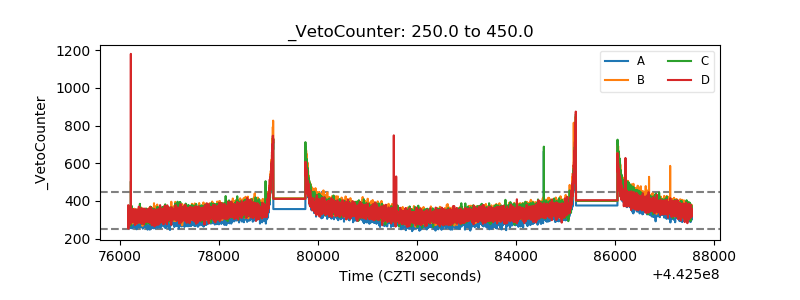 |