| Param | Original file | Final file |
|---|---|---|
| Filename | modeM0/AS1A13_004T13_9000006022_44803cztM0_level2.fits | modeM0/AS1A13_004T13_9000006022_44803cztM0_level2_quad_clean.evt |
| Size (bytes) | 711,529,920 | 86,892,480 |
| Size | 678.6 MB | 82.9 MB |
| Events in quadrant A | 14,004,376 | 211,636 |
| Events in quadrant B | 3,490,686 | 700,561 |
| Events in quadrant C | 2,871,895 | 675,843 |
| Events in quadrant D | 5,476,343 | 597,858 |
| Mode M9 | |||
|---|---|---|---|
| Quadrant | BADHDUFLAG | Total packets | Discarded packets |
| A | 0 | 9 | 0 |
| B | 0 | 9 | 0 |
| C | 0 | 9 | 0 |
| D | 0 | 9 | 0 |
| Mode M0 | |||
|---|---|---|---|
| Quadrant | BADHDUFLAG | Total packets | Discarded packets |
| A | 0 | 45990 | 1 |
| B | 0 | 14751 | 1 |
| C | 0 | 13271 | 1 |
| D | 0 | 20681 | 9 |
| Mode SS | |||
|---|---|---|---|
| Quadrant | BADHDUFLAG | Total packets | Discarded packets |
| A | 0 | 130 | 0 |
| B | 0 | 130 | 0 |
| C | 0 | 130 | 0 |
| D | 0 | 130 | 0 |
| Quadrant | Total seconds | Saturated seconds | Saturation percentage |
|---|---|---|---|
| A | 6372 | 4881 | 76.600753% |
| B | 6372 | 180 | 2.824859% |
| C | 6373 | 60 | 0.941472% |
| D | 6372 | 485 | 7.611425% |
Noise dominated data is calculated using 1-second bins in cleaned event files. If a bin has >2000 counts, and if more than 50% of those come from <1% of pixels, then it is considered to be noise-dominated and hence unusable.
| Quadrant | # 1 sec bins | Bins with >0 counts | Bins with >2000 counts | High rate bins dominated by noise | Noise dominated (total time) | Noise dominated (detector-on time) | Marked lightcurve |
|---|---|---|---|---|---|---|---|
| A | 7341 | 6371 | 4444 | 4444 | 60.54% | 69.75% | 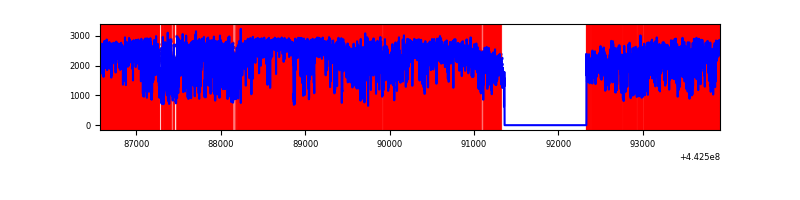 |
| B | 7342 | 6372 | 92 | 92 | 1.25% | 1.44% | 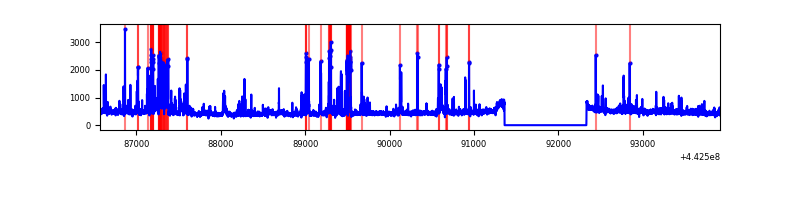 |
| C | 7343 | 6373 | 10 | 10 | 0.14% | 0.16% | 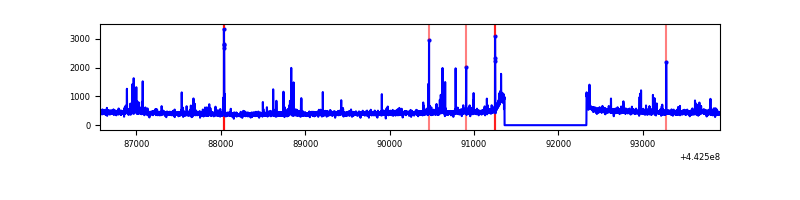 |
| D | 7342 | 6372 | 445 | 445 | 6.06% | 6.98% | 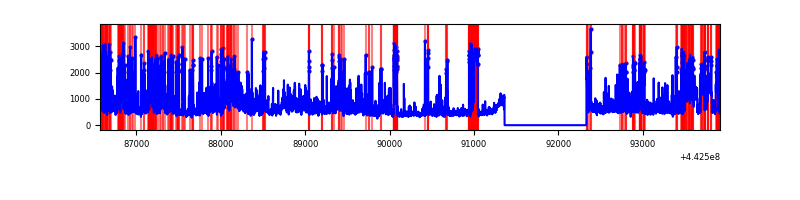 |
Top three noisy pixels from each quadrant. If the there are fewer than three noisy pixels in the level2.evt file, extra rows are filled as -1
| Pixel properties | Quadrant properties | ||||||
|---|---|---|---|---|---|---|---|
| Quadrant | DetID | PixID | Counts | Sigma | Mean | Median | Sigma |
| A | 15 | 223 | 10881492 | 113420.32 | 457 | 447 | 95.9 |
| A | 10 | 83 | 1325511 | 13812.01 | 457 | 447 | 95.9 |
| A | 13 | 248 | 17780 | 180.67 | 457 | 447 | 95.9 |
| B | 0 | 189 | 393310 | 2842.77 | 696 | 674 | 138.1 |
| B | 5 | 255 | 149802 | 1079.72 | 696 | 674 | 138.1 |
| B | 5 | 172 | 54351 | 388.63 | 696 | 674 | 138.1 |
| C | 14 | 254 | 97602 | 594.58 | 690 | 692 | 163.0 |
| C | 1 | 3 | 47547 | 287.47 | 690 | 692 | 163.0 |
| C | 3 | 233 | 17335 | 102.11 | 690 | 692 | 163.0 |
| D | 5 | 235 | 608830 | 3566.1 | 677 | 654 | 170.5 |
| D | 1 | 52 | 522507 | 3059.93 | 677 | 654 | 170.5 |
| D | 11 | 241 | 400551 | 2344.83 | 677 | 654 | 170.5 |
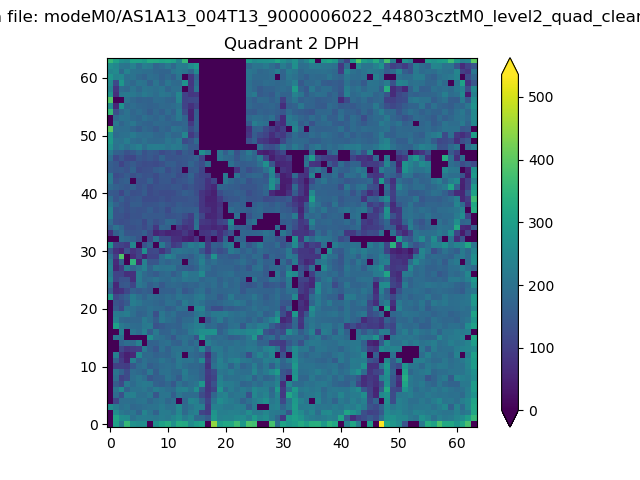
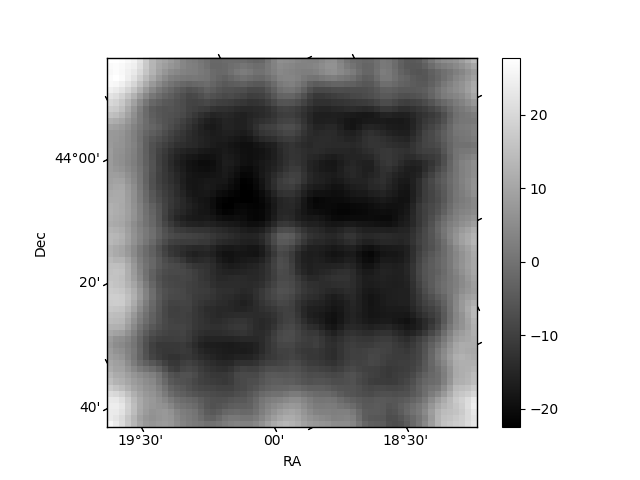
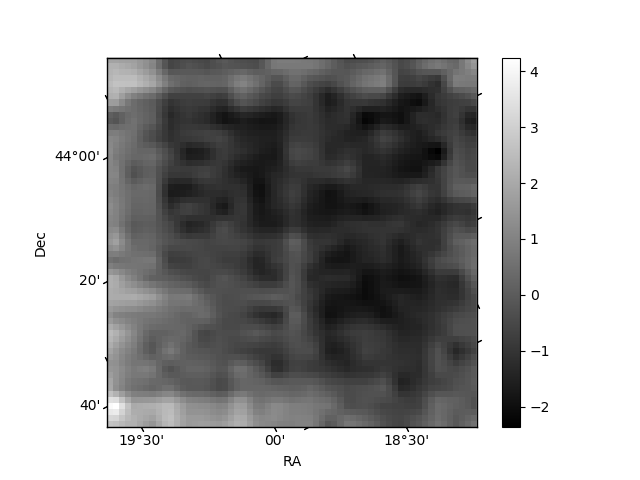
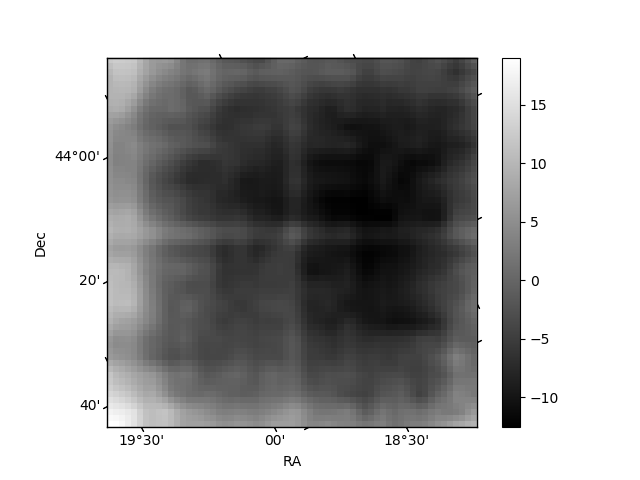
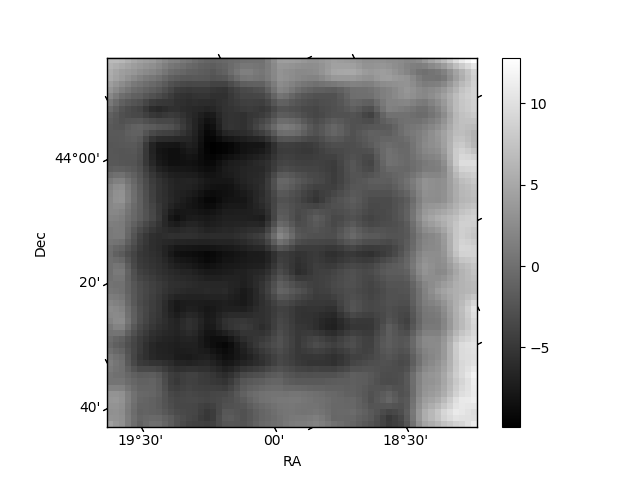
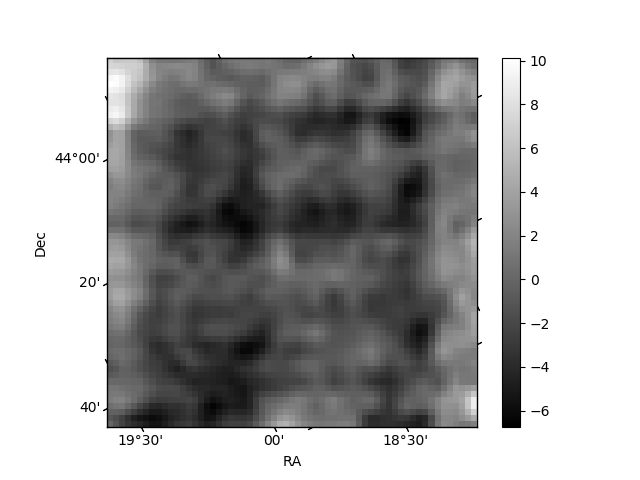
Histogram calculated using DETX and DETY for each event in the final _common_clean file
| Quadrant A | 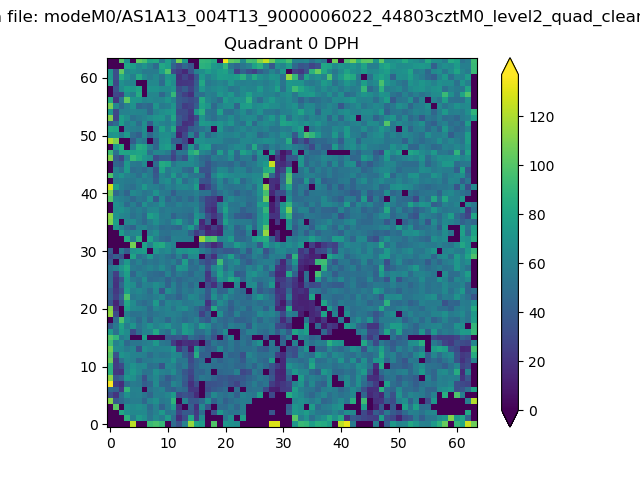 |
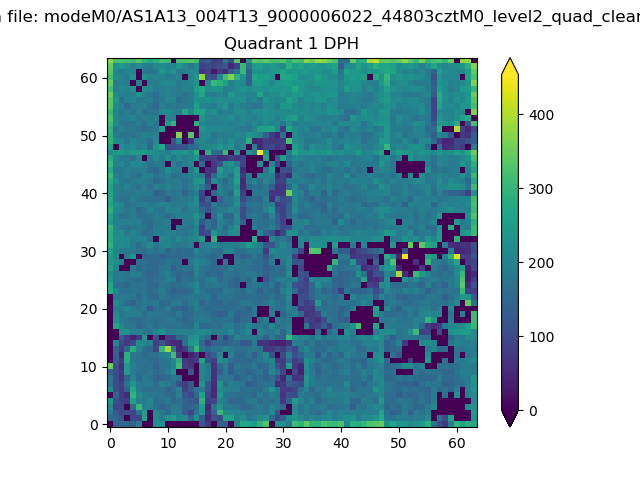 |
Quadrant B |
|---|---|---|---|
| Quadrant D | 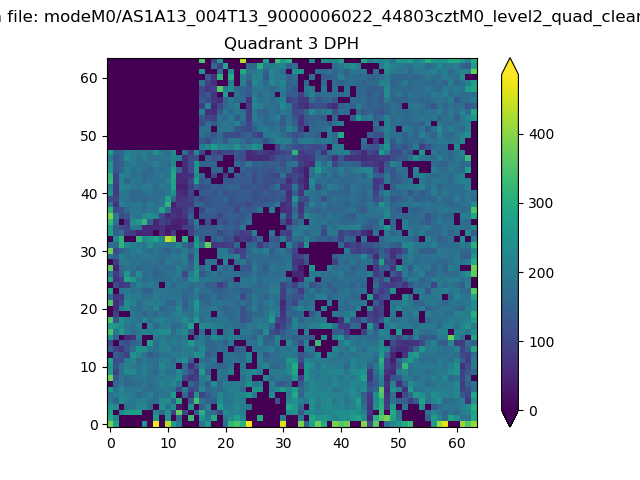 |
 |
Quadrant C |
| Plot type | Count rate plots | Images |
|---|---|---|
| Comparison with Poisson distribution Blue bars denote a histogram of data divided into 1 sec bins. Red curve is a Poisson curve with rate = median count rate of data. |
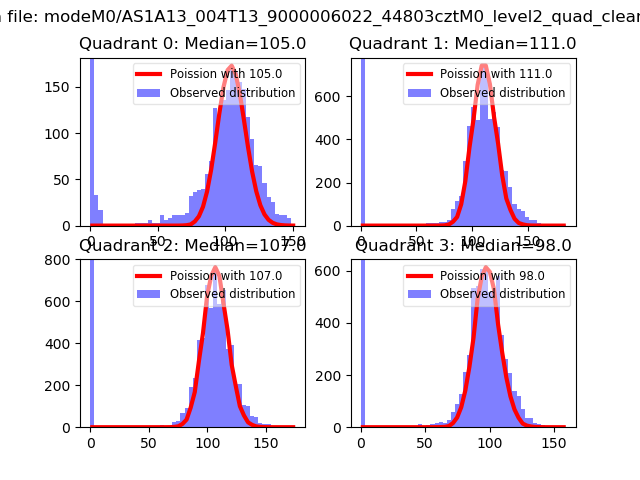 |
 |
| Quadrant-wise count rates Data is divided into 100 sec bins |
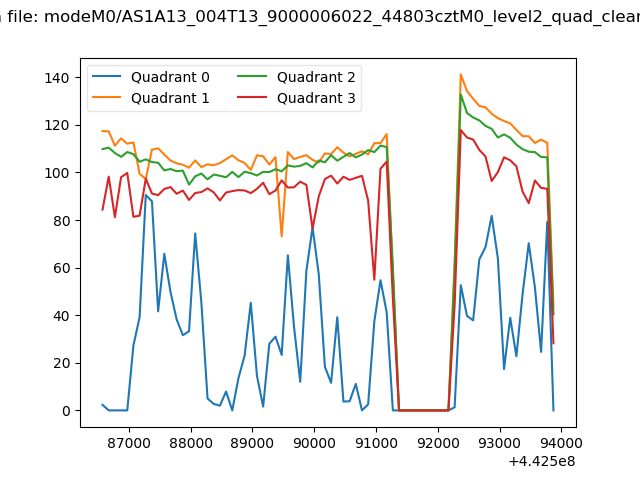 |
|
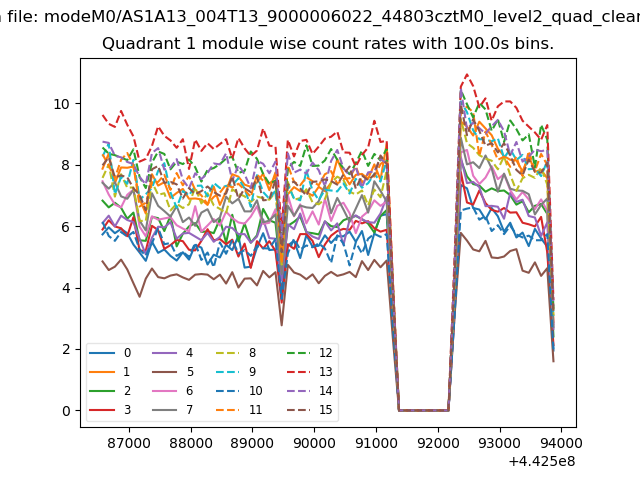
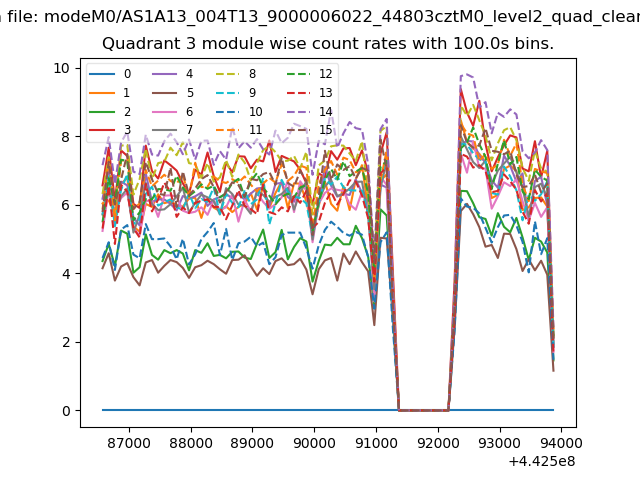
| Module-wise count rates for Quadrant A Data is divided into 100 sec bins |
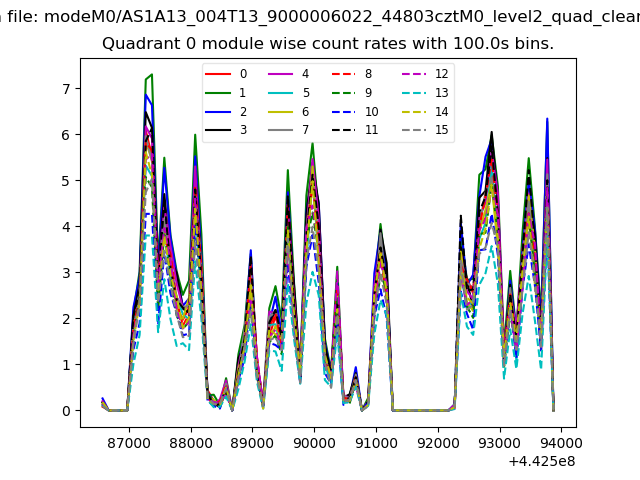 |
 |
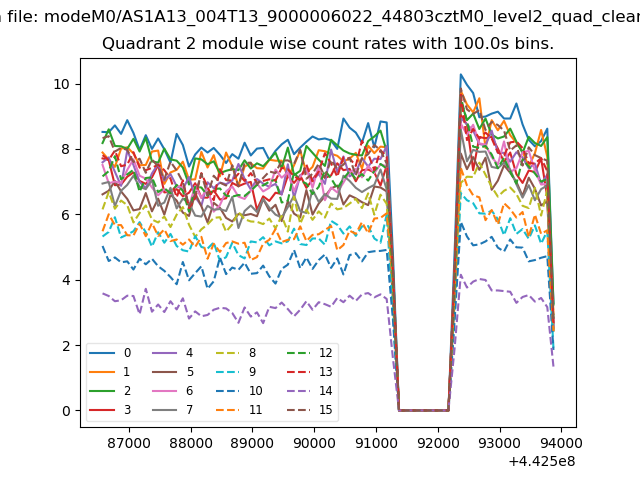
| Module-wise count rates for Quadrant B Data is divided into 100 sec bins |
 |
 |
| Module-wise count rates for Quadrant C Data is divided into 100 sec bins |
 |
 |
| Module-wise count rates for Quadrant D Data is divided into 100 sec bins |
 |
 |
| Parameter | Plot |
|---|---|
| CZT HV Monitor | 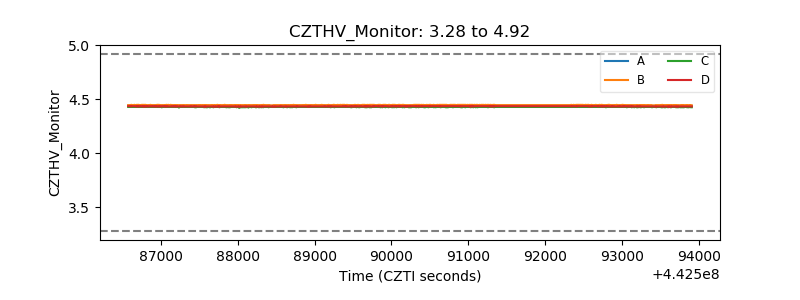 |
| D_VDD | 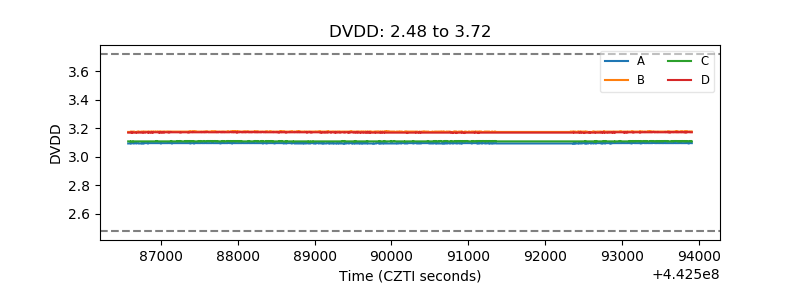 |
| Temperature 1 | 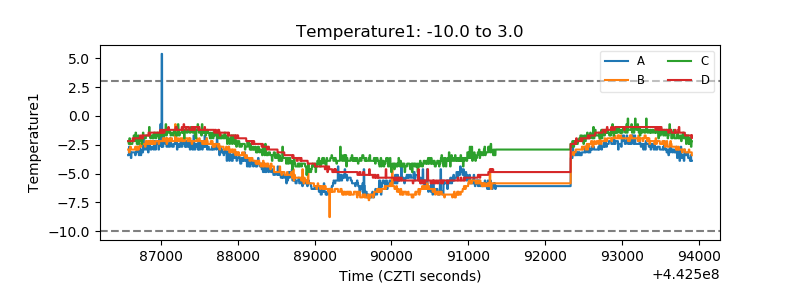 |
| Veto HV Monitor | 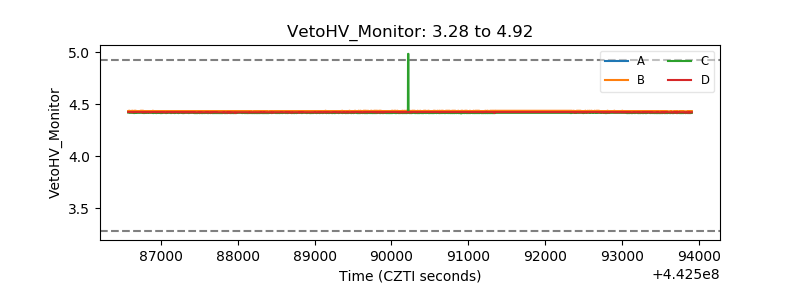 |
| Veto LLD | 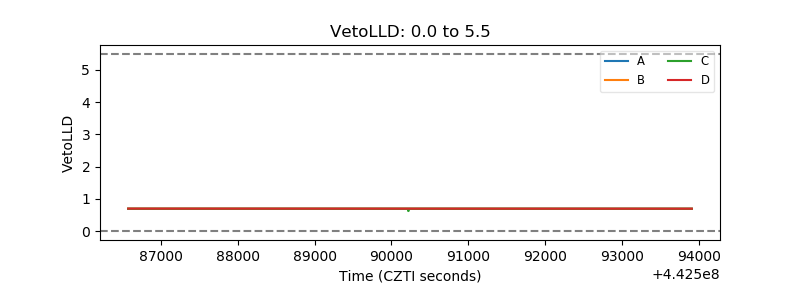 |
| Alpha Counter | 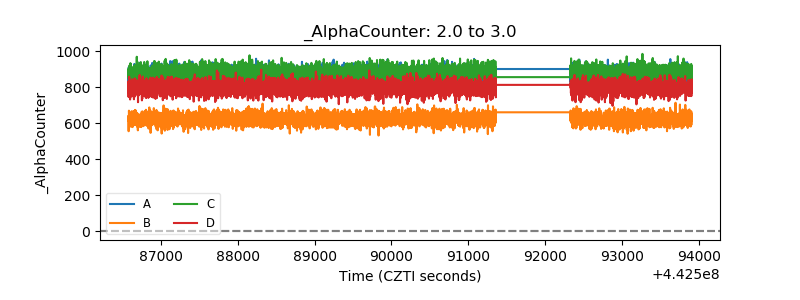 |
| _CPM_Rate | 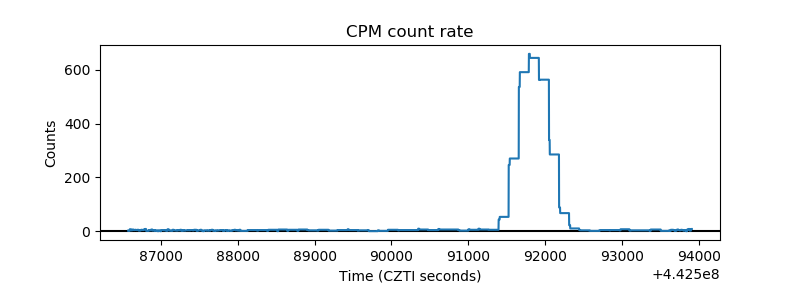 |
| CZT Counter | 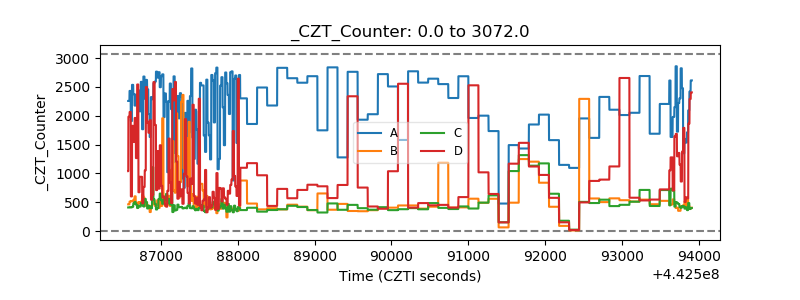 |
| +2.5 Volts monitor | 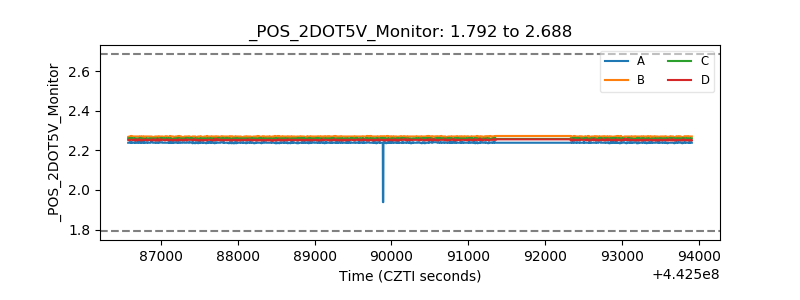 |
| +5 Volts monitor | 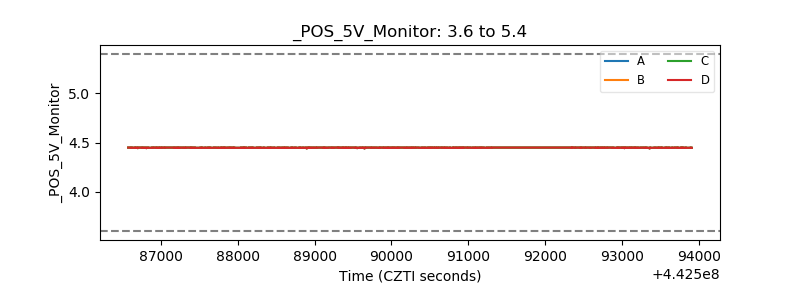 |
| _ROLL_ROT | 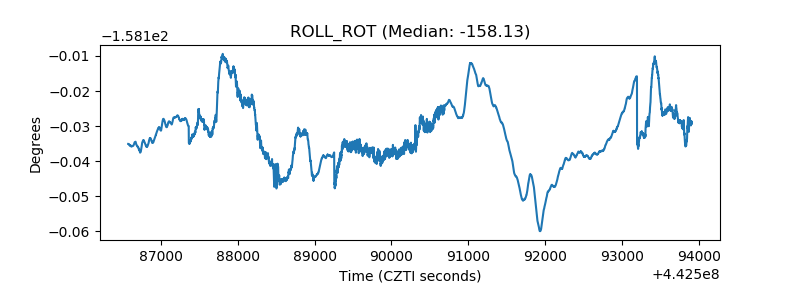 |
| _Roll_DEC | 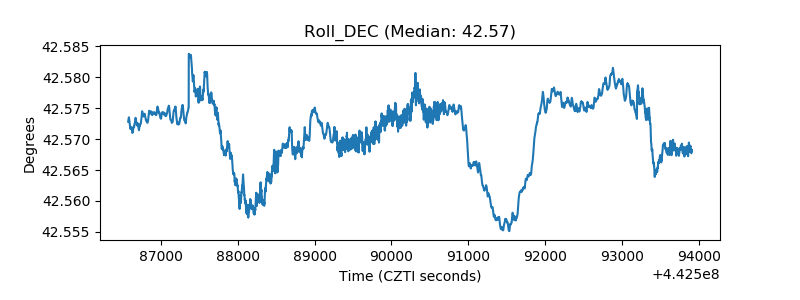 |
| _Roll_RA | 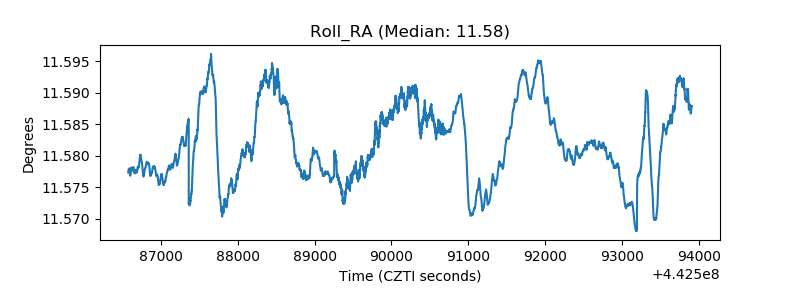 |
| Veto Counter | 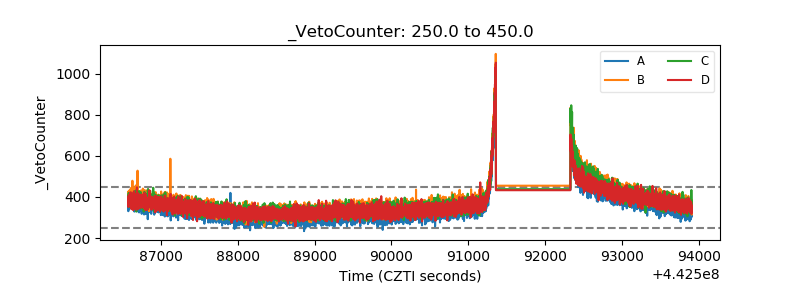 |