| Param | Original file | Final file |
|---|---|---|
| Filename | modeM0/AS1A13_004T13_9000006022_44805cztM0_level2.fits | modeM0/AS1A13_004T13_9000006022_44805cztM0_level2_quad_clean.evt |
| Size (bytes) | 661,340,160 | 85,656,960 |
| Size | 630.7 MB | 81.7 MB |
| Events in quadrant A | 11,123,121 | 370,124 |
| Events in quadrant B | 3,308,476 | 663,432 |
| Events in quadrant C | 2,633,752 | 642,552 |
| Events in quadrant D | 6,962,235 | 508,712 |
| Mode M9 | |||
|---|---|---|---|
| Quadrant | BADHDUFLAG | Total packets | Discarded packets |
| A | 0 | 11 | 0 |
| B | 0 | 11 | 0 |
| C | 0 | 11 | 0 |
| D | 0 | 11 | 0 |
| Mode M0 | |||
|---|---|---|---|
| Quadrant | BADHDUFLAG | Total packets | Discarded packets |
| A | 0 | 37080 | 1 |
| B | 0 | 13807 | 1 |
| C | 0 | 12096 | 1 |
| D | 0 | 24668 | 1 |
| Mode SS | |||
|---|---|---|---|
| Quadrant | BADHDUFLAG | Total packets | Discarded packets |
| A | 0 | 120 | 0 |
| B | 0 | 120 | 0 |
| C | 0 | 120 | 0 |
| D | 0 | 120 | 0 |
| Quadrant | Total seconds | Saturated seconds | Saturation percentage |
|---|---|---|---|
| A | 5843 | 3053 | 52.250556% |
| B | 5842 | 159 | 2.721671% |
| C | 5843 | 31 | 0.530549% |
| D | 5843 | 1097 | 18.774602% |
Noise dominated data is calculated using 1-second bins in cleaned event files. If a bin has >2000 counts, and if more than 50% of those come from <1% of pixels, then it is considered to be noise-dominated and hence unusable.
| Quadrant | # 1 sec bins | Bins with >0 counts | Bins with >2000 counts | High rate bins dominated by noise | Noise dominated (total time) | Noise dominated (detector-on time) | Marked lightcurve |
|---|---|---|---|---|---|---|---|
| A | 6953 | 5843 | 2923 | 2923 | 42.04% | 50.03% | 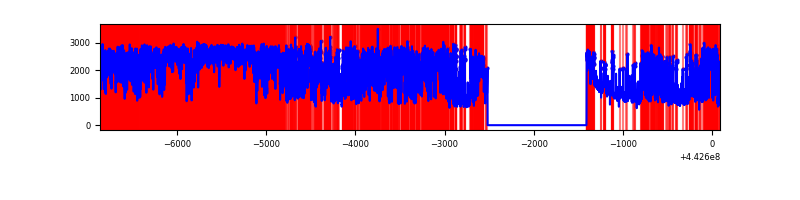 |
| B | 6952 | 5842 | 131 | 131 | 1.88% | 2.24% | 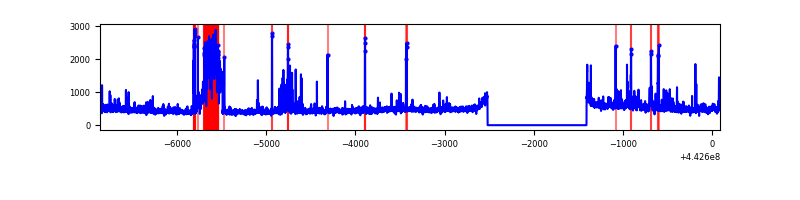 |
| C | 6953 | 5843 | 3 | 3 | 0.04% | 0.05% | 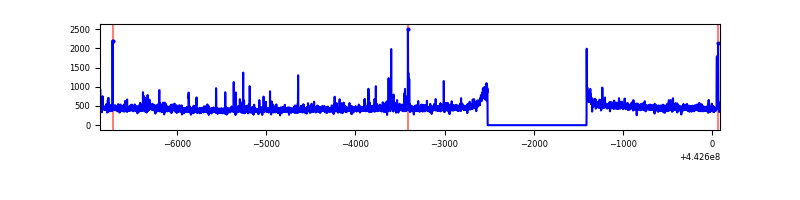 |
| D | 6953 | 5843 | 1136 | 1136 | 16.34% | 19.44% | 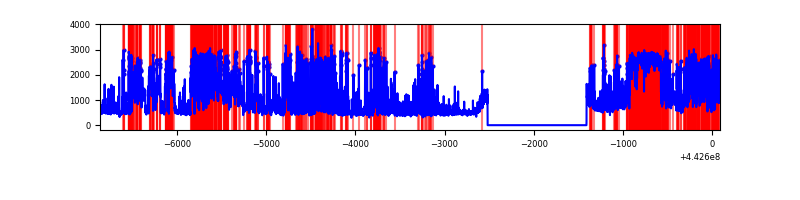 |
Top three noisy pixels from each quadrant. If the there are fewer than three noisy pixels in the level2.evt file, extra rows are filled as -1
| Pixel properties | Quadrant properties | ||||||
|---|---|---|---|---|---|---|---|
| Quadrant | DetID | PixID | Counts | Sigma | Mean | Median | Sigma |
| A | 15 | 223 | 7471471 | 69346.51 | 519 | 506 | 107.7 |
| A | 10 | 83 | 1493312 | 13856.43 | 519 | 506 | 107.7 |
| A | 13 | 248 | 82944 | 765.2 | 519 | 506 | 107.7 |
| B | 0 | 189 | 421743 | 3278.0 | 646 | 625 | 128.5 |
| B | 0 | 190 | 49852 | 383.18 | 646 | 625 | 128.5 |
| B | 7 | 221 | 48559 | 373.12 | 646 | 625 | 128.5 |
| C | 14 | 254 | 60767 | 398.54 | 643 | 646 | 150.9 |
| C | 2 | 14 | 28660 | 185.7 | 643 | 646 | 150.9 |
| C | 3 | 233 | 17210 | 109.8 | 643 | 646 | 150.9 |
| D | 13 | 187 | 1736954 | 11475.55 | 599 | 578 | 151.3 |
| D | 1 | 52 | 947440 | 6257.72 | 599 | 578 | 151.3 |
| D | 13 | 249 | 540222 | 3566.45 | 599 | 578 | 151.3 |
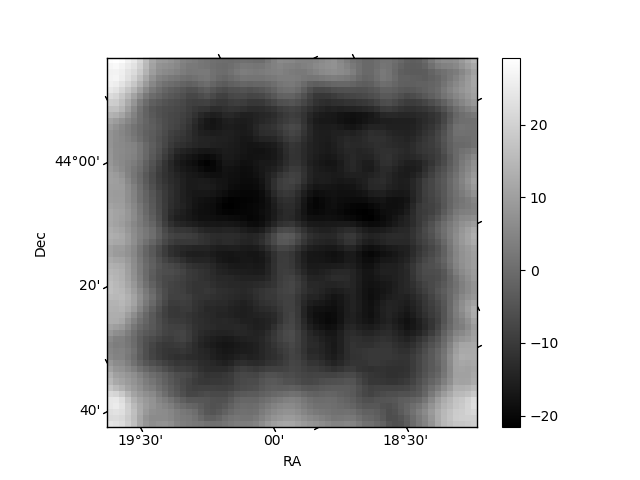
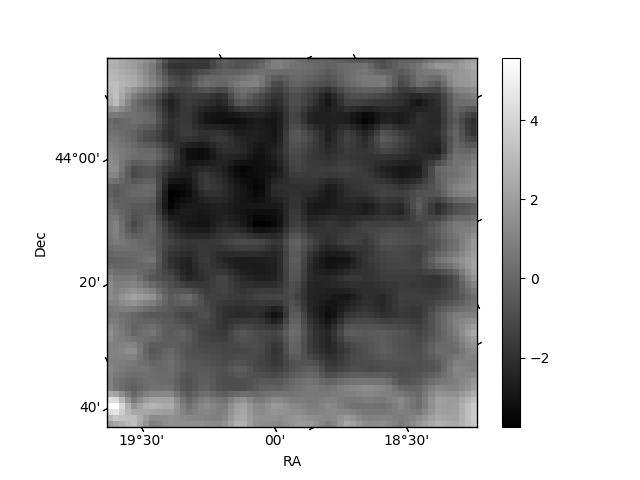
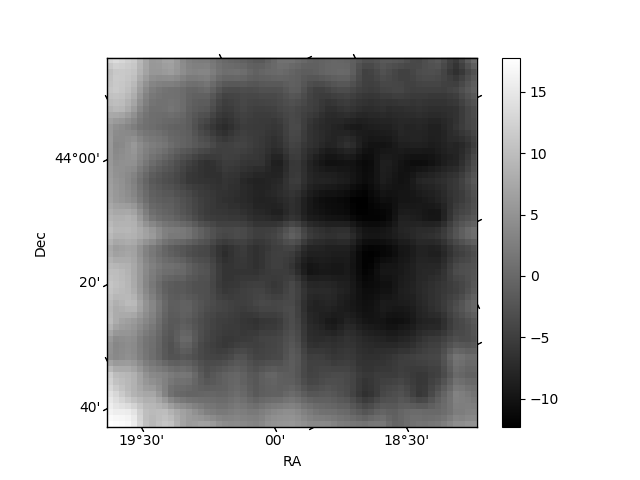
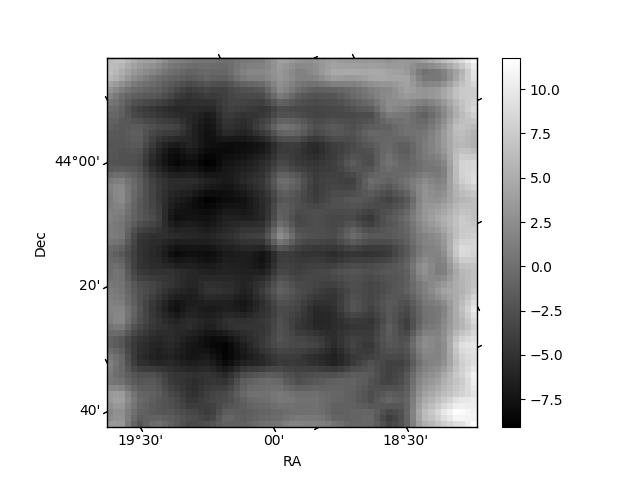
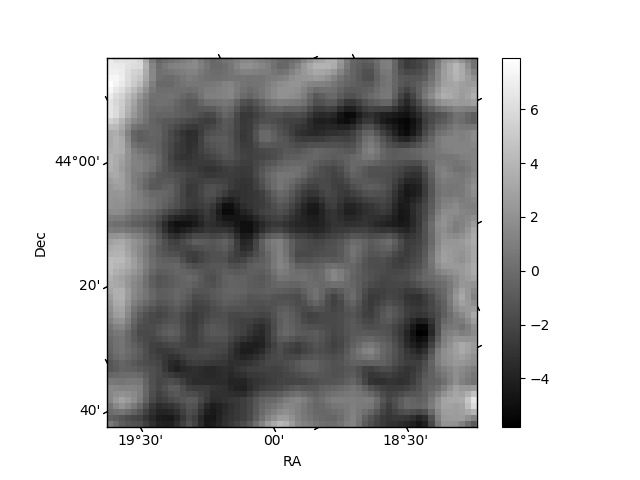
Histogram calculated using DETX and DETY for each event in the final _common_clean file
| Quadrant A | 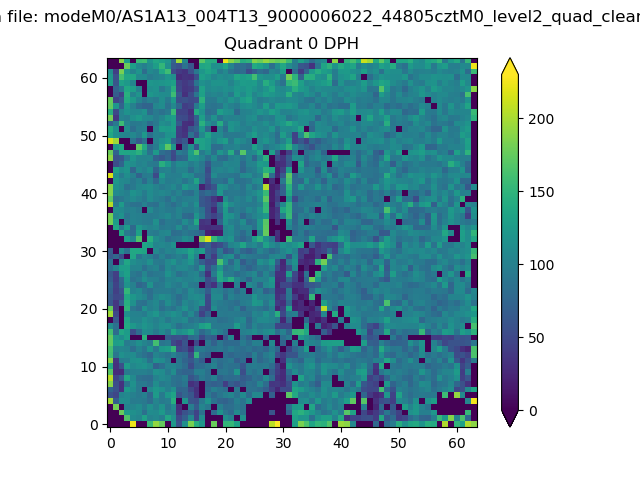 |
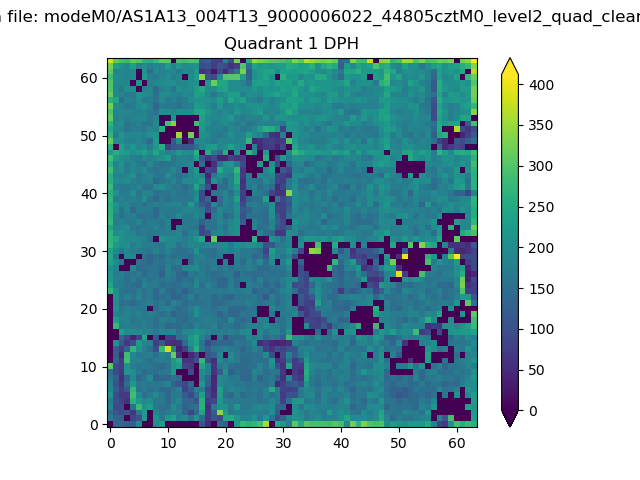 |
Quadrant B |
|---|---|---|---|
| Quadrant D | 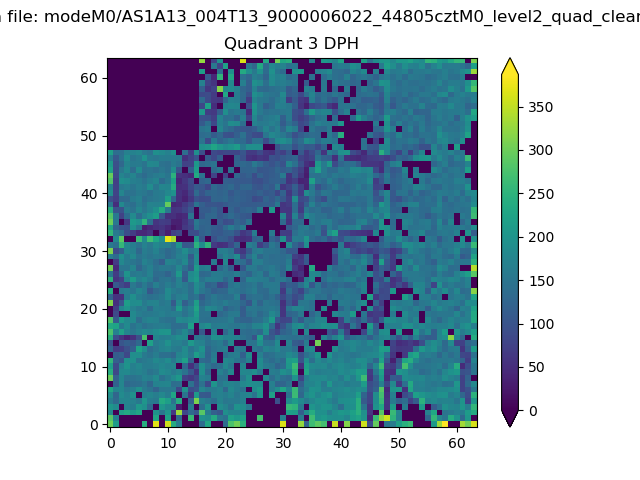 |
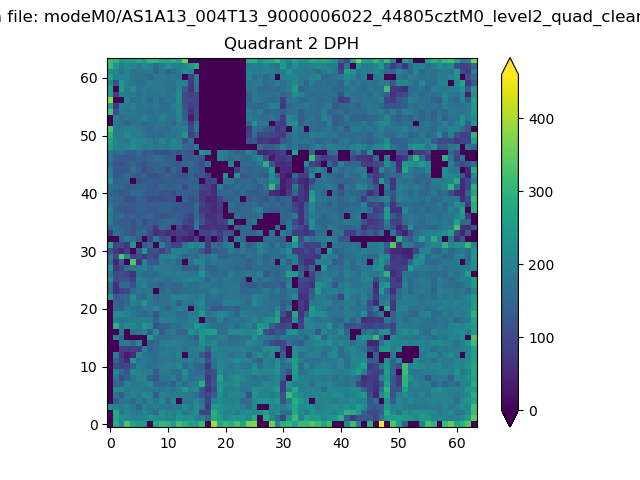 |
Quadrant C |
| Plot type | Count rate plots | Images |
|---|---|---|
| Comparison with Poisson distribution Blue bars denote a histogram of data divided into 1 sec bins. Red curve is a Poisson curve with rate = median count rate of data. |
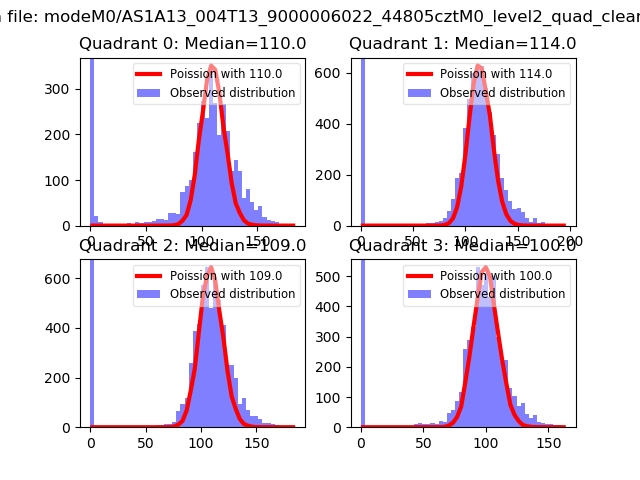 |
 |
| Quadrant-wise count rates Data is divided into 100 sec bins |
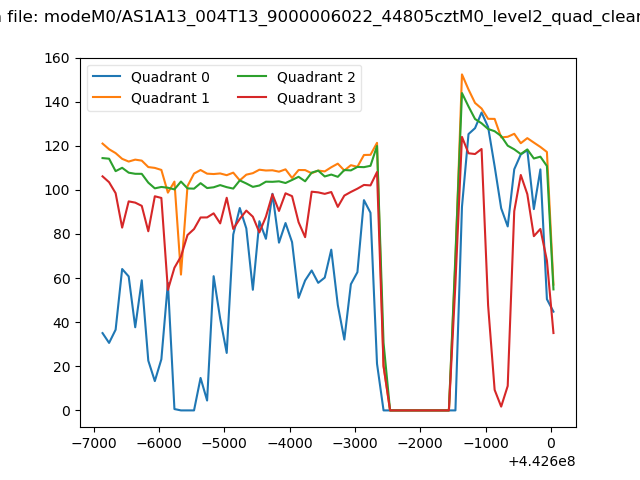 |
|
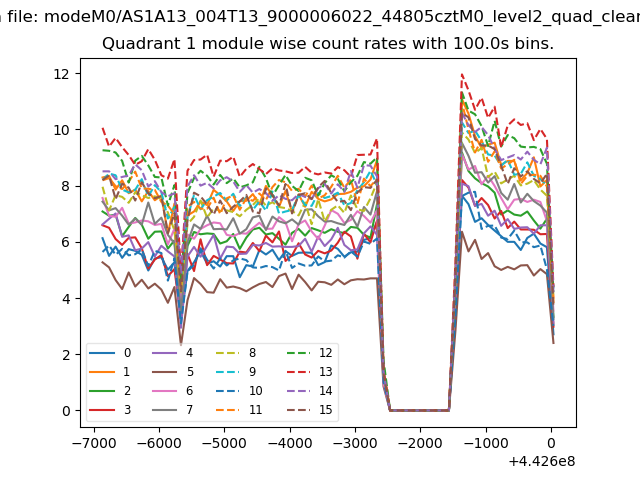
| Module-wise count rates for Quadrant A Data is divided into 100 sec bins |
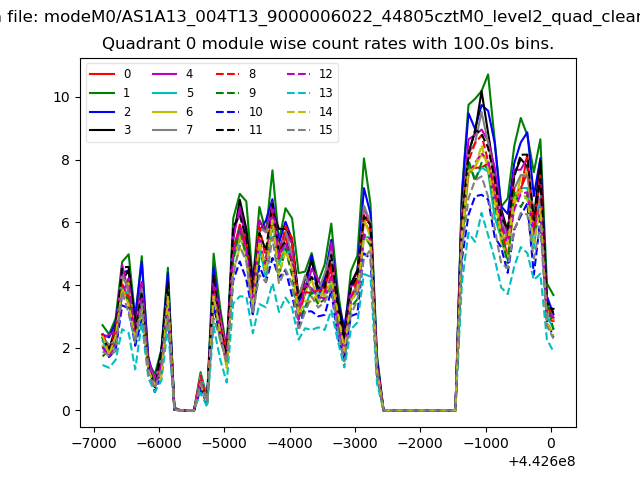 |
 |
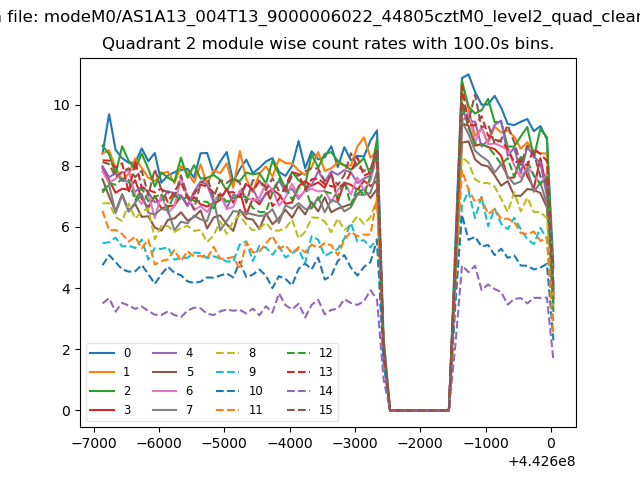
| Module-wise count rates for Quadrant B Data is divided into 100 sec bins |
 |
 |
| Module-wise count rates for Quadrant C Data is divided into 100 sec bins |
 |
 |
| Module-wise count rates for Quadrant D Data is divided into 100 sec bins |
 |
 |
| Parameter | Plot |
|---|---|
| CZT HV Monitor |  |
| D_VDD | 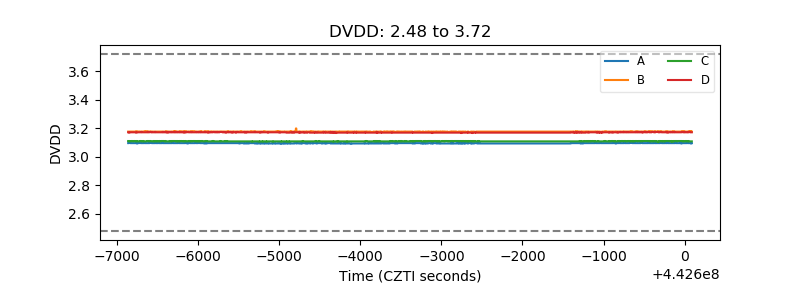 |
| Temperature 1 | 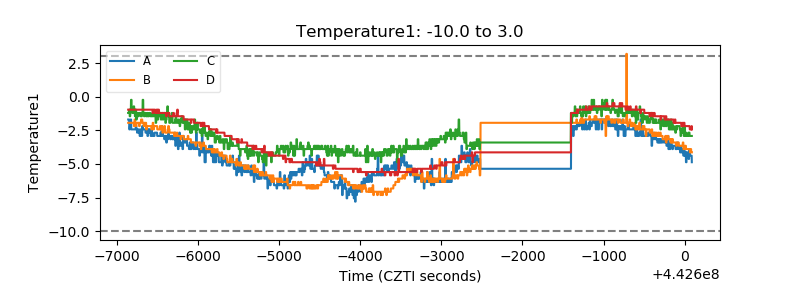 |
| Veto HV Monitor | 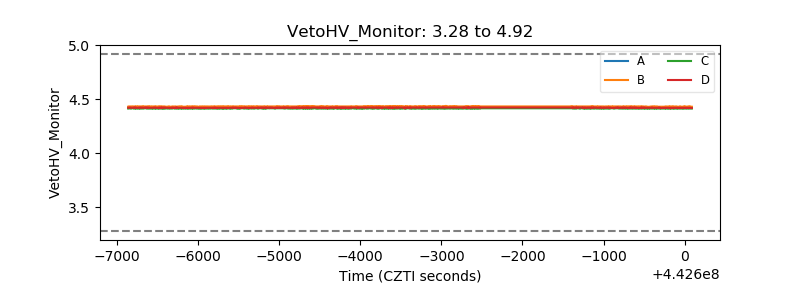 |
| Veto LLD | 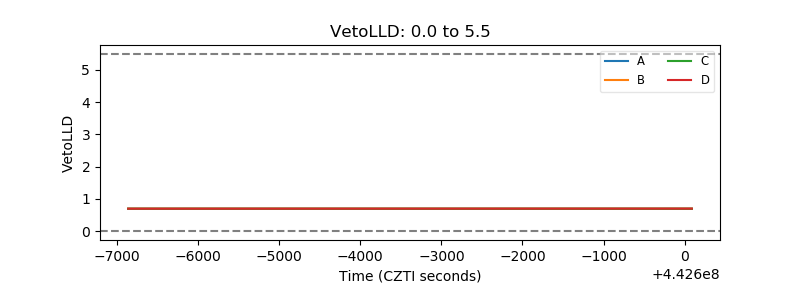 |
| Alpha Counter | 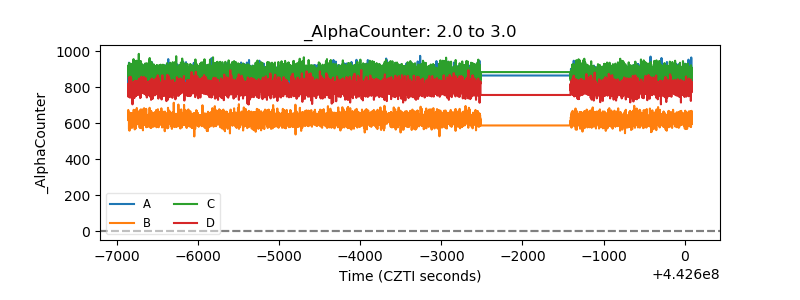 |
| _CPM_Rate | 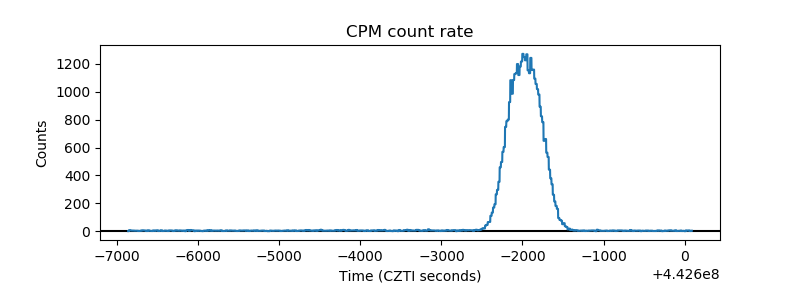 |
| CZT Counter | 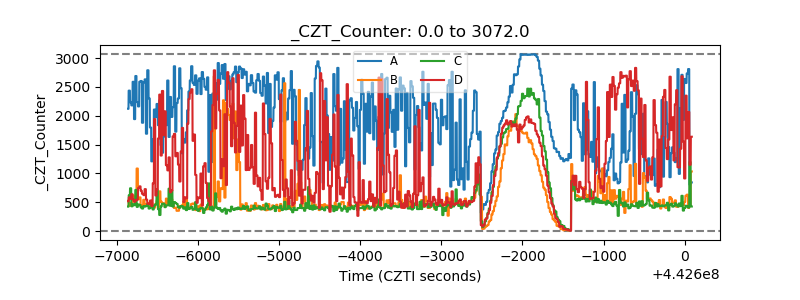 |
| +2.5 Volts monitor | 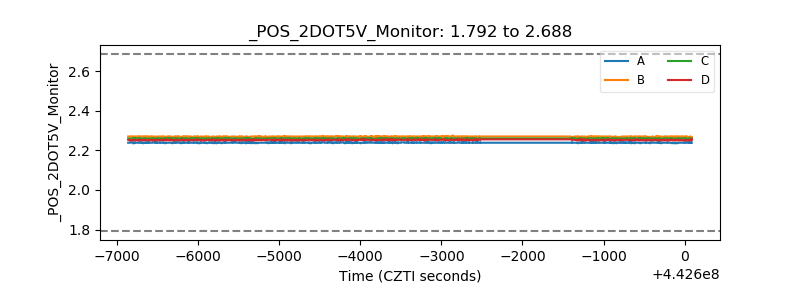 |
| +5 Volts monitor | 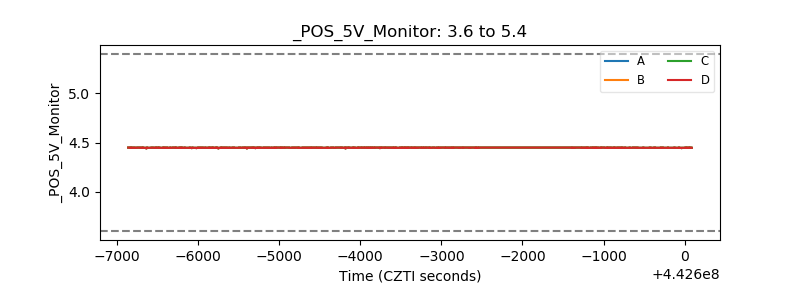 |
| _ROLL_ROT | 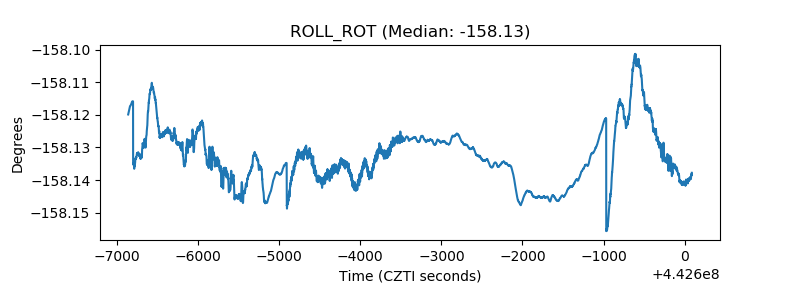 |
| _Roll_DEC | 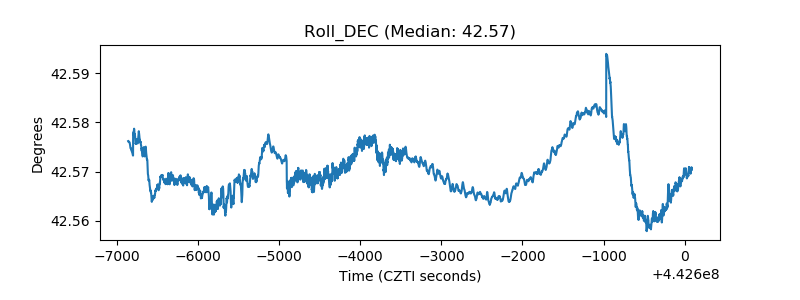 |
| _Roll_RA | 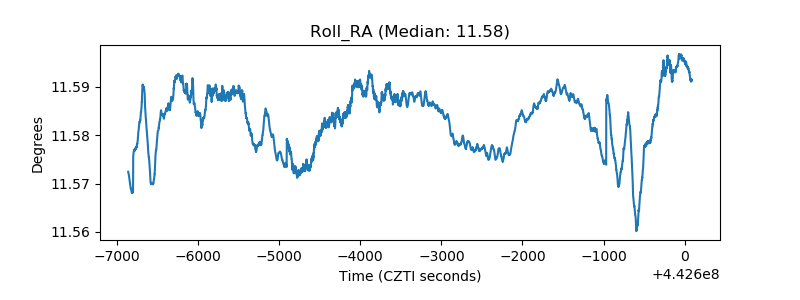 |
| Veto Counter |  |