| Param | Original file | Final file |
|---|---|---|
| Filename | modeM0/AS1A13_004T13_9000006022_44806cztM0_level2.fits | modeM0/AS1A13_004T13_9000006022_44806cztM0_level2_quad_clean.evt |
| Size (bytes) | 196,603,200 | 24,336,000 |
| Size | 187.5 MB | 23.2 MB |
| Events in quadrant A | 2,372,792 | 159,346 |
| Events in quadrant B | 952,361 | 189,841 |
| Events in quadrant C | 703,515 | 182,738 |
| Events in quadrant D | 3,122,267 | 87,055 |
| Mode M0 | |||
|---|---|---|---|
| Quadrant | BADHDUFLAG | Total packets | Discarded packets |
| A | 0 | 8152 | 0 |
| B | 0 | 3895 | 0 |
| C | 0 | 3256 | 0 |
| D | 0 | 10384 | 0 |
| Mode SS | |||
|---|---|---|---|
| Quadrant | BADHDUFLAG | Total packets | Discarded packets |
| A | 0 | 32 | 0 |
| B | 0 | 32 | 0 |
| C | 0 | 32 | 0 |
| D | 0 | 32 | 0 |
| Quadrant | Total seconds | Saturated seconds | Saturation percentage |
|---|---|---|---|
| A | 1600 | 371 | 23.187500% |
| B | 1601 | 24 | 1.499063% |
| C | 1601 | 1 | 0.062461% |
| D | 1601 | 848 | 52.966896% |
Noise dominated data is calculated using 1-second bins in cleaned event files. If a bin has >2000 counts, and if more than 50% of those come from <1% of pixels, then it is considered to be noise-dominated and hence unusable.
| Quadrant | # 1 sec bins | Bins with >0 counts | Bins with >2000 counts | High rate bins dominated by noise | Noise dominated (total time) | Noise dominated (detector-on time) | Marked lightcurve |
|---|---|---|---|---|---|---|---|
| A | 1600 | 1600 | 388 | 388 | 24.25% | 24.25% | 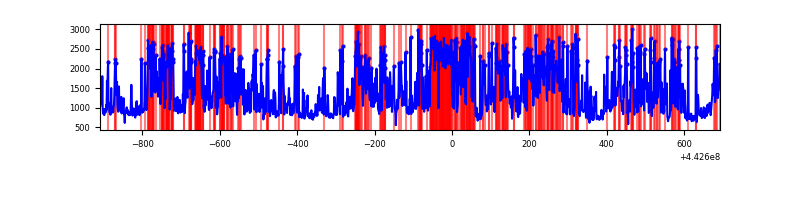 |
| B | 1601 | 1601 | 22 | 22 | 1.37% | 1.37% | 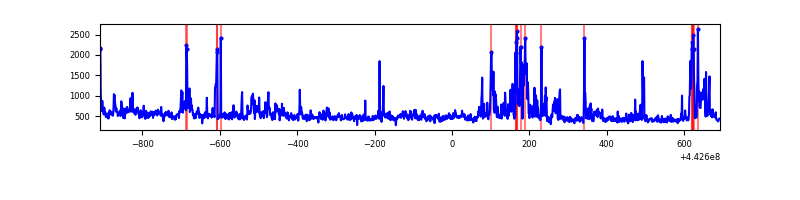 |
| C | 1601 | 1601 | 1 | 1 | 0.06% | 0.06% | 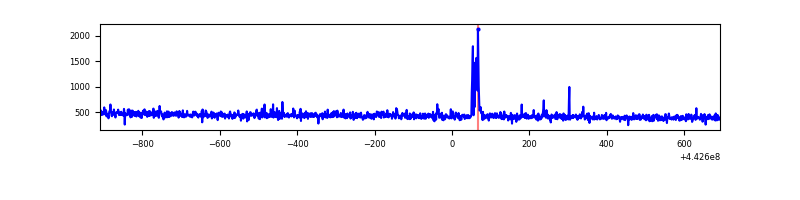 |
| D | 1600 | 1600 | 878 | 878 | 54.88% | 54.88% | 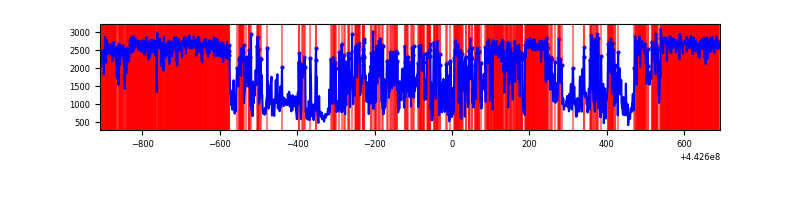 |
Top three noisy pixels from each quadrant. If the there are fewer than three noisy pixels in the level2.evt file, extra rows are filled as -1
| Pixel properties | Quadrant properties | ||||||
|---|---|---|---|---|---|---|---|
| Quadrant | DetID | PixID | Counts | Sigma | Mean | Median | Sigma |
| A | 15 | 223 | 1218522 | 34488.61 | 162 | 158 | 35.3 |
| A | 10 | 83 | 475953 | 13468.48 | 162 | 158 | 35.3 |
| A | 13 | 248 | 49171 | 1387.43 | 162 | 158 | 35.3 |
| B | 0 | 189 | 93327 | 2644.76 | 174 | 170 | 35.2 |
| B | 4 | 171 | 61655 | 1745.58 | 174 | 170 | 35.2 |
| B | 0 | 168 | 40487 | 1144.61 | 174 | 170 | 35.2 |
| C | 2 | 14 | 16900 | 391.23 | 173 | 174 | 42.8 |
| C | 1 | 3 | 4910 | 110.78 | 173 | 174 | 42.8 |
| C | 12 | 249 | 2155 | 46.34 | 173 | 174 | 42.8 |
| D | 13 | 187 | 1144029 | 32326.58 | 134 | 130 | 35.4 |
| D | 5 | 235 | 601000 | 16980.58 | 134 | 130 | 35.4 |
| D | 13 | 249 | 348106 | 9833.8 | 134 | 130 | 35.4 |
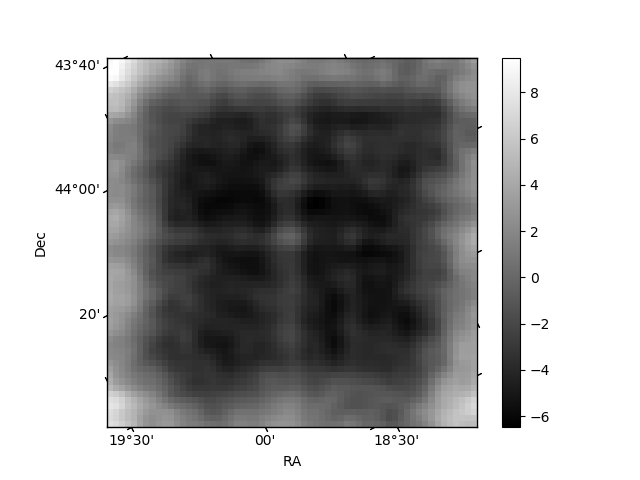
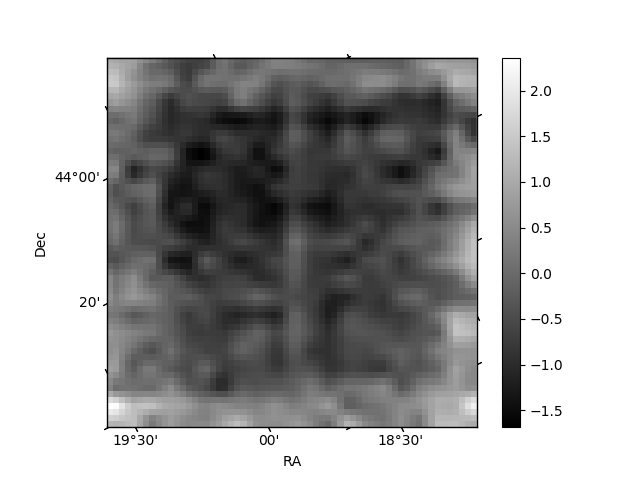
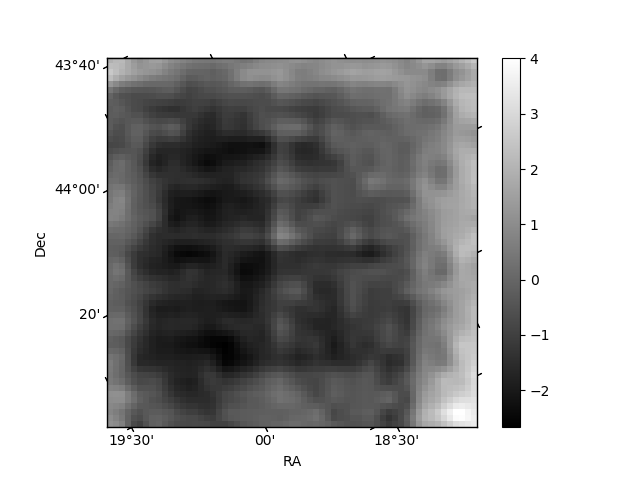
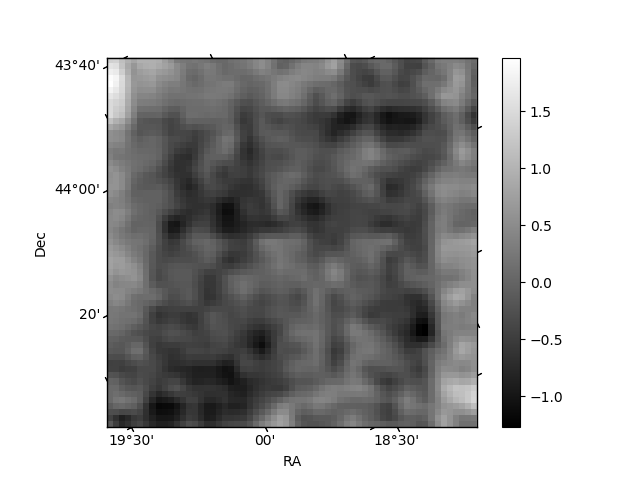
Histogram calculated using DETX and DETY for each event in the final _common_clean file
| Quadrant A | 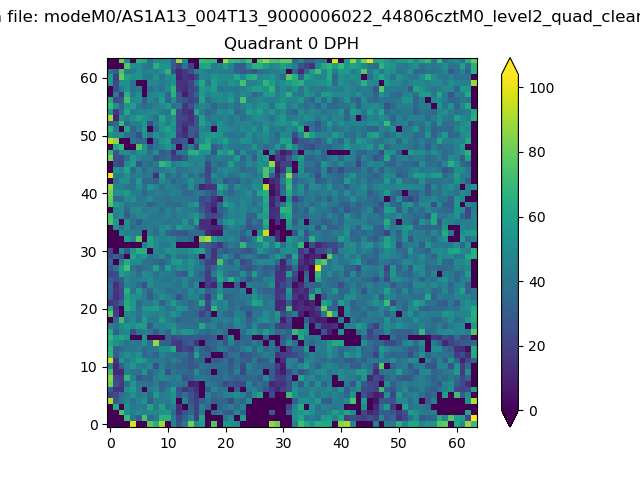 |
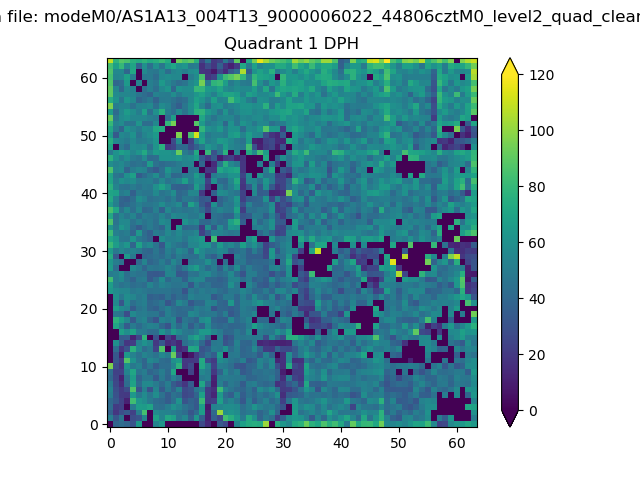 |
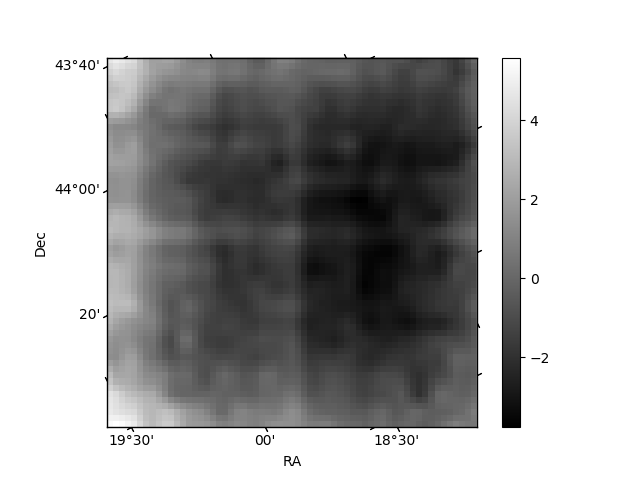
Quadrant B |
|---|---|---|---|
| Quadrant D | 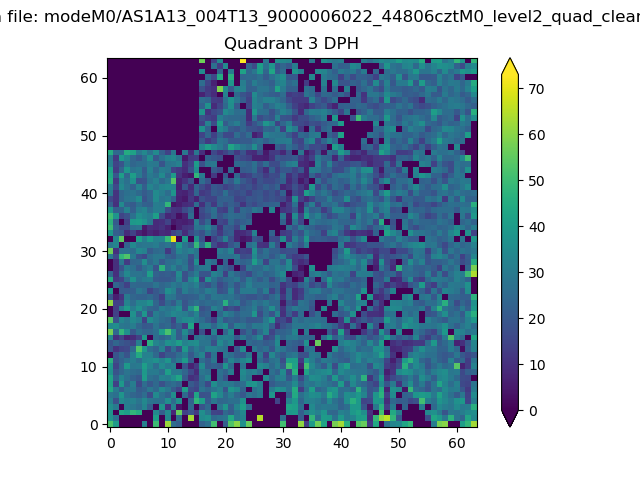 |
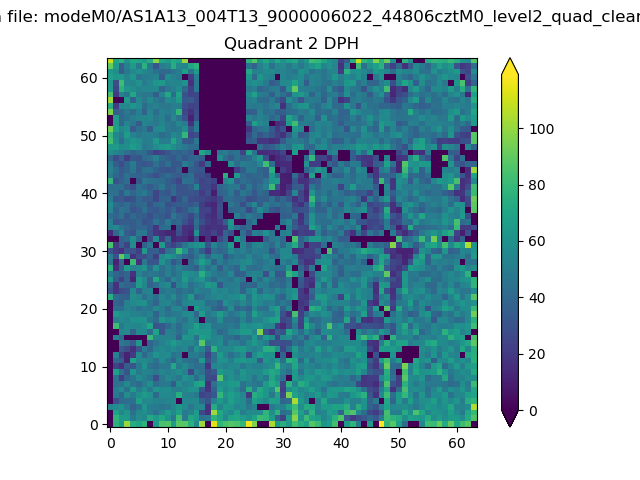 |
Quadrant C |
| Plot type | Count rate plots | Images |
|---|---|---|
| Comparison with Poisson distribution Blue bars denote a histogram of data divided into 1 sec bins. Red curve is a Poisson curve with rate = median count rate of data. |
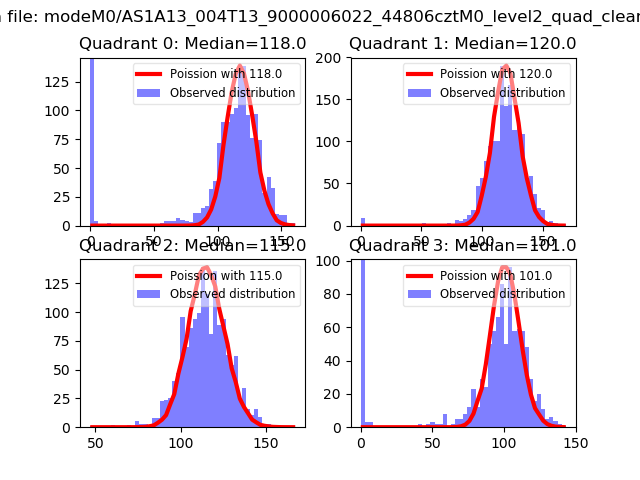 |
 |
| Quadrant-wise count rates Data is divided into 100 sec bins |
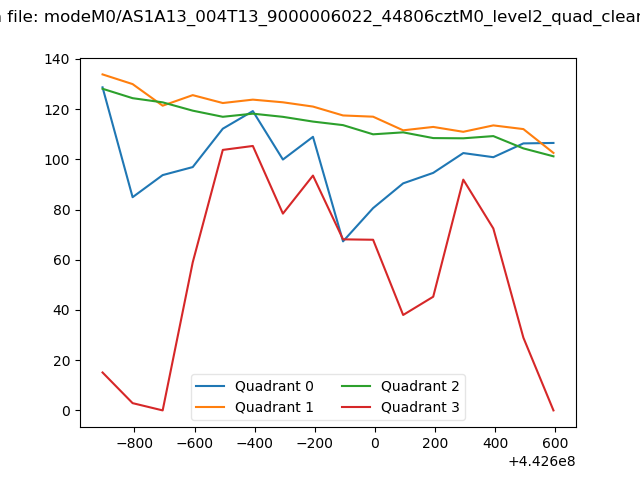 |
|
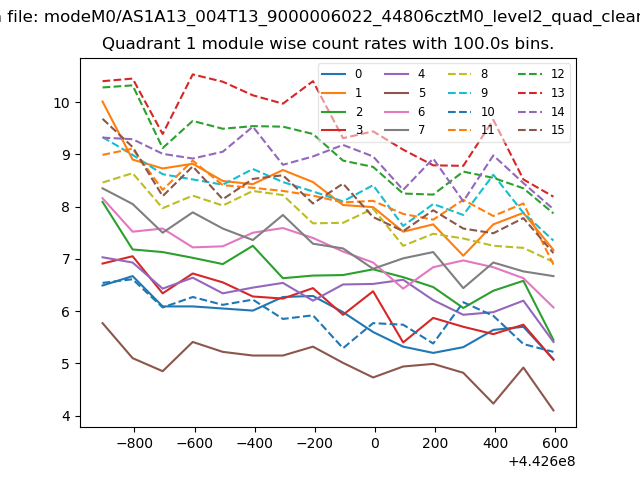
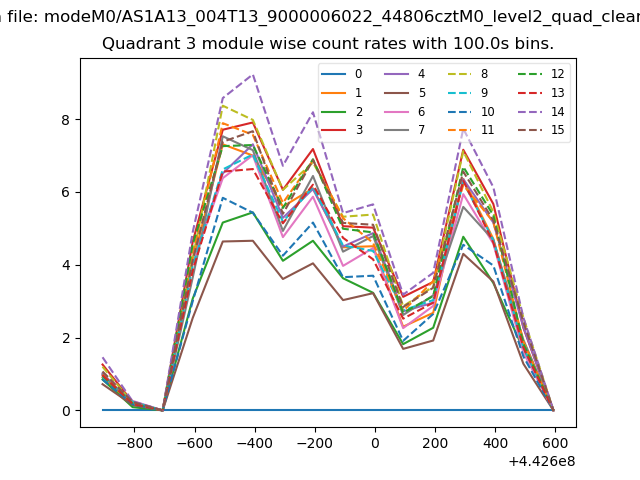
| Module-wise count rates for Quadrant A Data is divided into 100 sec bins |
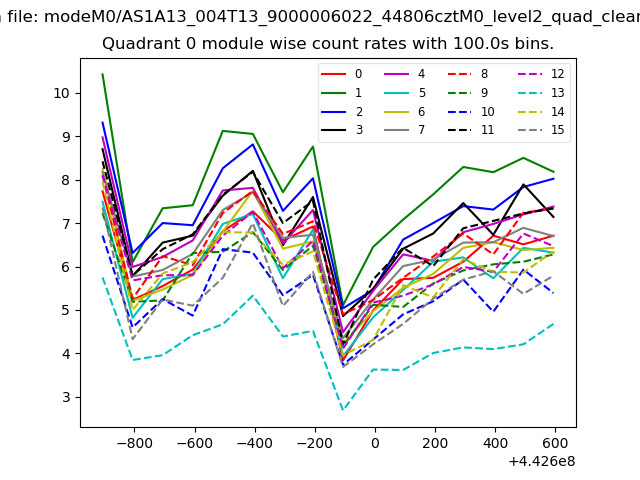 |
 |
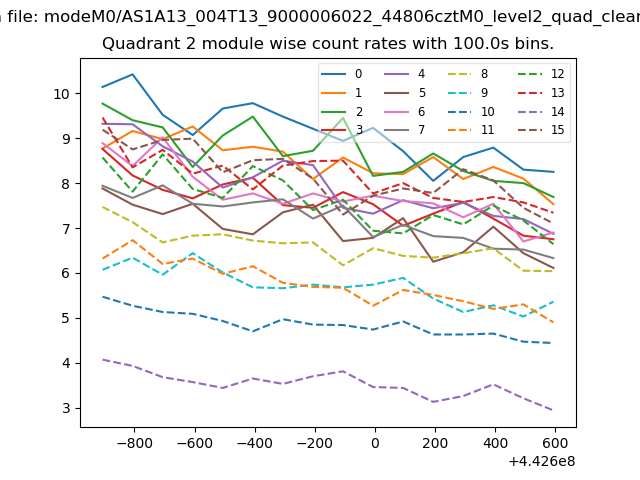
| Module-wise count rates for Quadrant B Data is divided into 100 sec bins |
 |
 |
| Module-wise count rates for Quadrant C Data is divided into 100 sec bins |
 |
 |
| Module-wise count rates for Quadrant D Data is divided into 100 sec bins |
 |
 |
| Parameter | Plot |
|---|---|
| CZT HV Monitor | 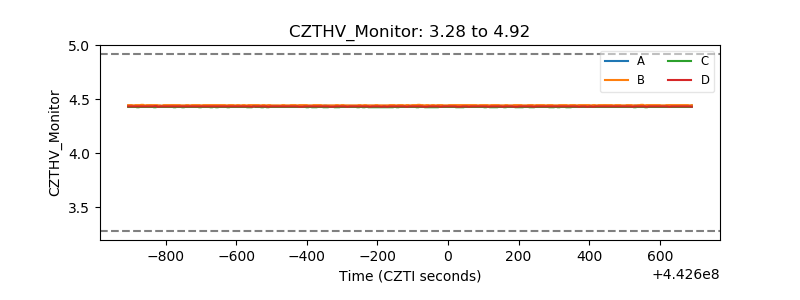 |
| D_VDD | 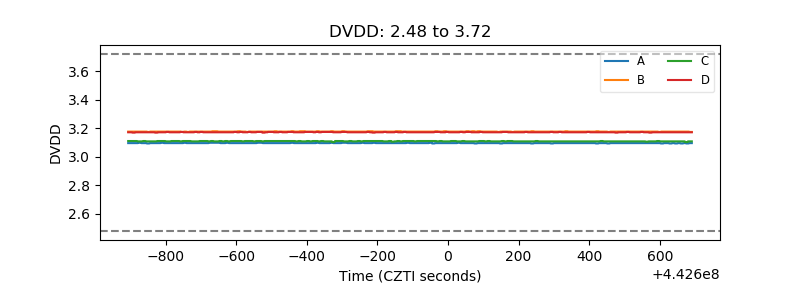 |
| Temperature 1 | 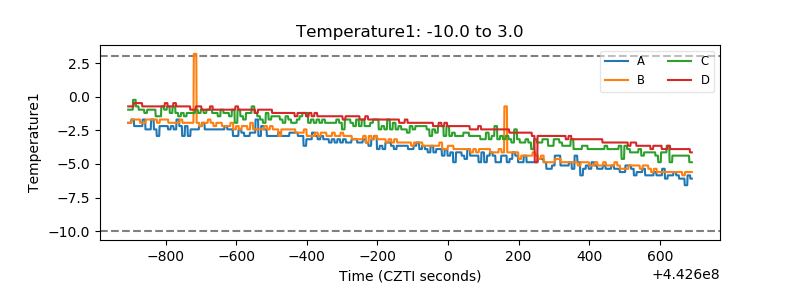 |
| Veto HV Monitor |  |
| Veto LLD | 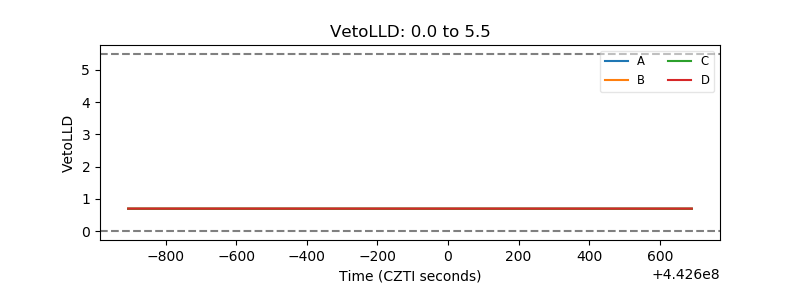 |
| Alpha Counter | 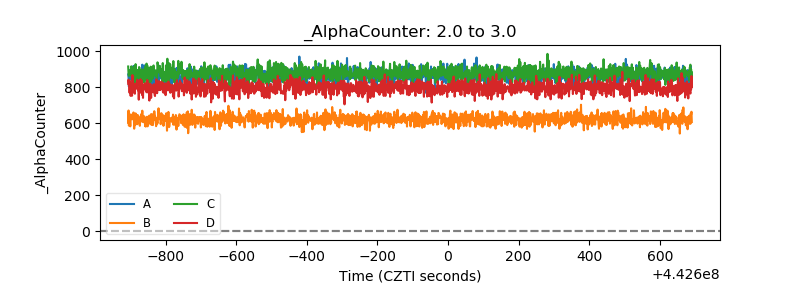 |
| _CPM_Rate | 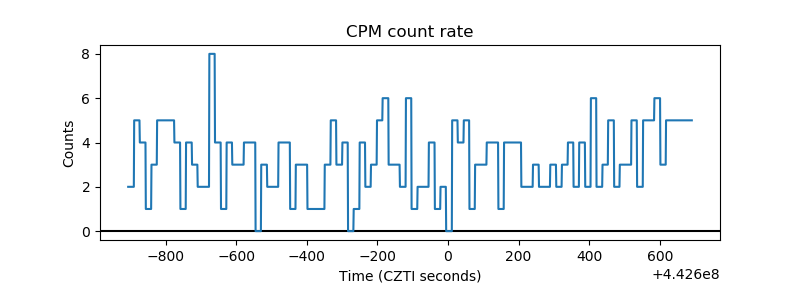 |
| CZT Counter | 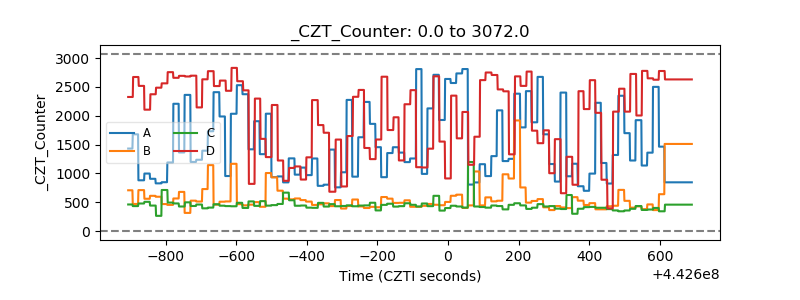 |
| +2.5 Volts monitor | 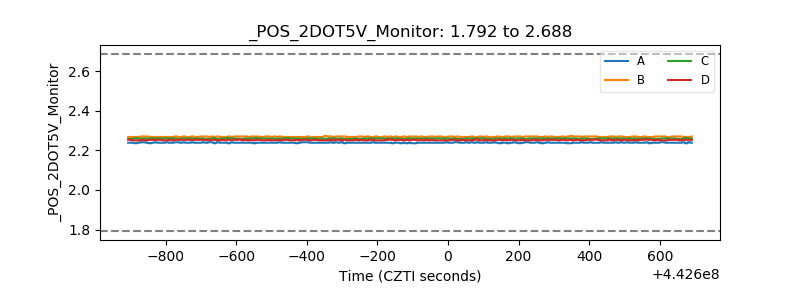 |
| +5 Volts monitor | 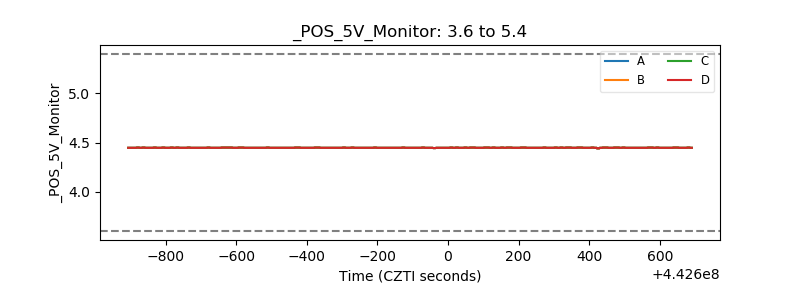 |
| _ROLL_ROT | 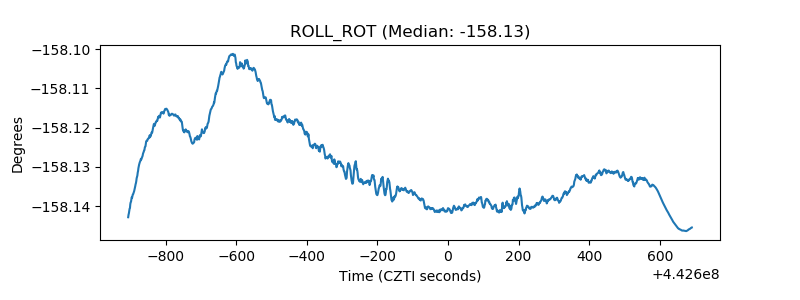 |
| _Roll_DEC | 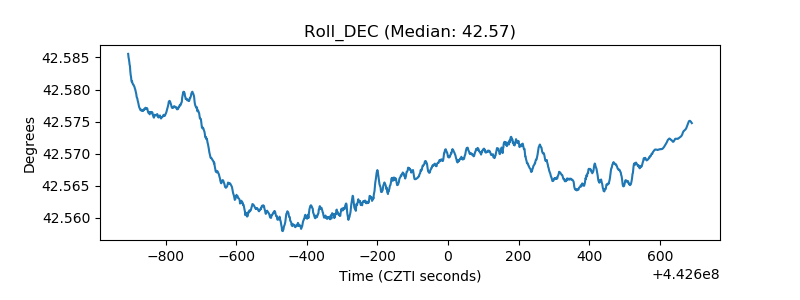 |
| _Roll_RA | 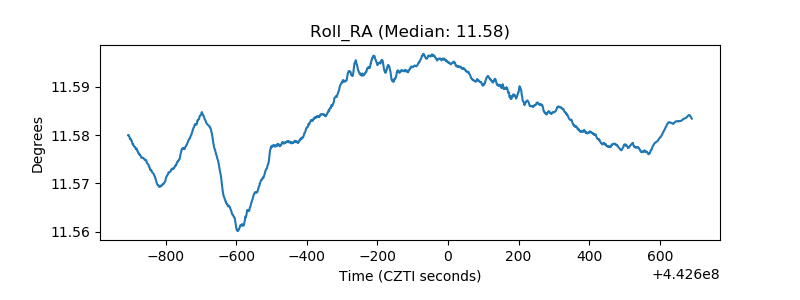 |
| Veto Counter | 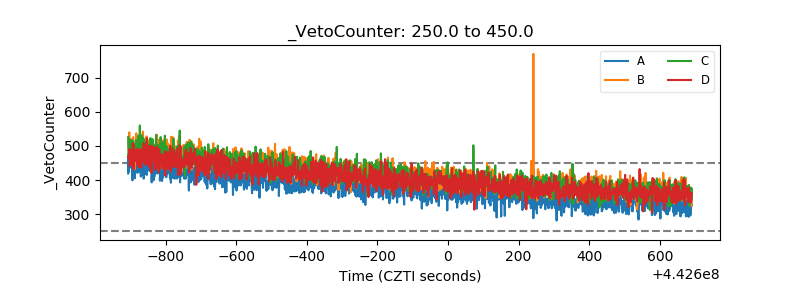 |