| Param | Original file | Final file |
|---|---|---|
| Filename | modeM0/AS1A13_012T01_9000006024_44807cztM0_level2.fits | modeM0/AS1A13_012T01_9000006024_44807cztM0_level2_quad_clean.evt |
| Size (bytes) | 667,408,320 | 102,156,480 |
| Size | 636.5 MB | 97.4 MB |
| Events in quadrant A | 9,927,552 | 595,863 |
| Events in quadrant B | 3,958,568 | 776,124 |
| Events in quadrant C | 2,991,673 | 746,956 |
| Events in quadrant D | 7,329,077 | 525,069 |
| Mode M0 | |||
|---|---|---|---|
| Quadrant | BADHDUFLAG | Total packets | Discarded packets |
| A | 0 | 33918 | 2 |
| B | 0 | 16001 | 2 |
| C | 0 | 13456 | 2 |
| D | 0 | 26114 | 3 |
| Mode SS | |||
|---|---|---|---|
| Quadrant | BADHDUFLAG | Total packets | Discarded packets |
| A | 0 | 132 | 0 |
| B | 0 | 132 | 0 |
| C | 0 | 132 | 0 |
| D | 0 | 132 | 0 |
| Mode M9 | |||
|---|---|---|---|
| Quadrant | BADHDUFLAG | Total packets | Discarded packets |
| A | 0 | 13 | 0 |
| B | 0 | 14 | 0 |
| C | 0 | 14 | 0 |
| D | 0 | 14 | 0 |
| Quadrant | Total seconds | Saturated seconds | Saturation percentage |
|---|---|---|---|
| A | 6436 | 1786 | 27.750155% |
| B | 6436 | 200 | 3.107520% |
| C | 6436 | 43 | 0.668117% |
| D | 6435 | 1500 | 23.310023% |
Noise dominated data is calculated using 1-second bins in cleaned event files. If a bin has >2000 counts, and if more than 50% of those come from <1% of pixels, then it is considered to be noise-dominated and hence unusable.
| Quadrant | # 1 sec bins | Bins with >0 counts | Bins with >2000 counts | High rate bins dominated by noise | Noise dominated (total time) | Noise dominated (detector-on time) | Marked lightcurve |
|---|---|---|---|---|---|---|---|
| A | 7655 | 6435 | 1633 | 1633 | 21.33% | 25.38% | 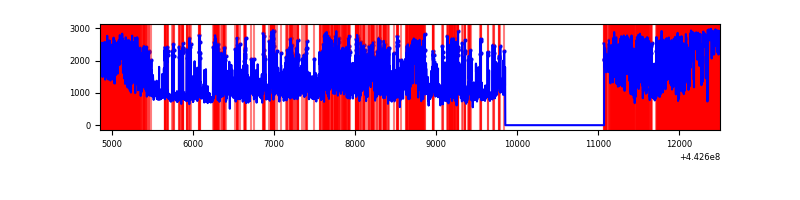 |
| B | 7656 | 6436 | 106 | 106 | 1.38% | 1.65% | 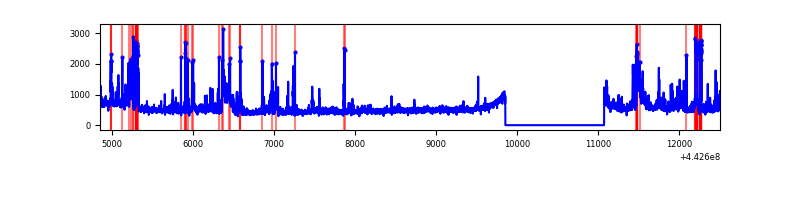 |
| C | 7656 | 6436 | 7 | 7 | 0.09% | 0.11% | 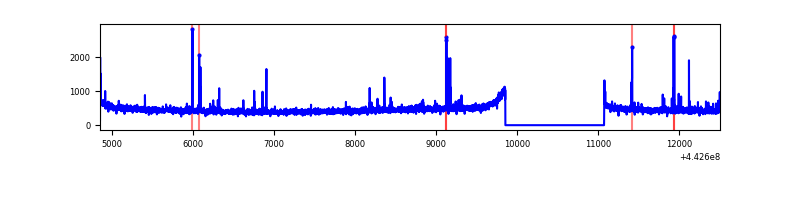 |
| D | 7655 | 6435 | 1460 | 1460 | 19.07% | 22.69% | 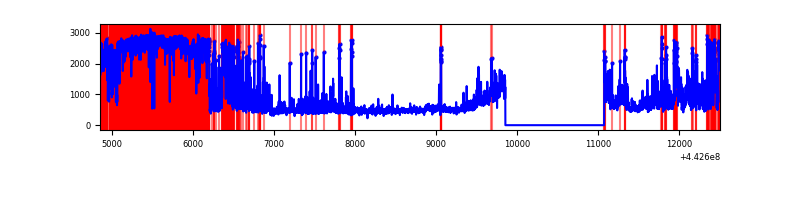 |
Top three noisy pixels from each quadrant. If the there are fewer than three noisy pixels in the level2.evt file, extra rows are filled as -1
| Pixel properties | Quadrant properties | ||||||
|---|---|---|---|---|---|---|---|
| Quadrant | DetID | PixID | Counts | Sigma | Mean | Median | Sigma |
| A | 15 | 223 | 5244096 | 37071.01 | 684 | 670 | 141.4 |
| A | 10 | 83 | 1965490 | 13891.27 | 684 | 670 | 141.4 |
| A | 13 | 248 | 44779 | 311.85 | 684 | 670 | 141.4 |
| B | 0 | 189 | 413385 | 2770.95 | 755 | 734 | 148.9 |
| B | 0 | 168 | 156569 | 1046.43 | 755 | 734 | 148.9 |
| B | 0 | 155 | 126824 | 846.69 | 755 | 734 | 148.9 |
| C | 1 | 3 | 44216 | 249.97 | 737 | 742 | 173.9 |
| C | 14 | 254 | 20484 | 113.51 | 737 | 742 | 173.9 |
| C | 12 | 2 | 19750 | 109.29 | 737 | 742 | 173.9 |
| D | 13 | 187 | 2313396 | 14183.3 | 645 | 627 | 163.1 |
| D | 5 | 235 | 977734 | 5992.21 | 645 | 627 | 163.1 |
| D | 1 | 52 | 564612 | 3458.7 | 645 | 627 | 163.1 |
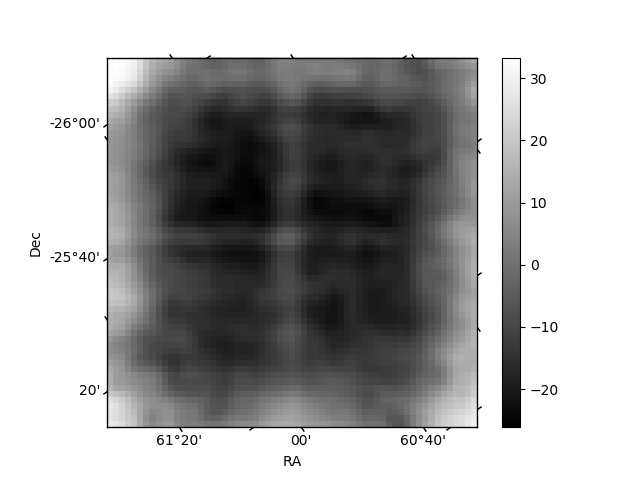
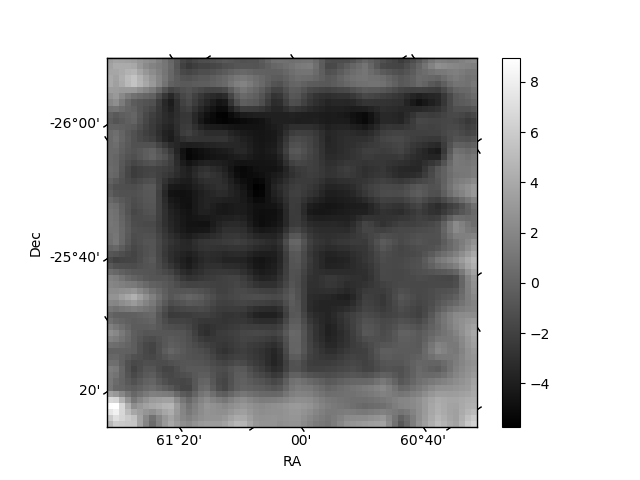
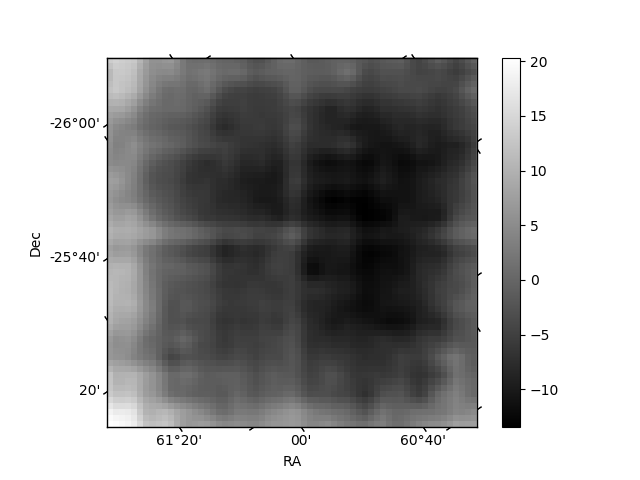
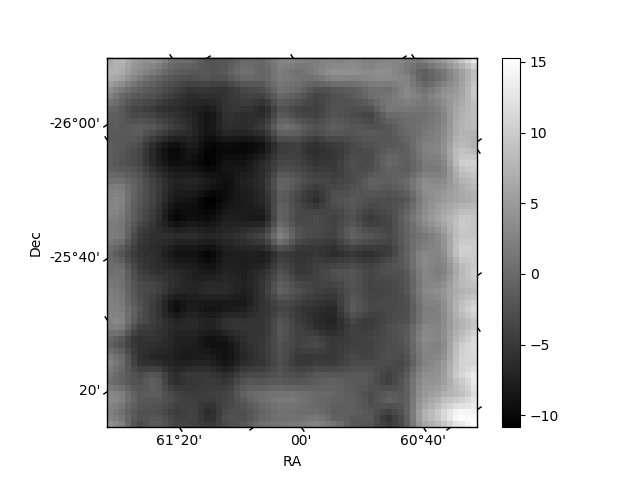
Histogram calculated using DETX and DETY for each event in the final _common_clean file
| Quadrant A | 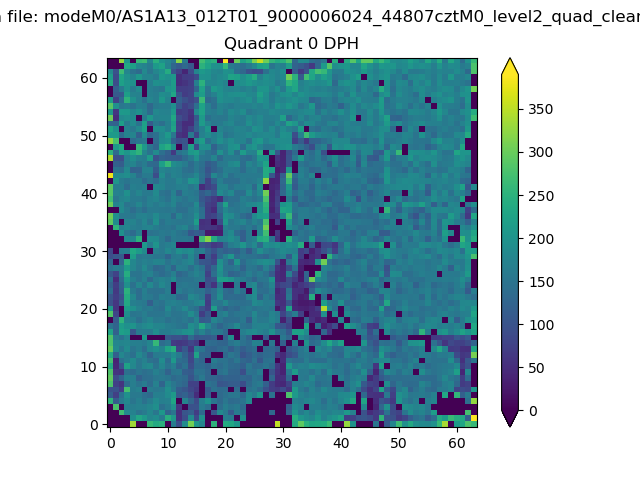 |
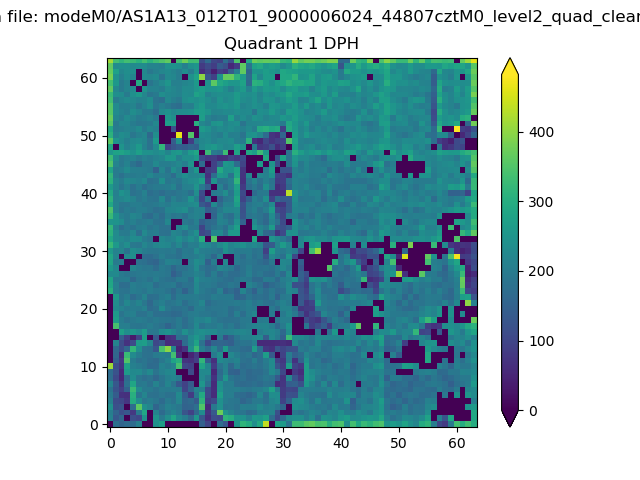 |
Quadrant B |
|---|---|---|---|
| Quadrant D | 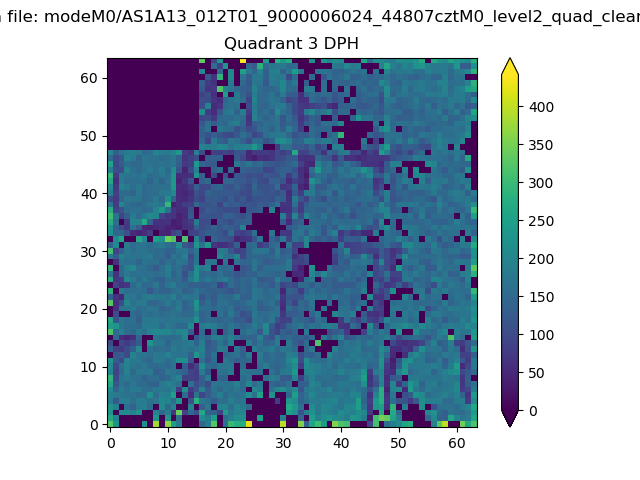 |
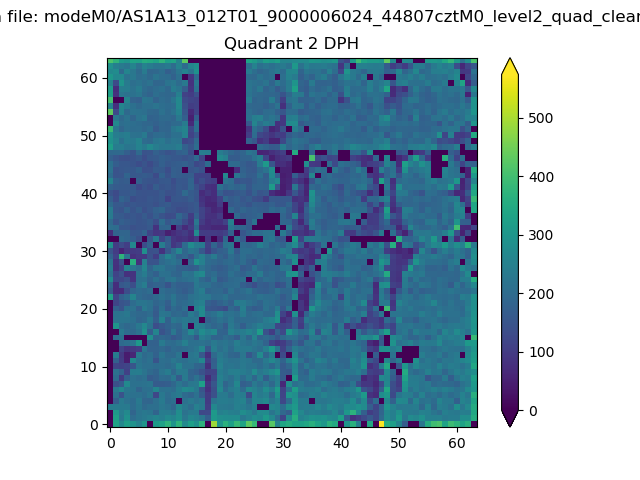 |
Quadrant C |
| Plot type | Count rate plots | Images |
|---|---|---|
| Comparison with Poisson distribution Blue bars denote a histogram of data divided into 1 sec bins. Red curve is a Poisson curve with rate = median count rate of data. |
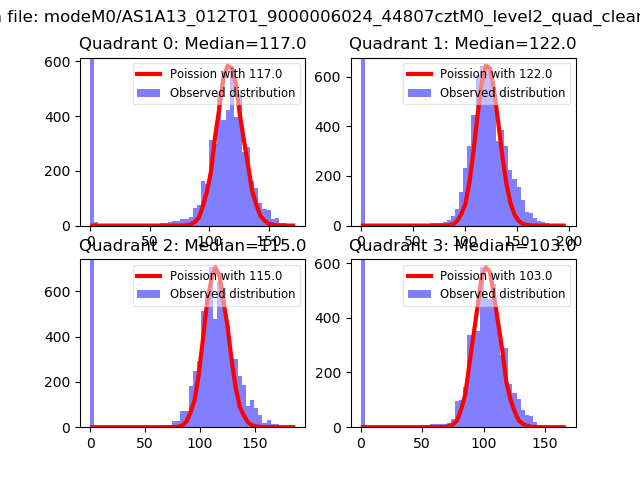 |
 |
| Quadrant-wise count rates Data is divided into 100 sec bins |
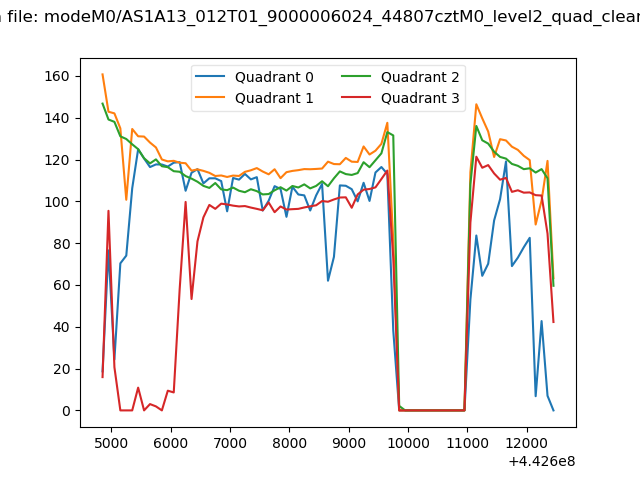 |
|
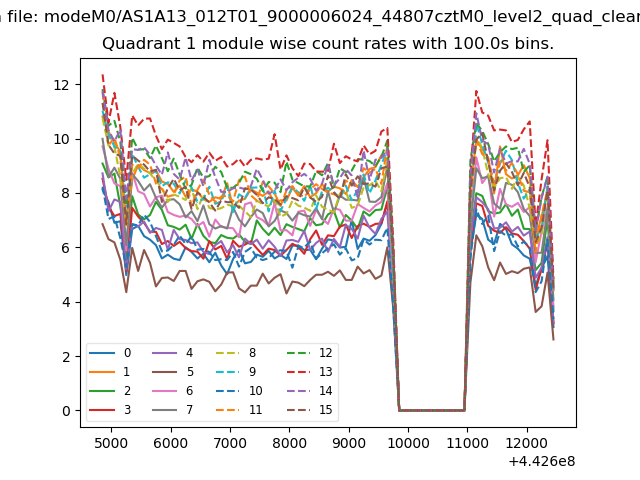
| Module-wise count rates for Quadrant A Data is divided into 100 sec bins |
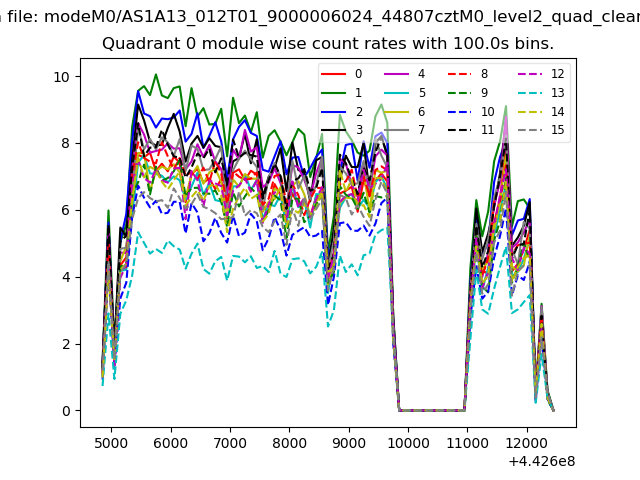 |
 |
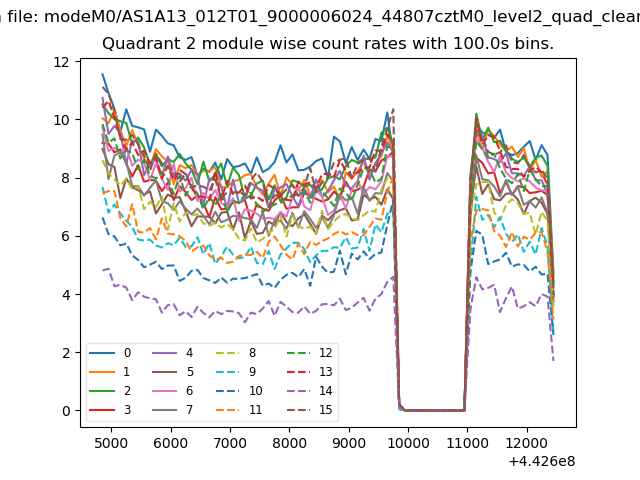
| Module-wise count rates for Quadrant B Data is divided into 100 sec bins |
 |
 |
| Module-wise count rates for Quadrant C Data is divided into 100 sec bins |
 |
 |
| Module-wise count rates for Quadrant D Data is divided into 100 sec bins |
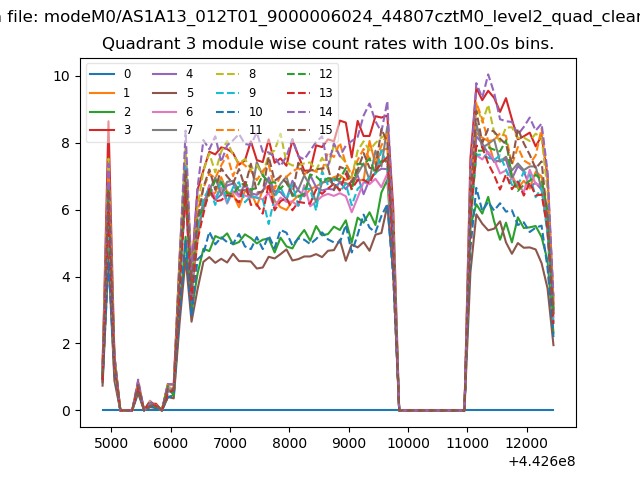 |
 |
| Parameter | Plot |
|---|---|
| CZT HV Monitor | 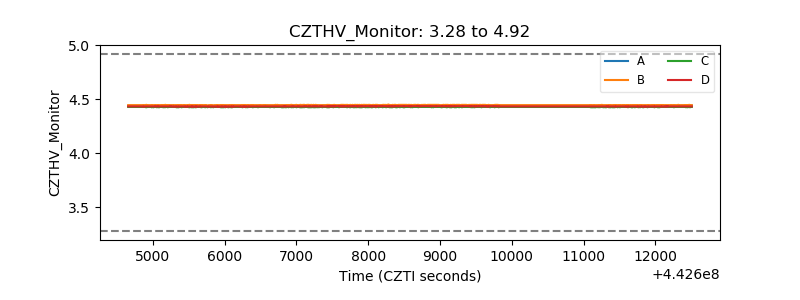 |
| D_VDD | 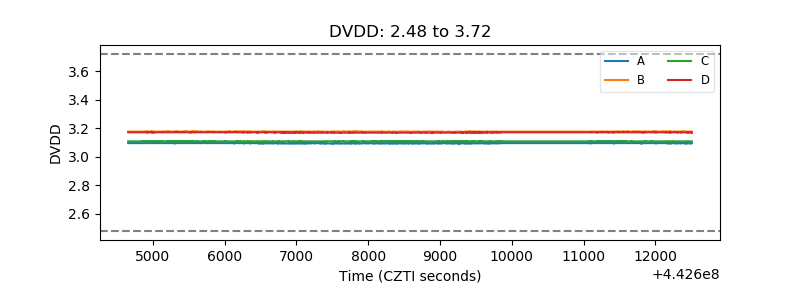 |
| Temperature 1 | 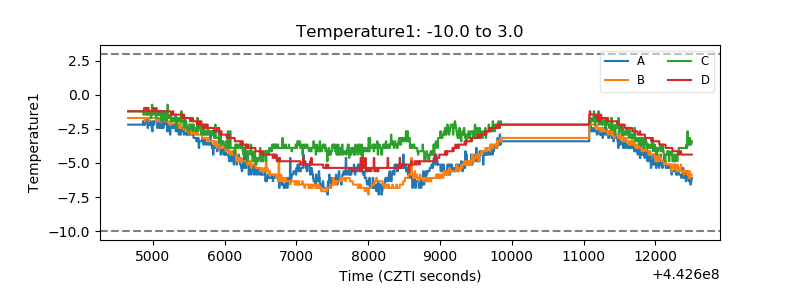 |
| Veto HV Monitor | 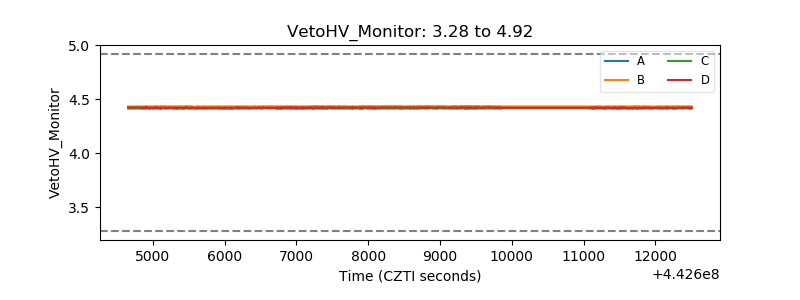 |
| Veto LLD | 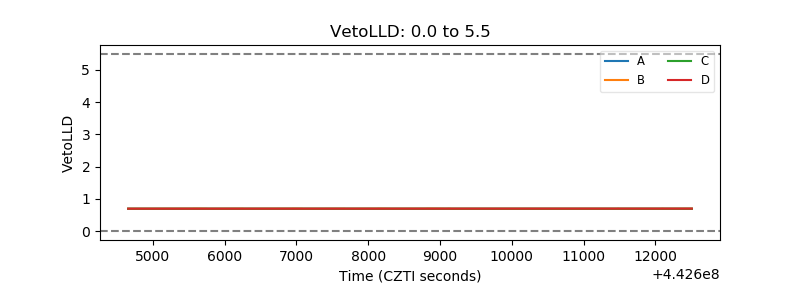 |
| Alpha Counter | 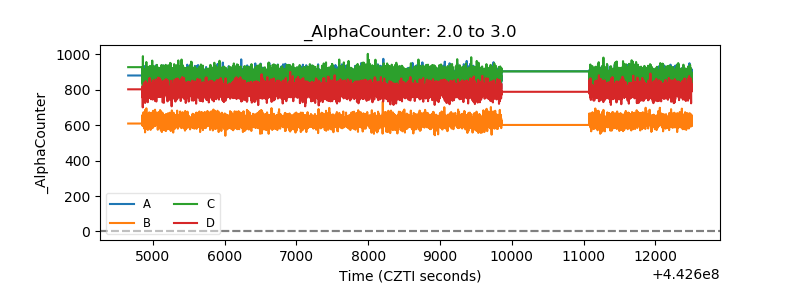 |
| _CPM_Rate | 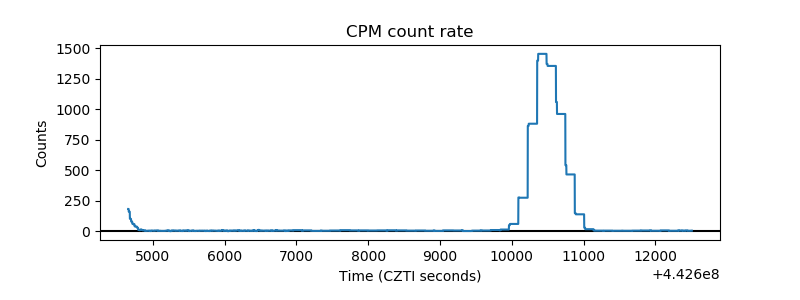 |
| CZT Counter | 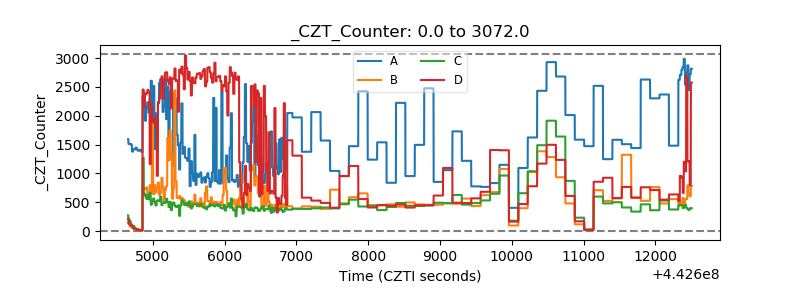 |
| +2.5 Volts monitor | 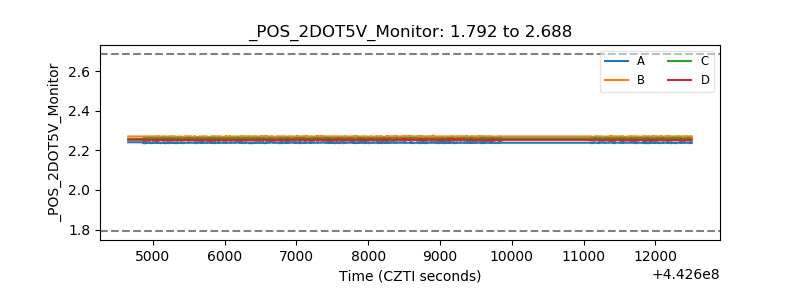 |
| +5 Volts monitor | 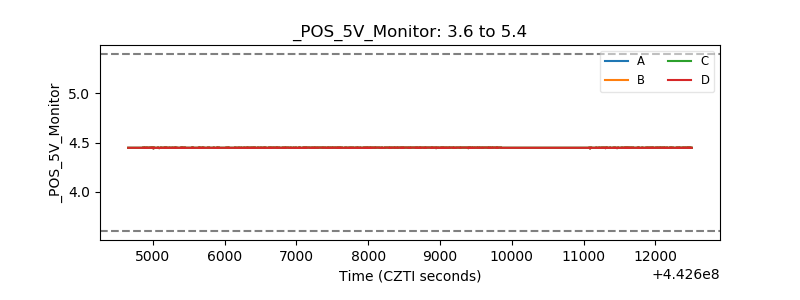 |
| _ROLL_ROT |  |
| _Roll_DEC | 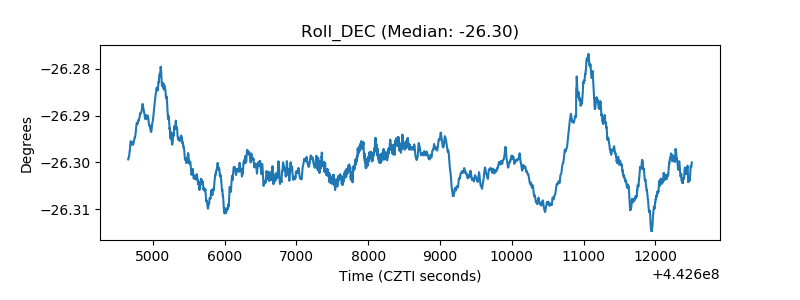 |
| _Roll_RA | 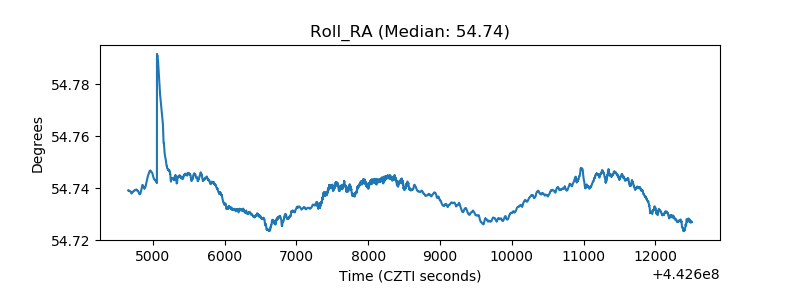 |
| Veto Counter | 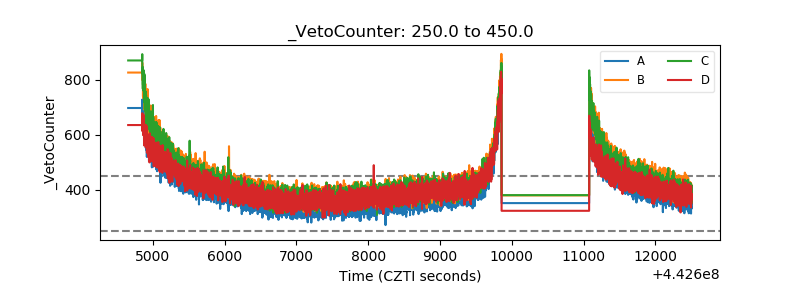 |