| Param | Original file | Final file |
|---|---|---|
| Filename | modeM0/AS1A13_017T01_9000006028_44821cztM0_level2.fits | modeM0/AS1A13_017T01_9000006028_44821cztM0_level2_quad_clean.evt |
| Size (bytes) | 344,701,440 | 52,793,280 |
| Size | 328.7 MB | 50.3 MB |
| Events in quadrant A | 3,532,960 | 346,098 |
| Events in quadrant B | 1,802,427 | 400,360 |
| Events in quadrant C | 1,655,286 | 393,172 |
| Events in quadrant D | 5,514,045 | 227,223 |
| Mode M0 | |||
|---|---|---|---|
| Quadrant | BADHDUFLAG | Total packets | Discarded packets |
| A | 0 | 13020 | 1 |
| B | 0 | 7486 | 1 |
| C | 0 | 7094 | 1 |
| D | 0 | 18646 | 1 |
| Mode SS | |||
|---|---|---|---|
| Quadrant | BADHDUFLAG | Total packets | Discarded packets |
| A | 0 | 66 | 0 |
| B | 0 | 66 | 0 |
| C | 0 | 66 | 0 |
| D | 0 | 66 | 0 |
| Mode M9 | |||
|---|---|---|---|
| Quadrant | BADHDUFLAG | Total packets | Discarded packets |
| A | 0 | 13 | 0 |
| B | 0 | 13 | 0 |
| C | 0 | 13 | 0 |
| D | 0 | 13 | 0 |
| Quadrant | Total seconds | Saturated seconds | Saturation percentage |
|---|---|---|---|
| A | 3268 | 516 | 15.789474% |
| B | 3267 | 143 | 4.377104% |
| C | 3267 | 61 | 1.867156% |
| D | 3267 | 1313 | 40.189777% |
Noise dominated data is calculated using 1-second bins in cleaned event files. If a bin has >2000 counts, and if more than 50% of those come from <1% of pixels, then it is considered to be noise-dominated and hence unusable.
| Quadrant | # 1 sec bins | Bins with >0 counts | Bins with >2000 counts | High rate bins dominated by noise | Noise dominated (total time) | Noise dominated (detector-on time) | Marked lightcurve |
|---|---|---|---|---|---|---|---|
| A | 4498 | 3269 | 331 | 331 | 7.36% | 10.13% | 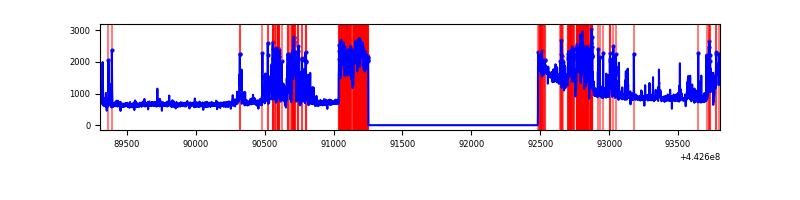 |
| B | 4497 | 3268 | 36 | 36 | 0.80% | 1.10% | 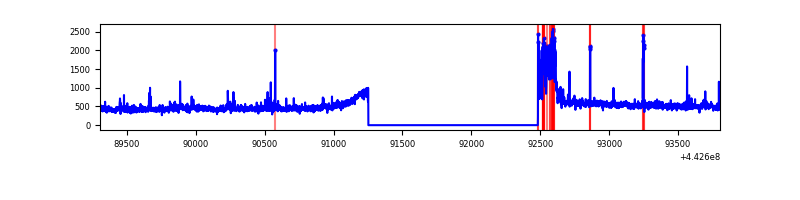 |
| C | 4497 | 3268 | 6 | 6 | 0.13% | 0.18% | 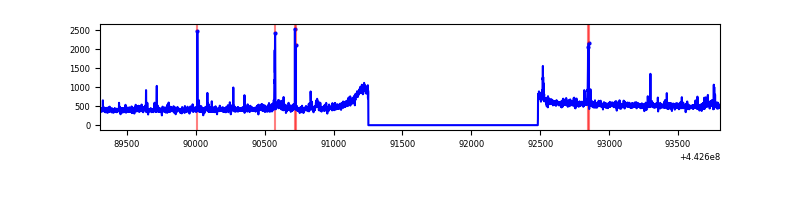 |
| D | 4497 | 3268 | 1150 | 1150 | 25.57% | 35.19% | 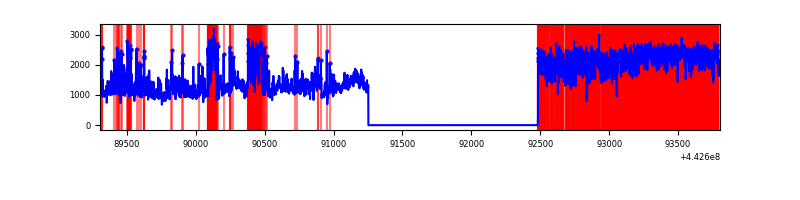 |
Top three noisy pixels from each quadrant. If the there are fewer than three noisy pixels in the level2.evt file, extra rows are filled as -1
| Pixel properties | Quadrant properties | ||||||
|---|---|---|---|---|---|---|---|
| Quadrant | DetID | PixID | Counts | Sigma | Mean | Median | Sigma |
| A | 10 | 83 | 1039536 | 13480.29 | 368 | 361 | 77.1 |
| A | 15 | 223 | 860540 | 11158.34 | 368 | 361 | 77.1 |
| A | 13 | 248 | 175336 | 2269.8 | 368 | 361 | 77.1 |
| B | 15 | 36 | 122560 | 1505.69 | 401 | 389 | 81.1 |
| B | 5 | 255 | 24845 | 301.41 | 401 | 389 | 81.1 |
| B | 0 | 186 | 11877 | 141.58 | 401 | 389 | 81.1 |
| C | 12 | 2 | 24996 | 262.21 | 399 | 402 | 93.8 |
| C | 3 | 233 | 20177 | 210.83 | 399 | 402 | 93.8 |
| C | 2 | 14 | 17989 | 187.5 | 399 | 402 | 93.8 |
| D | 13 | 187 | 2770330 | 30499.39 | 350 | 337 | 90.8 |
| D | 1 | 52 | 659866 | 7261.83 | 350 | 337 | 90.8 |
| D | 13 | 174 | 206822 | 2273.53 | 350 | 337 | 90.8 |
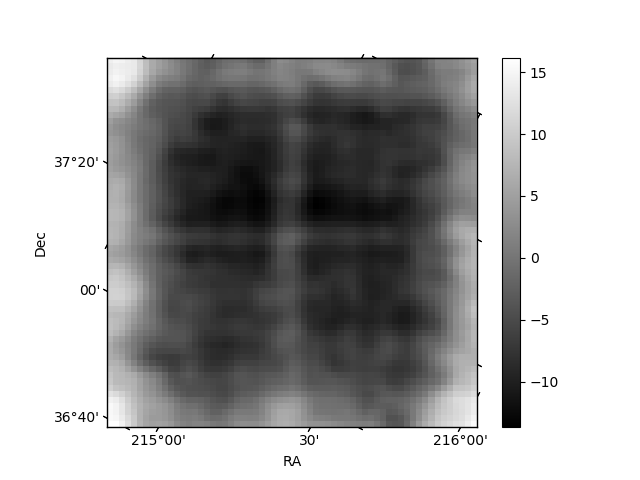
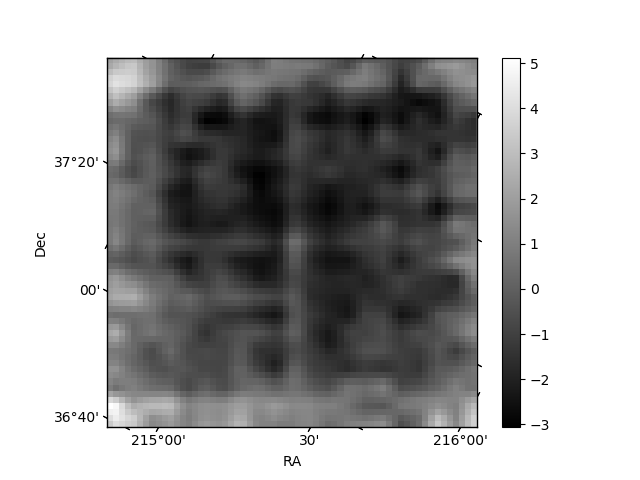
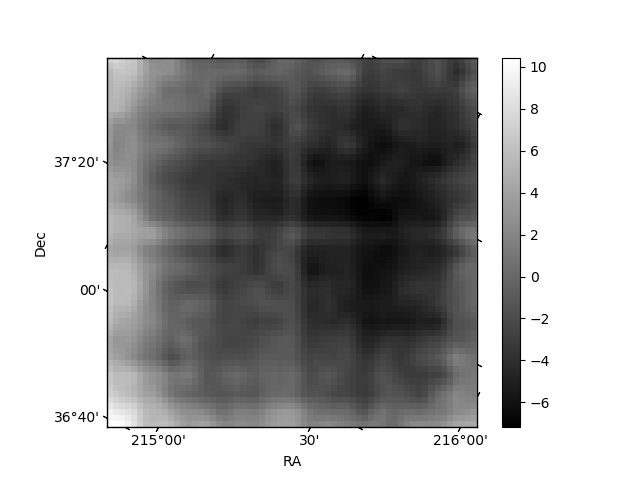
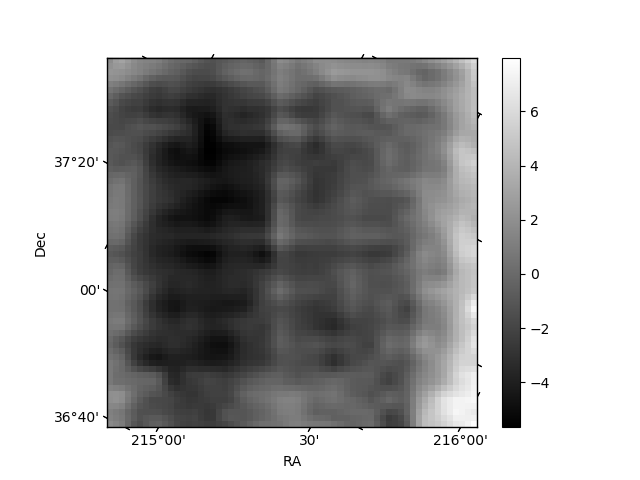
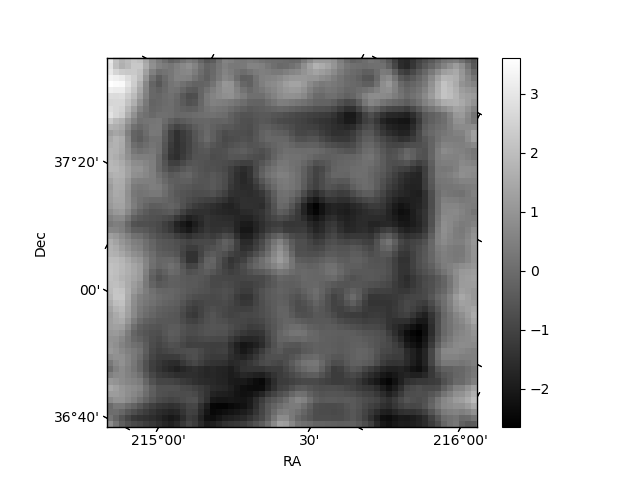
Histogram calculated using DETX and DETY for each event in the final _common_clean file
| Quadrant A | 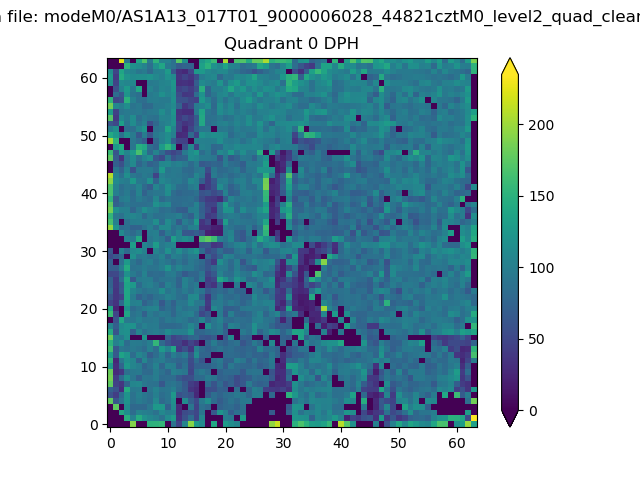 |
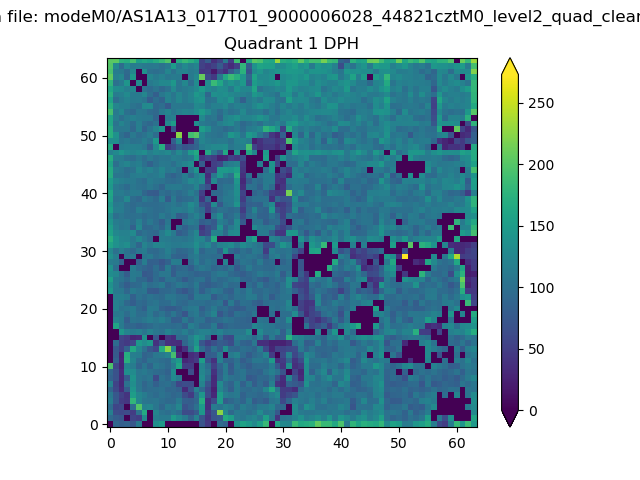 |
Quadrant B |
|---|---|---|---|
| Quadrant D | 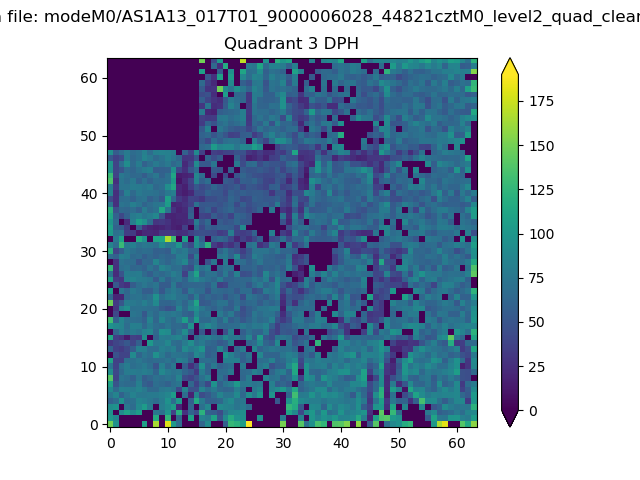 |
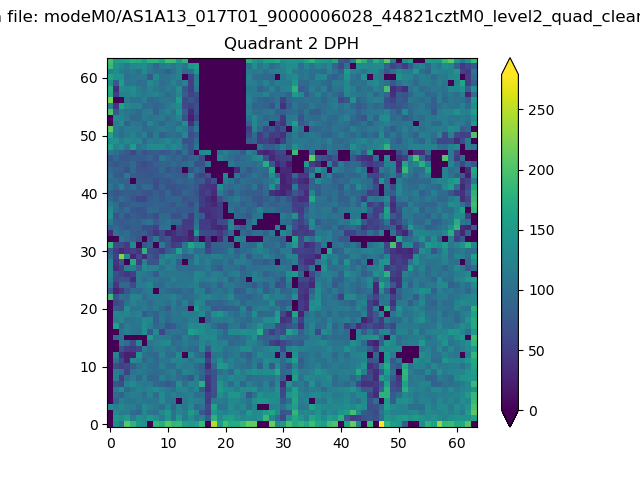 |
Quadrant C |
| Plot type | Count rate plots | Images |
|---|---|---|
| Comparison with Poisson distribution Blue bars denote a histogram of data divided into 1 sec bins. Red curve is a Poisson curve with rate = median count rate of data. |
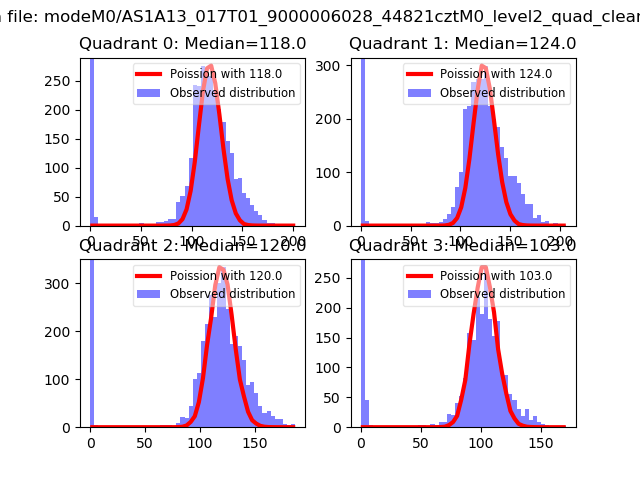 |
 |
| Quadrant-wise count rates Data is divided into 100 sec bins |
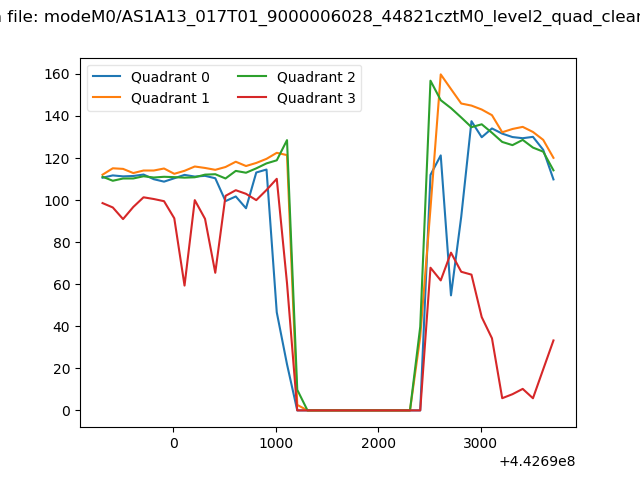 |
|
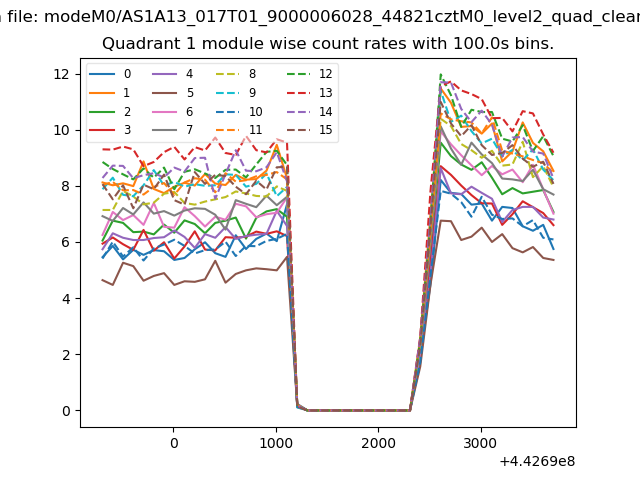
| Module-wise count rates for Quadrant A Data is divided into 100 sec bins |
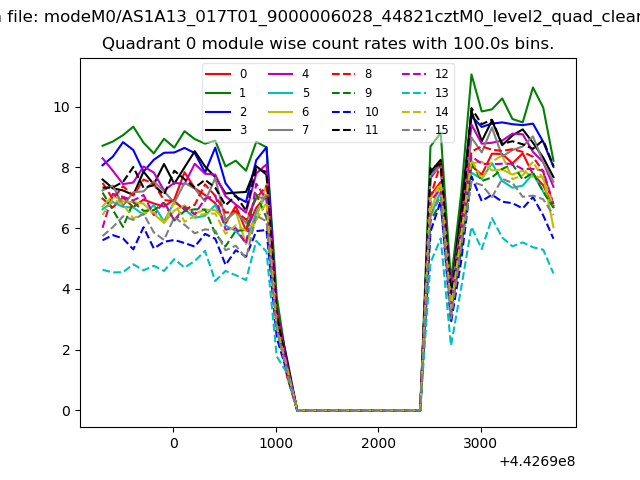 |
 |
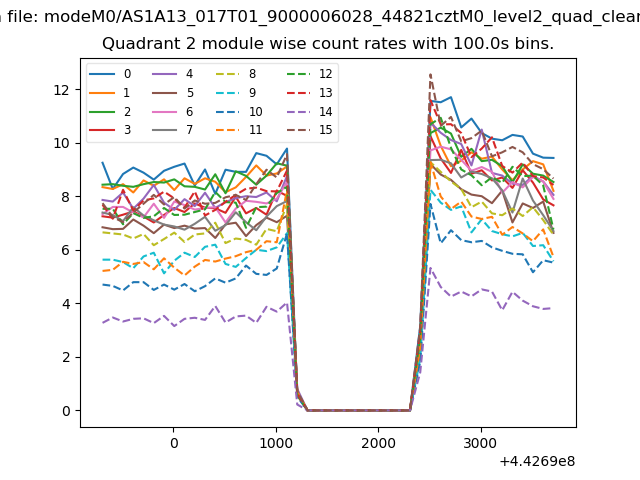
| Module-wise count rates for Quadrant B Data is divided into 100 sec bins |
 |
 |
| Module-wise count rates for Quadrant C Data is divided into 100 sec bins |
 |
 |
| Module-wise count rates for Quadrant D Data is divided into 100 sec bins |
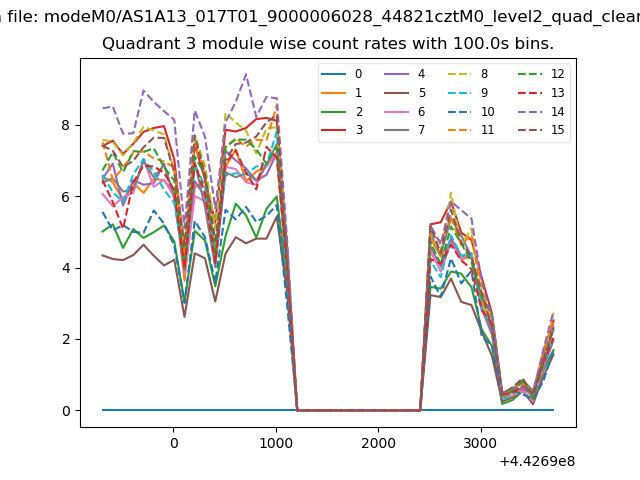 |
 |
| Parameter | Plot |
|---|---|
| CZT HV Monitor | 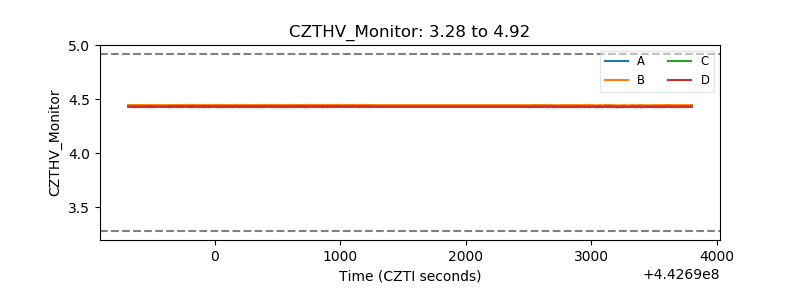 |
| D_VDD | 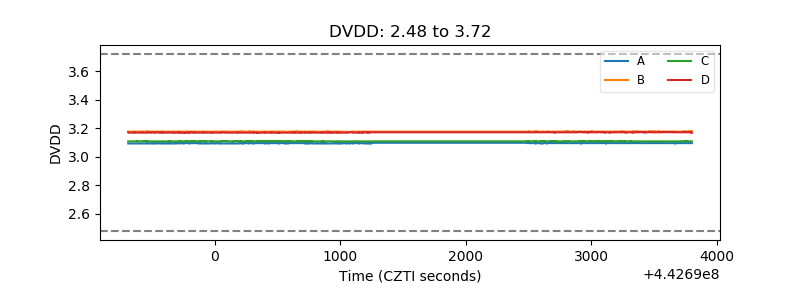 |
| Temperature 1 | 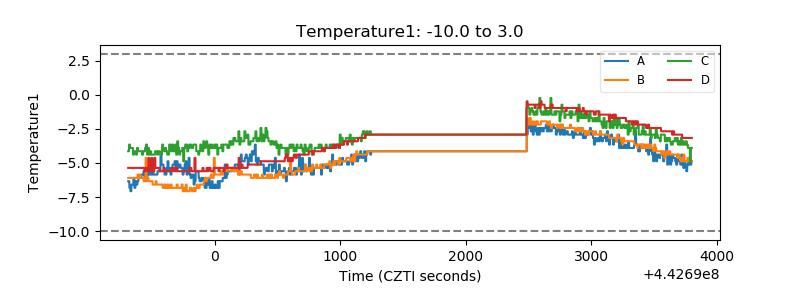 |
| Veto HV Monitor | 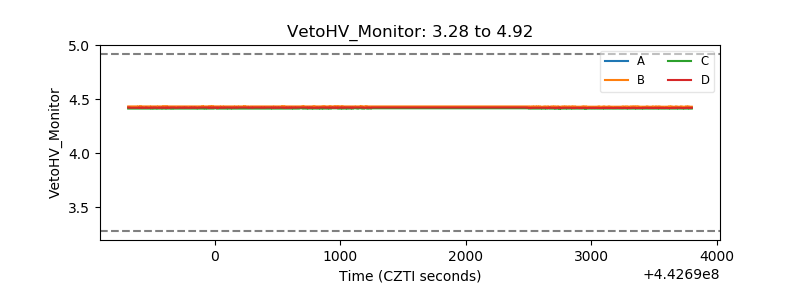 |
| Veto LLD | 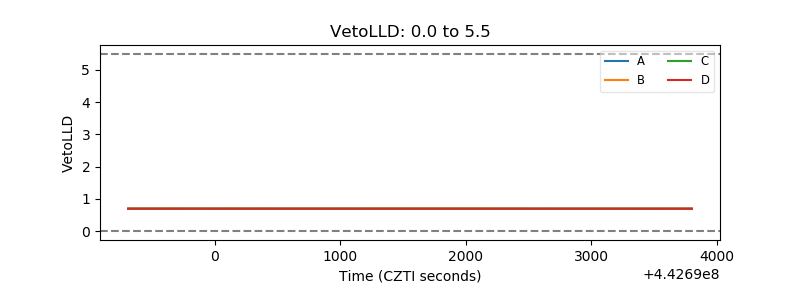 |
| Alpha Counter | 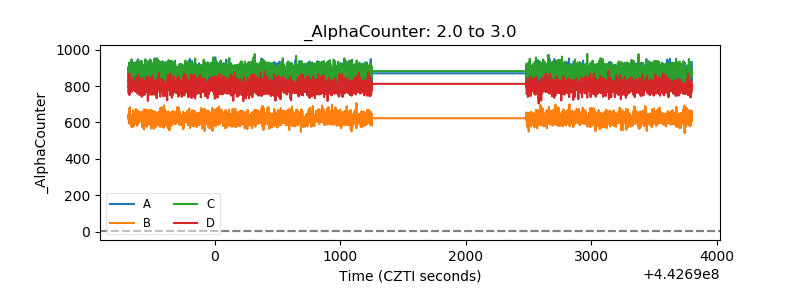 |
| _CPM_Rate | 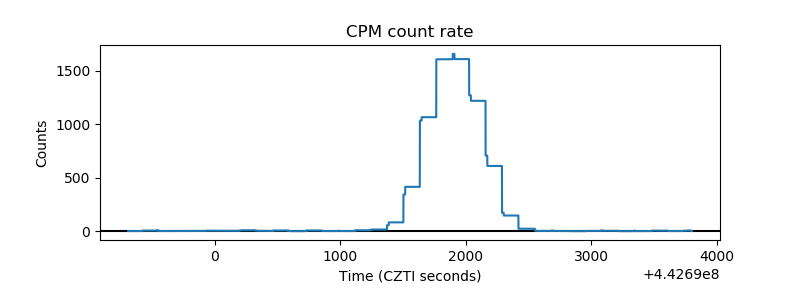 |
| CZT Counter | 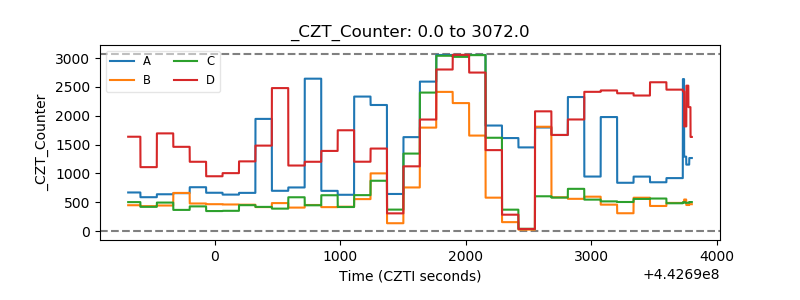 |
| +2.5 Volts monitor | 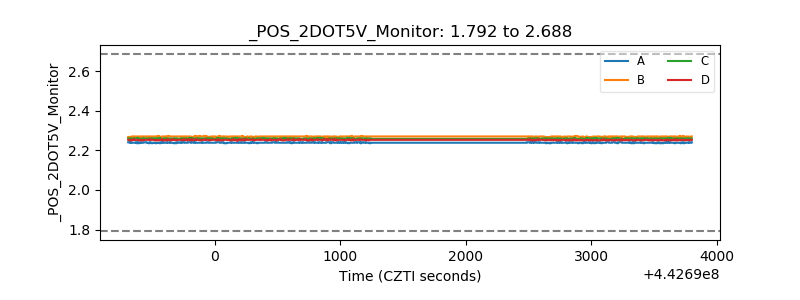 |
| +5 Volts monitor | 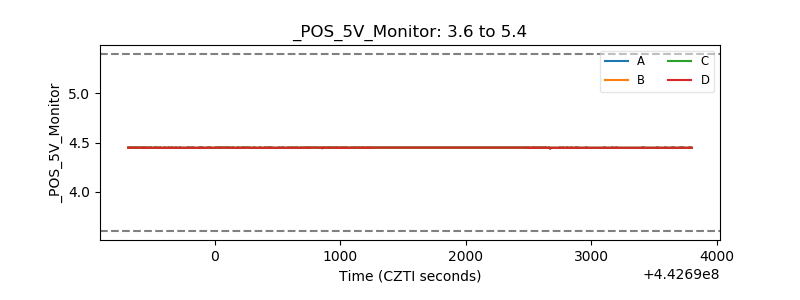 |
| _ROLL_ROT | 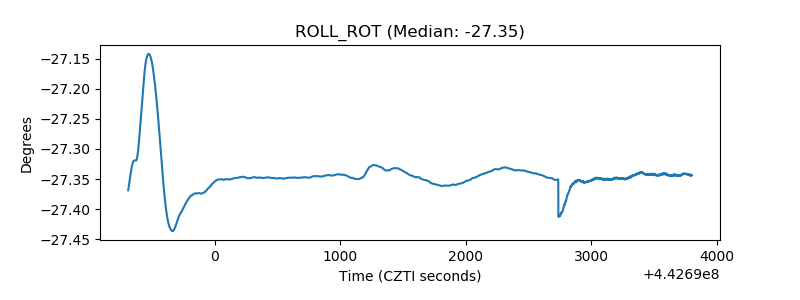 |
| _Roll_DEC | 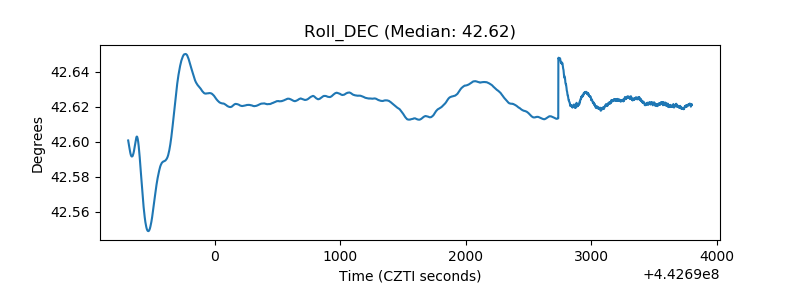 |
| _Roll_RA | 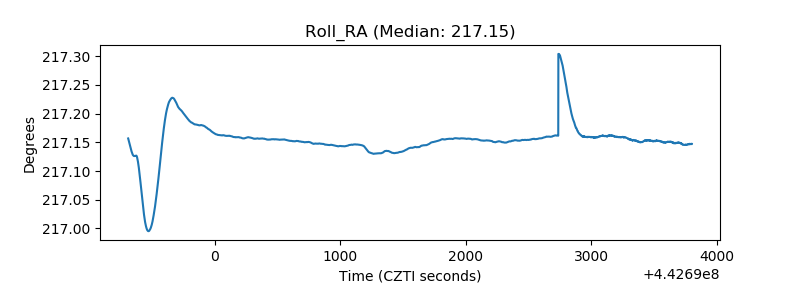 |
| Veto Counter | 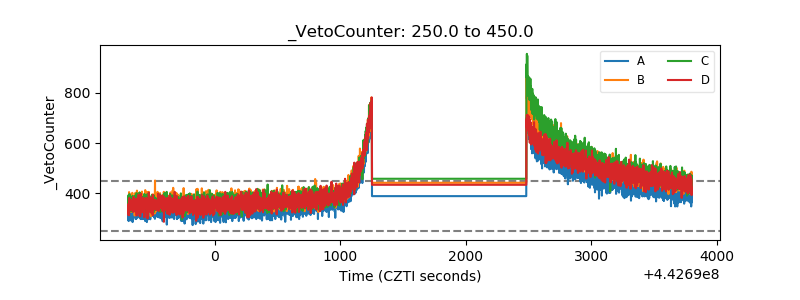 |