| Param | Original file | Final file |
|---|---|---|
| Filename | modeM0/AS1A13_017T01_9000006028_44822cztM0_level2.fits | modeM0/AS1A13_017T01_9000006028_44822cztM0_level2_quad_clean.evt |
| Size (bytes) | 686,108,160 | 101,450,880 |
| Size | 654.3 MB | 96.8 MB |
| Events in quadrant A | 6,050,268 | 711,171 |
| Events in quadrant B | 3,503,111 | 778,973 |
| Events in quadrant C | 3,283,792 | 753,705 |
| Events in quadrant D | 12,073,657 | 389,568 |
| Mode M0 | |||
|---|---|---|---|
| Quadrant | BADHDUFLAG | Total packets | Discarded packets |
| A | 0 | 22952 | 2 |
| B | 0 | 14520 | 2 |
| C | 0 | 13982 | 3 |
| D | 0 | 40178 | 2 |
| Mode SS | |||
|---|---|---|---|
| Quadrant | BADHDUFLAG | Total packets | Discarded packets |
| A | 0 | 128 | 0 |
| B | 0 | 128 | 0 |
| C | 0 | 128 | 0 |
| D | 0 | 128 | 0 |
| Mode M9 | |||
|---|---|---|---|
| Quadrant | BADHDUFLAG | Total packets | Discarded packets |
| A | 0 | 18 | 0 |
| B | 0 | 18 | 0 |
| C | 0 | 19 | 0 |
| D | 0 | 19 | 0 |
| Quadrant | Total seconds | Saturated seconds | Saturation percentage |
|---|---|---|---|
| A | 6281 | 571 | 9.090909% |
| B | 6281 | 194 | 3.088680% |
| C | 6280 | 124 | 1.974522% |
| D | 6280 | 3208 | 51.082803% |
Noise dominated data is calculated using 1-second bins in cleaned event files. If a bin has >2000 counts, and if more than 50% of those come from <1% of pixels, then it is considered to be noise-dominated and hence unusable.
| Quadrant | # 1 sec bins | Bins with >0 counts | Bins with >2000 counts | High rate bins dominated by noise | Noise dominated (total time) | Noise dominated (detector-on time) | Marked lightcurve |
|---|---|---|---|---|---|---|---|
| A | 7516 | 6282 | 284 | 284 | 3.78% | 4.52% | 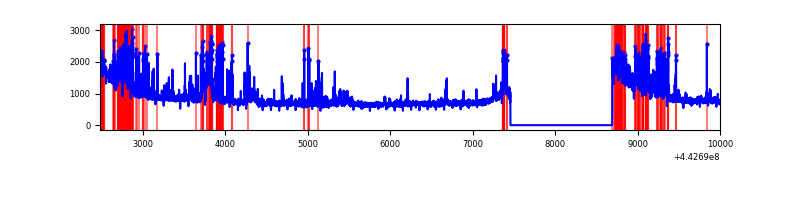 |
| B | 7516 | 6281 | 70 | 70 | 0.93% | 1.11% | 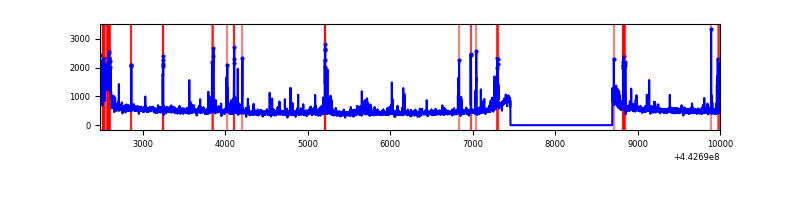 |
| C | 7515 | 6281 | 57 | 57 | 0.76% | 0.91% | 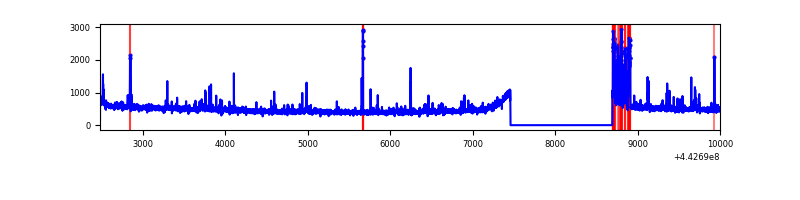 |
| D | 7515 | 6280 | 3362 | 3362 | 44.74% | 53.54% | 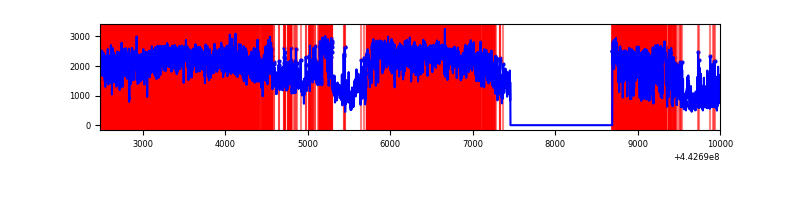 |
Top three noisy pixels from each quadrant. If the there are fewer than three noisy pixels in the level2.evt file, extra rows are filled as -1
| Pixel properties | Quadrant properties | ||||||
|---|---|---|---|---|---|---|---|
| Quadrant | DetID | PixID | Counts | Sigma | Mean | Median | Sigma |
| A | 10 | 83 | 2080732 | 13628.86 | 735 | 722 | 152.6 |
| A | 15 | 223 | 953099 | 6240.27 | 735 | 722 | 152.6 |
| A | 7 | 3 | 159785 | 1042.23 | 735 | 722 | 152.6 |
| B | 15 | 36 | 128967 | 873.17 | 755 | 731 | 146.9 |
| B | 7 | 221 | 109526 | 740.8 | 755 | 731 | 146.9 |
| B | 5 | 255 | 79564 | 536.78 | 755 | 731 | 146.9 |
| C | 2 | 14 | 182217 | 1041.66 | 751 | 758 | 174.2 |
| C | 12 | 2 | 81868 | 465.61 | 751 | 758 | 174.2 |
| C | 1 | 3 | 41204 | 232.18 | 751 | 758 | 174.2 |
| D | 13 | 187 | 5058336 | 31381.71 | 637 | 617 | 161.2 |
| D | 1 | 52 | 3129378 | 19413.07 | 637 | 617 | 161.2 |
| D | 13 | 174 | 612815 | 3798.51 | 637 | 617 | 161.2 |
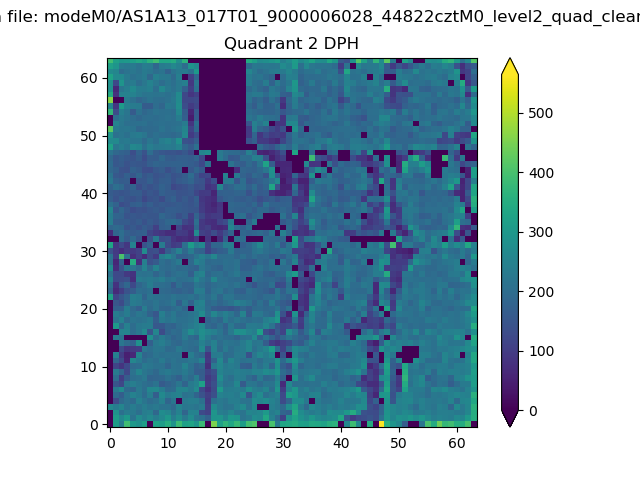
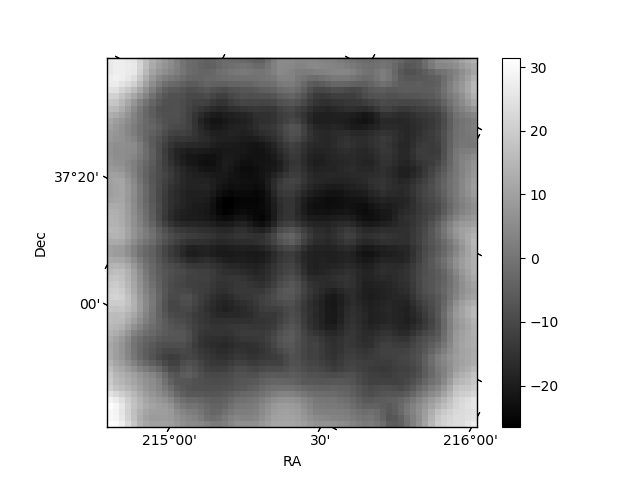
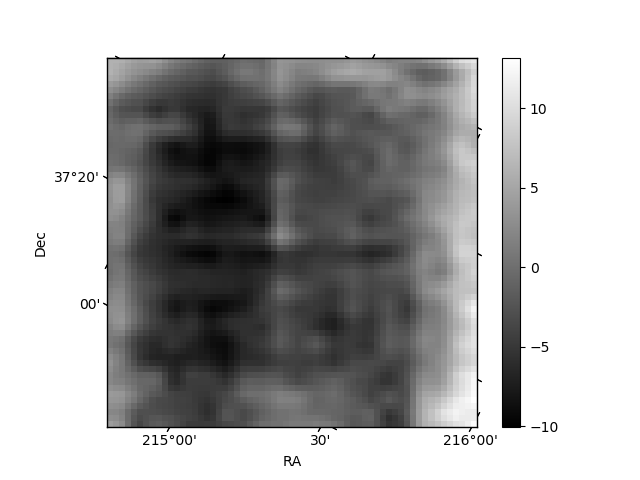
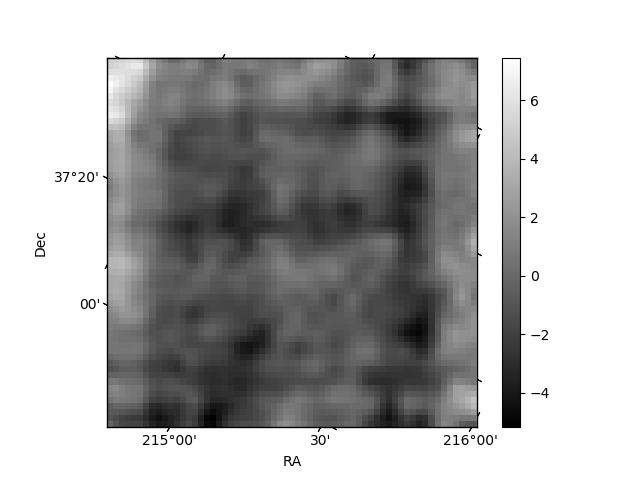
Histogram calculated using DETX and DETY for each event in the final _common_clean file
| Quadrant A | 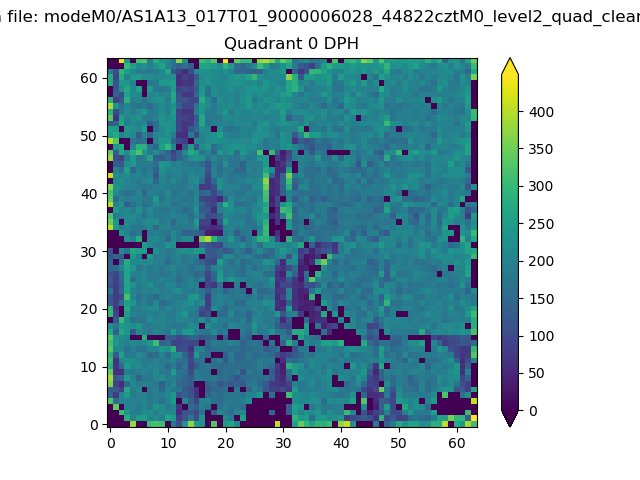 |
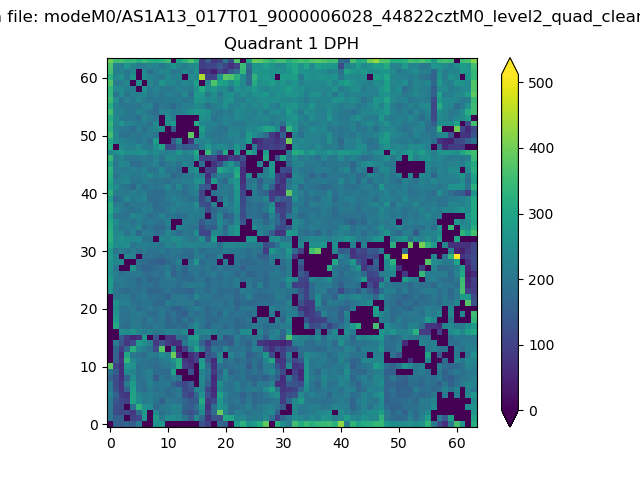 |
Quadrant B |
|---|---|---|---|
| Quadrant D | 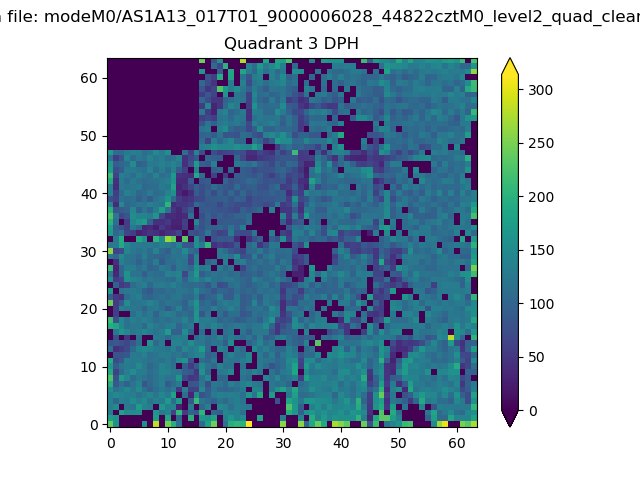 |
 |
Quadrant C |
| Plot type | Count rate plots | Images |
|---|---|---|
| Comparison with Poisson distribution Blue bars denote a histogram of data divided into 1 sec bins. Red curve is a Poisson curve with rate = median count rate of data. |
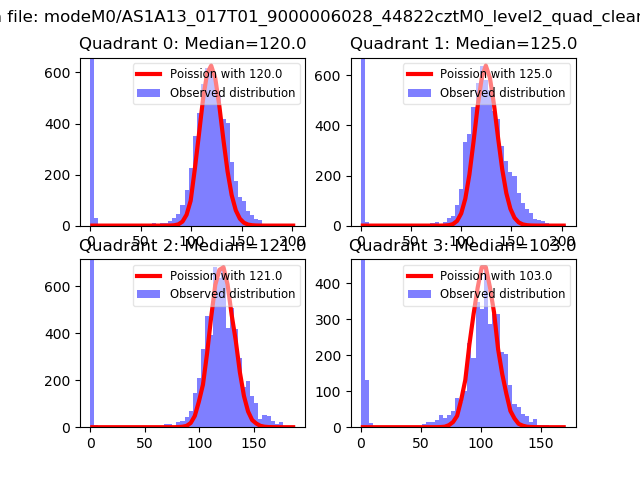 |
 |
| Quadrant-wise count rates Data is divided into 100 sec bins |
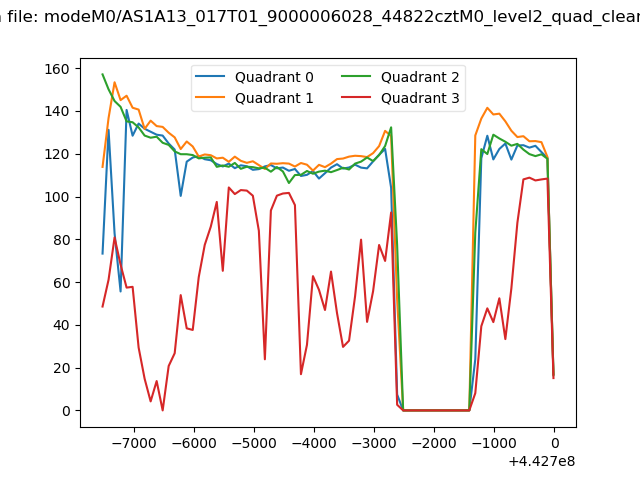 |
|
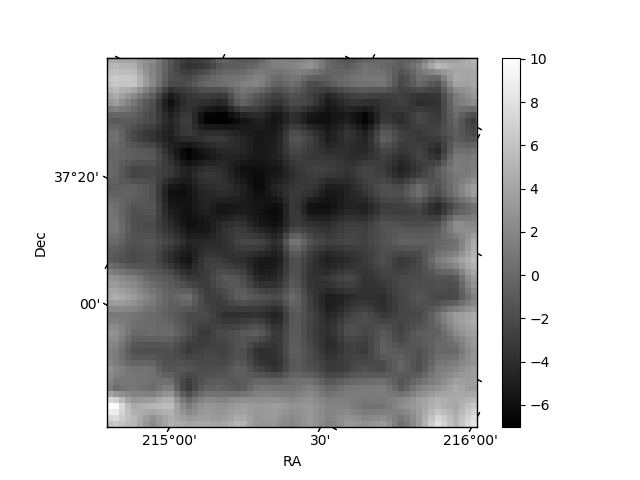
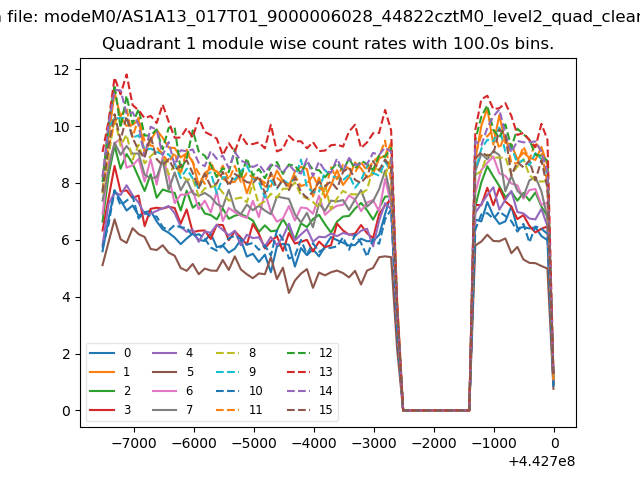
| Module-wise count rates for Quadrant A Data is divided into 100 sec bins |
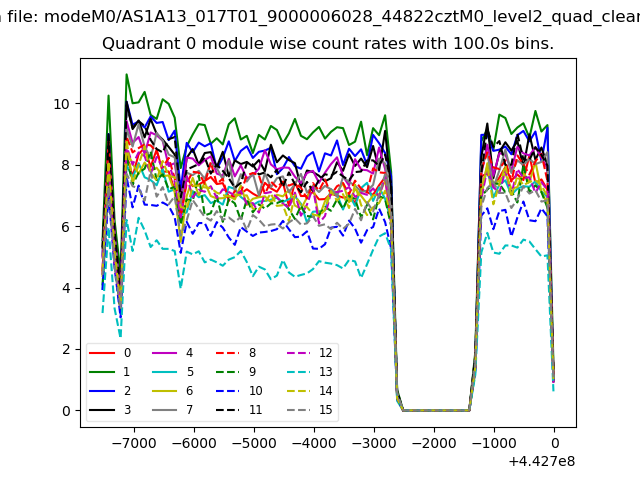 |
 |
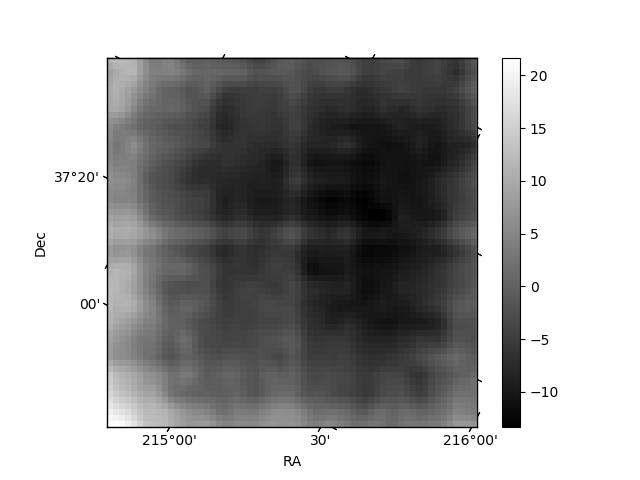
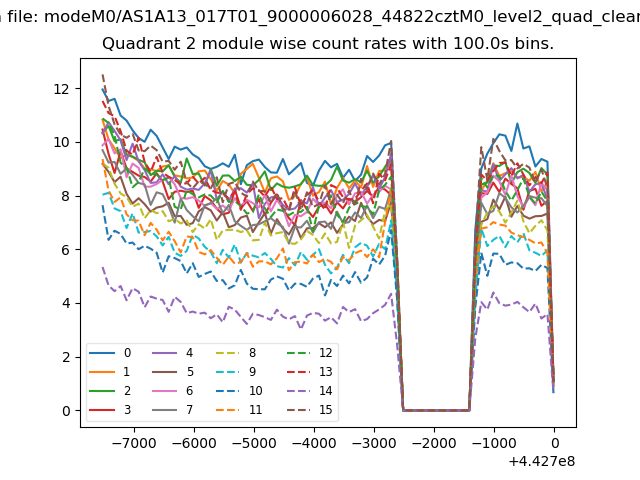
| Module-wise count rates for Quadrant B Data is divided into 100 sec bins |
 |
 |
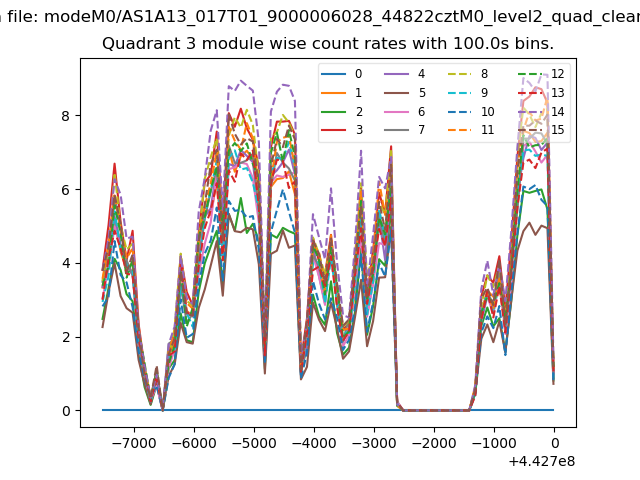
| Module-wise count rates for Quadrant C Data is divided into 100 sec bins |
 |
 |
| Module-wise count rates for Quadrant D Data is divided into 100 sec bins |
 |
 |
| Parameter | Plot |
|---|---|
| CZT HV Monitor |  |
| D_VDD | 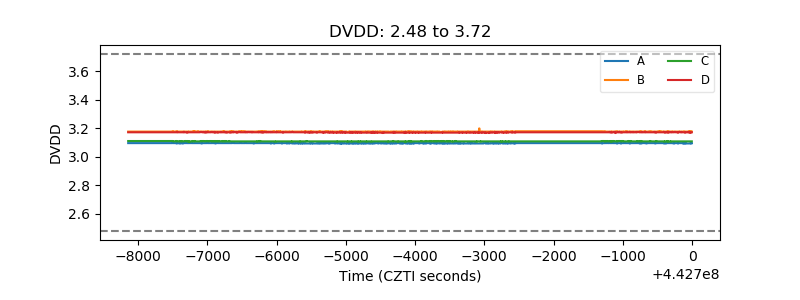 |
| Temperature 1 | 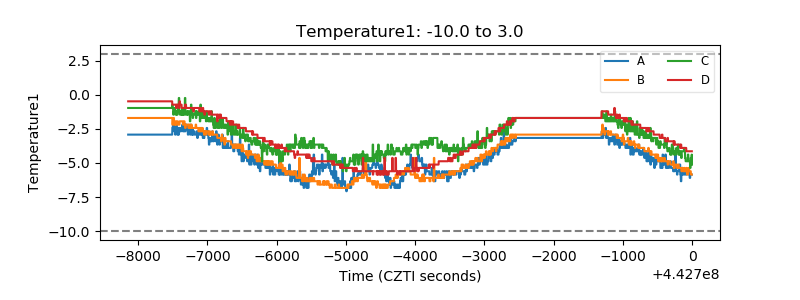 |
| Veto HV Monitor | 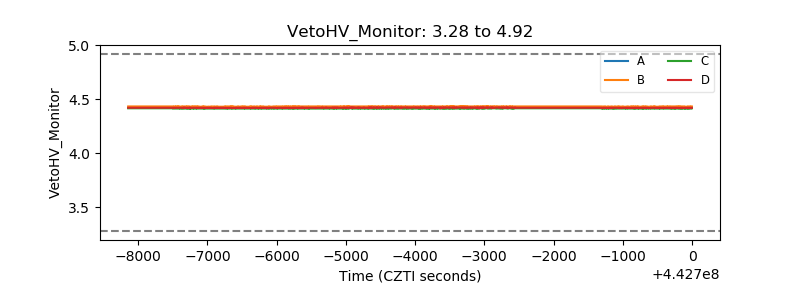 |
| Veto LLD | 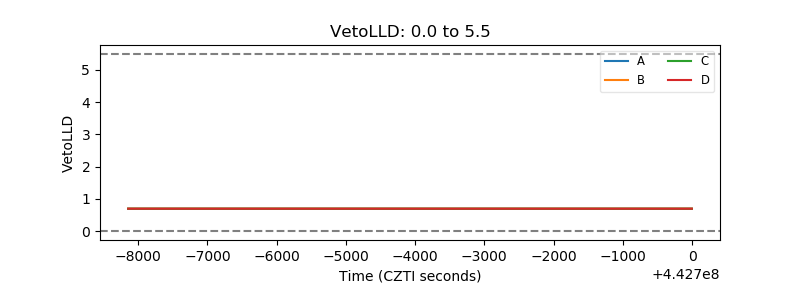 |
| Alpha Counter | 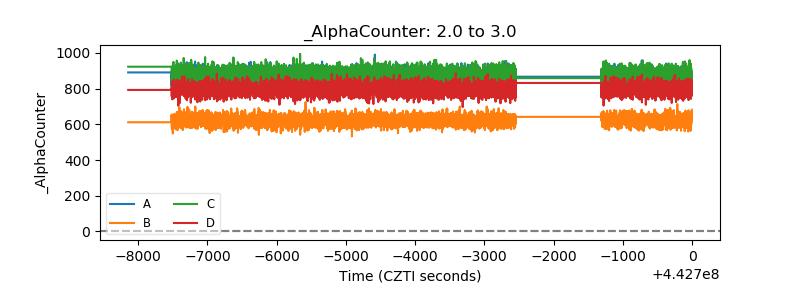 |
| _CPM_Rate | 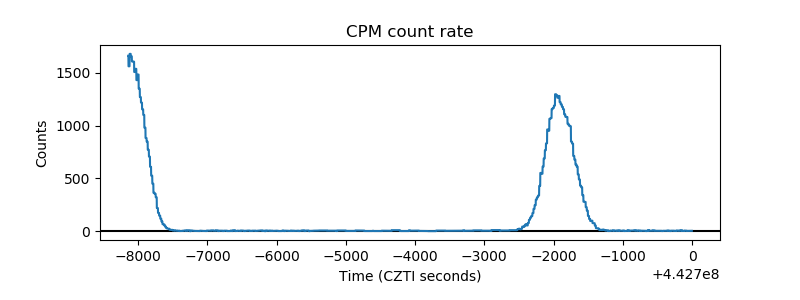 |
| CZT Counter | 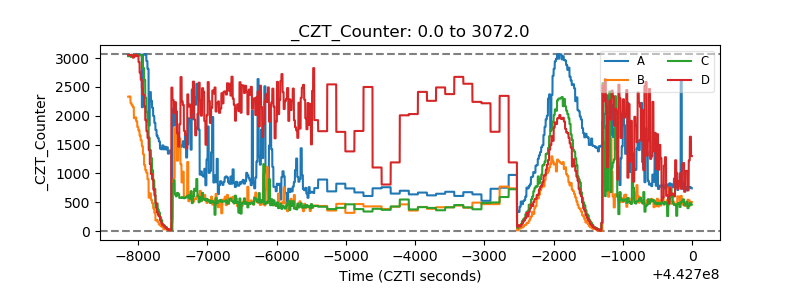 |
| +2.5 Volts monitor | 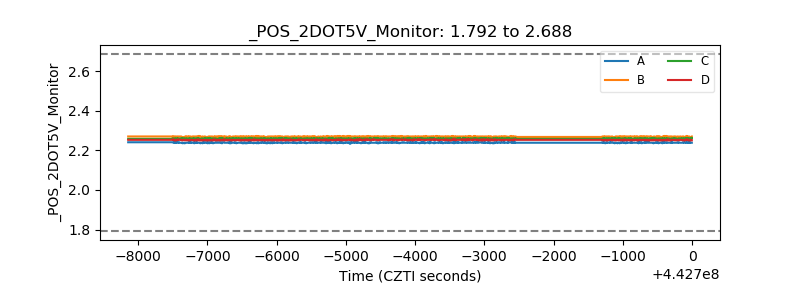 |
| +5 Volts monitor | 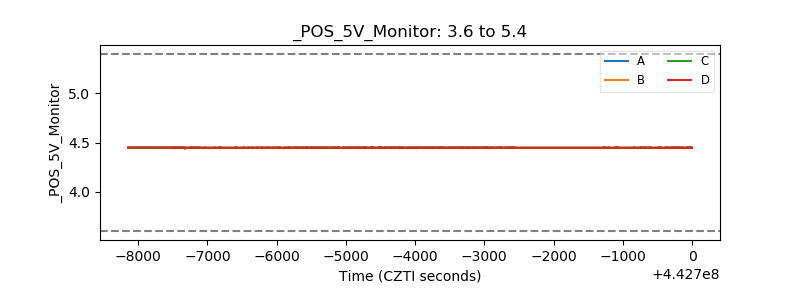 |
| _ROLL_ROT | 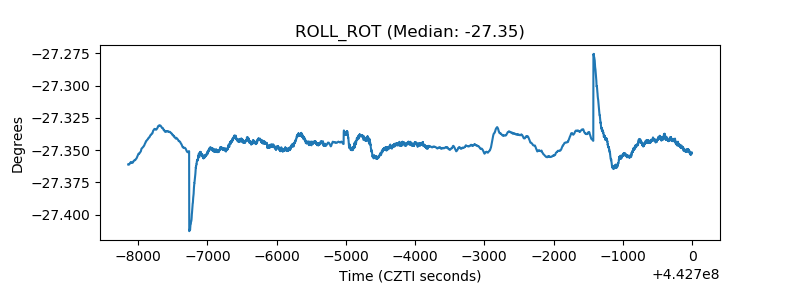 |
| _Roll_DEC | 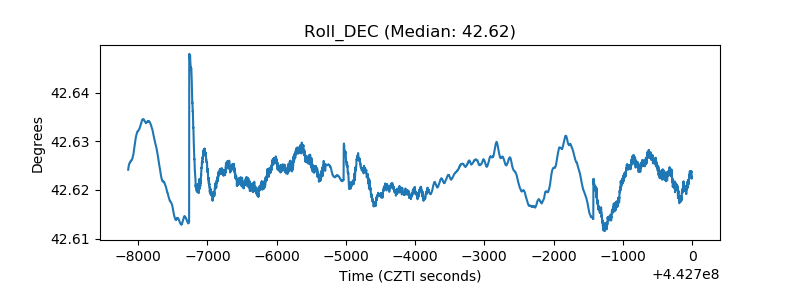 |
| _Roll_RA | 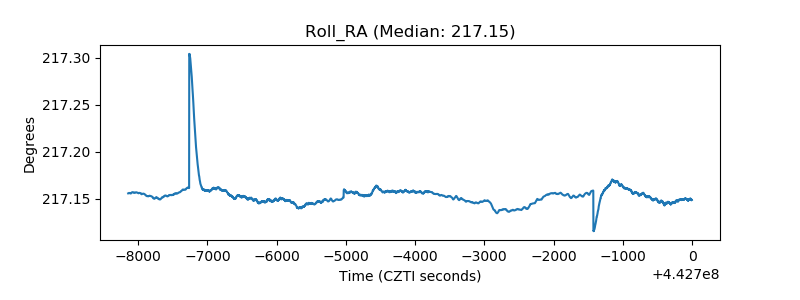 |
| Veto Counter |  |