| Param | Original file | Final file |
|---|---|---|
| Filename | modeM0/AS1A13_017T01_9000006028_44823cztM0_level2.fits | modeM0/AS1A13_017T01_9000006028_44823cztM0_level2_quad_clean.evt |
| Size (bytes) | 647,127,360 | 104,379,840 |
| Size | 617.1 MB | 99.5 MB |
| Events in quadrant A | 7,682,661 | 633,590 |
| Events in quadrant B | 3,814,043 | 747,282 |
| Events in quadrant C | 3,299,718 | 741,992 |
| Events in quadrant D | 8,654,490 | 583,365 |
| Mode M0 | |||
|---|---|---|---|
| Quadrant | BADHDUFLAG | Total packets | Discarded packets |
| A | 0 | 27716 | 2 |
| B | 0 | 15776 | 2 |
| C | 0 | 14385 | 2 |
| D | 0 | 30333 | 2 |
| Mode SS | |||
|---|---|---|---|
| Quadrant | BADHDUFLAG | Total packets | Discarded packets |
| A | 0 | 136 | 0 |
| B | 0 | 136 | 0 |
| C | 0 | 136 | 0 |
| D | 0 | 136 | 0 |
| Mode M9 | |||
|---|---|---|---|
| Quadrant | BADHDUFLAG | Total packets | Discarded packets |
| A | 0 | 22 | 0 |
| B | 0 | 23 | 0 |
| C | 0 | 23 | 0 |
| D | 0 | 23 | 0 |
| Quadrant | Total seconds | Saturated seconds | Saturation percentage |
|---|---|---|---|
| A | 6506 | 1202 | 18.475254% |
| B | 6506 | 365 | 5.610206% |
| C | 6506 | 144 | 2.213342% |
| D | 6506 | 1212 | 18.628958% |
Noise dominated data is calculated using 1-second bins in cleaned event files. If a bin has >2000 counts, and if more than 50% of those come from <1% of pixels, then it is considered to be noise-dominated and hence unusable.
| Quadrant | # 1 sec bins | Bins with >0 counts | Bins with >2000 counts | High rate bins dominated by noise | Noise dominated (total time) | Noise dominated (detector-on time) | Marked lightcurve |
|---|---|---|---|---|---|---|---|
| A | 7671 | 6507 | 890 | 890 | 11.60% | 13.68% |  |
| B | 7670 | 6505 | 209 | 209 | 2.72% | 3.21% | 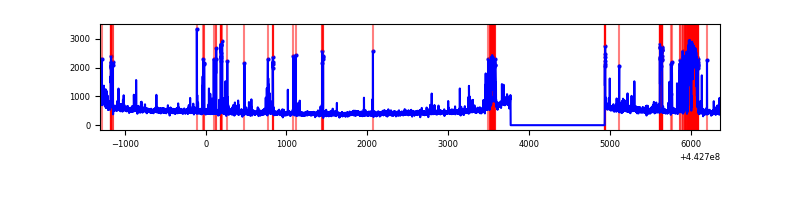 |
| C | 7671 | 6506 | 64 | 64 | 0.83% | 0.98% | 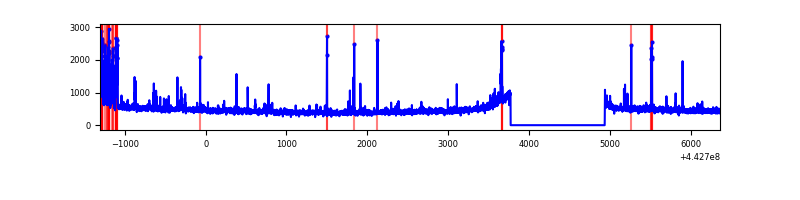 |
| D | 7670 | 6506 | 1325 | 1325 | 17.28% | 20.37% | 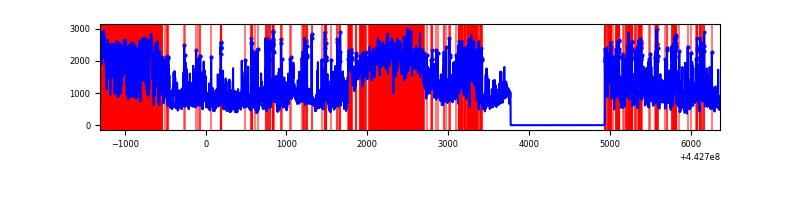 |
Top three noisy pixels from each quadrant. If the there are fewer than three noisy pixels in the level2.evt file, extra rows are filled as -1
| Pixel properties | Quadrant properties | ||||||
|---|---|---|---|---|---|---|---|
| Quadrant | DetID | PixID | Counts | Sigma | Mean | Median | Sigma |
| A | 15 | 223 | 2687930 | 18291.57 | 709 | 694 | 146.9 |
| A | 10 | 83 | 2070681 | 14090.06 | 709 | 694 | 146.9 |
| A | 7 | 3 | 132118 | 894.58 | 709 | 694 | 146.9 |
| B | 5 | 172 | 485628 | 3272.98 | 744 | 719 | 148.2 |
| B | 0 | 219 | 134245 | 901.26 | 744 | 719 | 148.2 |
| B | 5 | 255 | 107936 | 723.68 | 744 | 719 | 148.2 |
| C | 2 | 14 | 142701 | 806.12 | 749 | 754 | 176.1 |
| C | 12 | 2 | 129753 | 732.59 | 749 | 754 | 176.1 |
| C | 1 | 3 | 28867 | 159.65 | 749 | 754 | 176.1 |
| D | 1 | 52 | 2740761 | 15286.94 | 701 | 677 | 179.2 |
| D | 13 | 187 | 2128682 | 11872.15 | 701 | 677 | 179.2 |
| D | 13 | 171 | 271905 | 1513.18 | 701 | 677 | 179.2 |
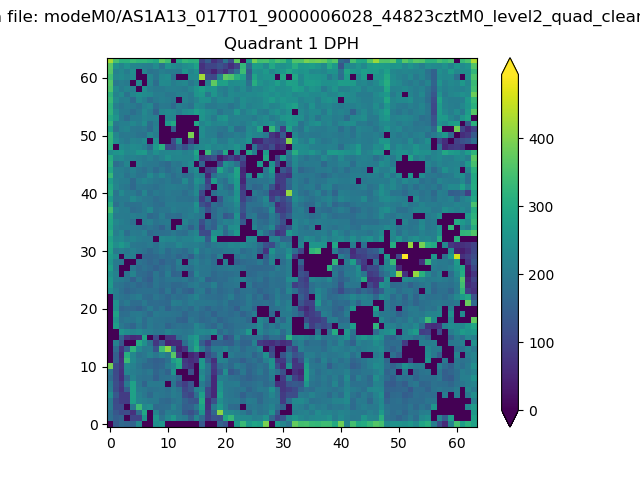
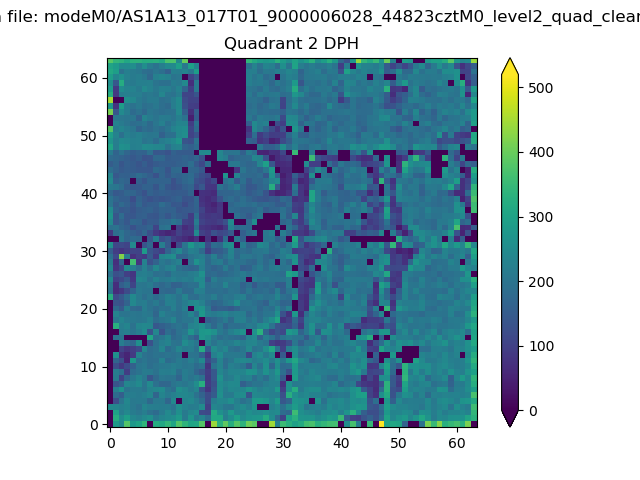
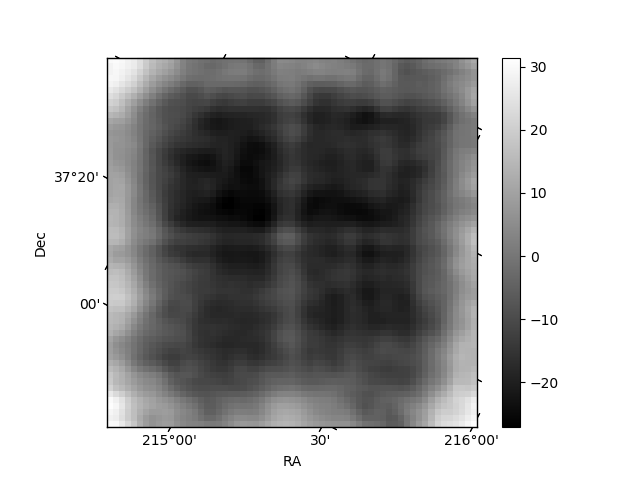
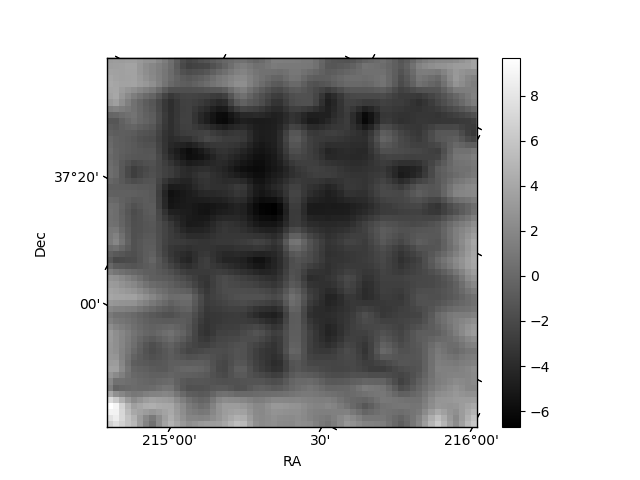
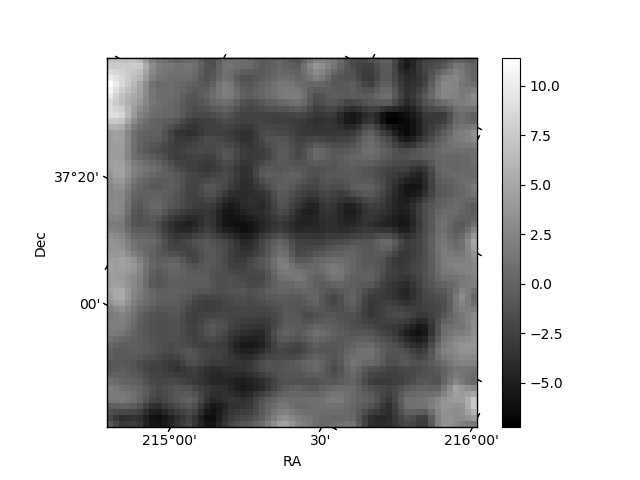
Histogram calculated using DETX and DETY for each event in the final _common_clean file
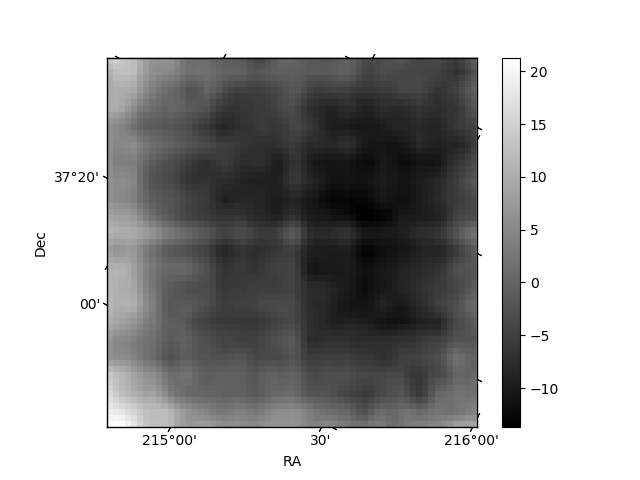
| Quadrant A | 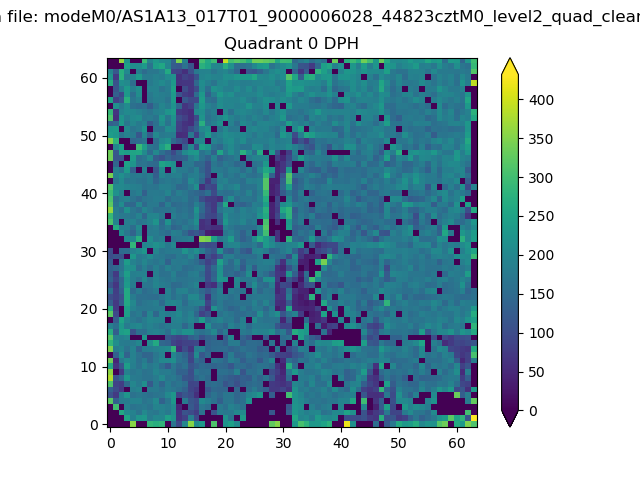 |
 |
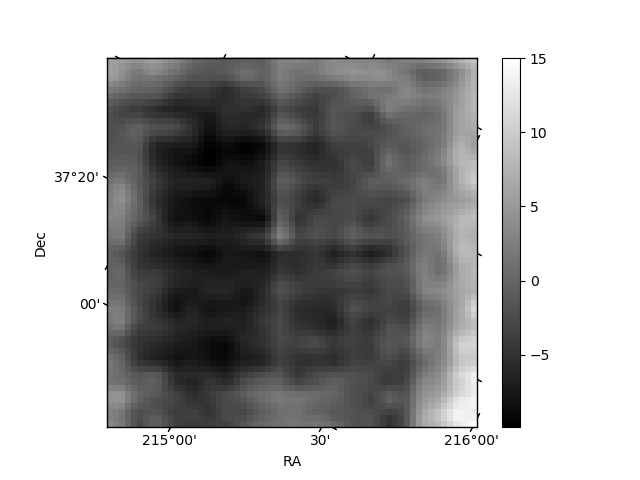
Quadrant B |
|---|---|---|---|
| Quadrant D | 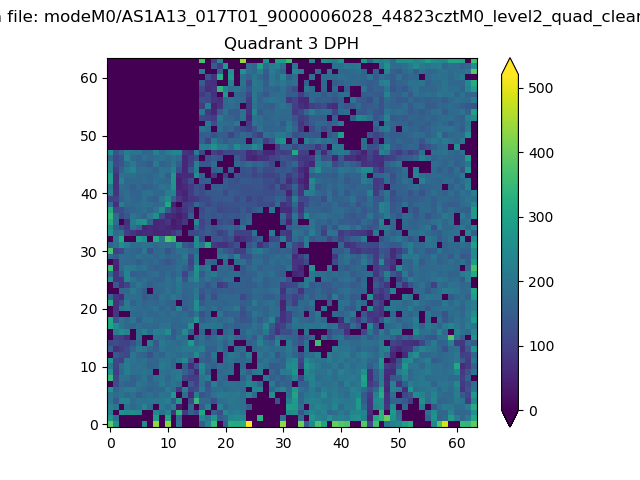 |
 |
Quadrant C |
| Plot type | Count rate plots | Images |
|---|---|---|
| Comparison with Poisson distribution Blue bars denote a histogram of data divided into 1 sec bins. Red curve is a Poisson curve with rate = median count rate of data. |
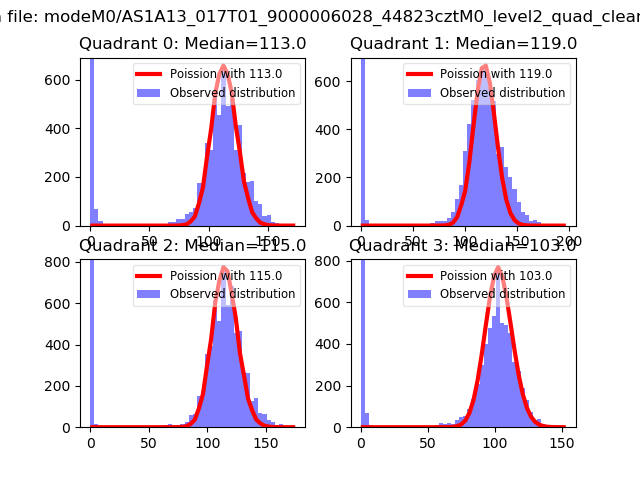 |
 |
| Quadrant-wise count rates Data is divided into 100 sec bins |
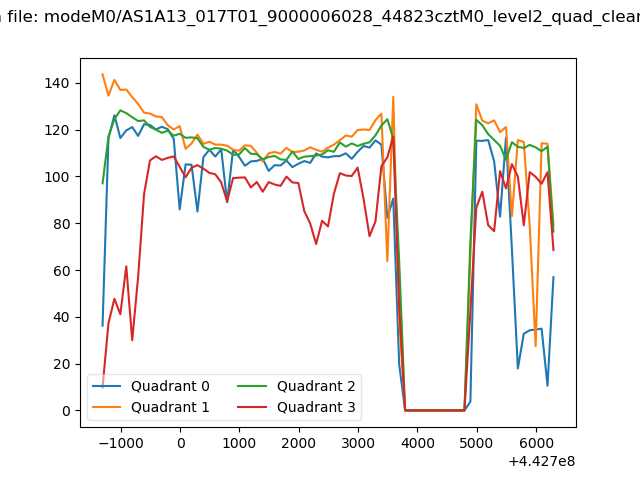 |
|
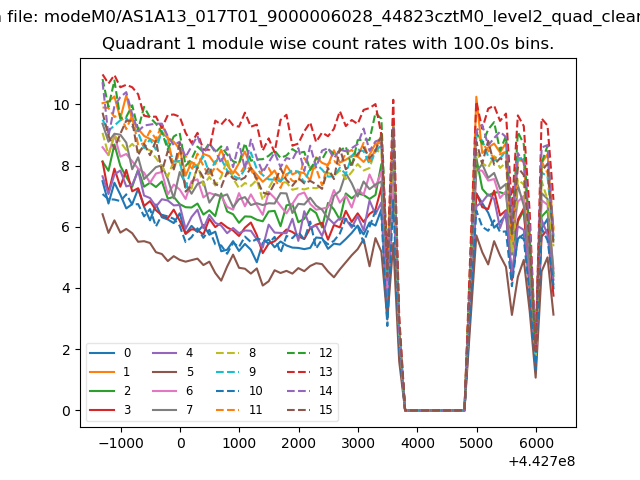
| Module-wise count rates for Quadrant A Data is divided into 100 sec bins |
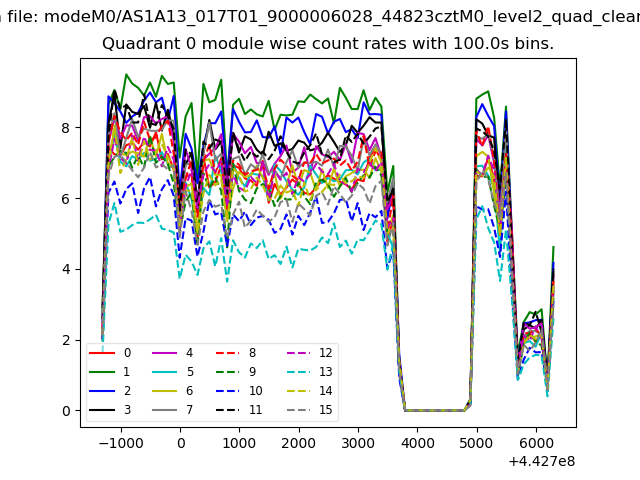 |
 |
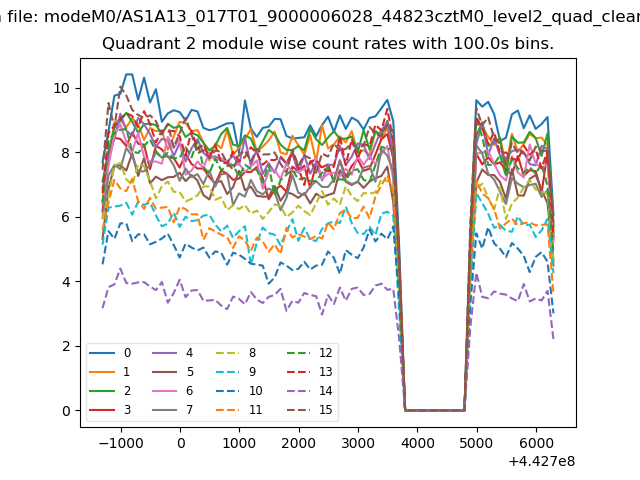
| Module-wise count rates for Quadrant B Data is divided into 100 sec bins |
 |
 |
| Module-wise count rates for Quadrant C Data is divided into 100 sec bins |
 |
 |
| Module-wise count rates for Quadrant D Data is divided into 100 sec bins |
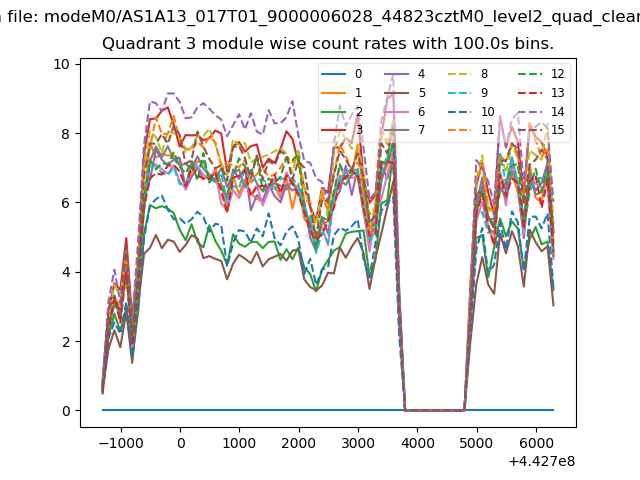 |
 |
| Parameter | Plot |
|---|---|
| CZT HV Monitor | 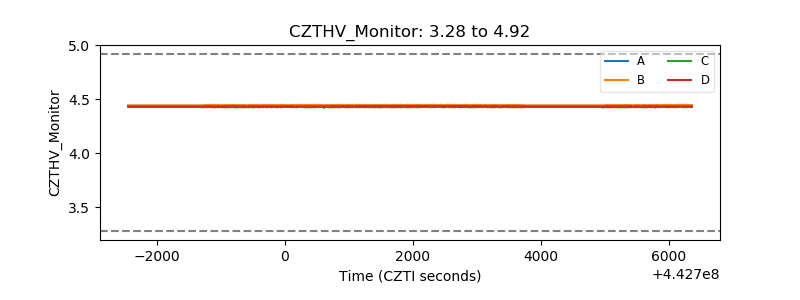 |
| D_VDD | 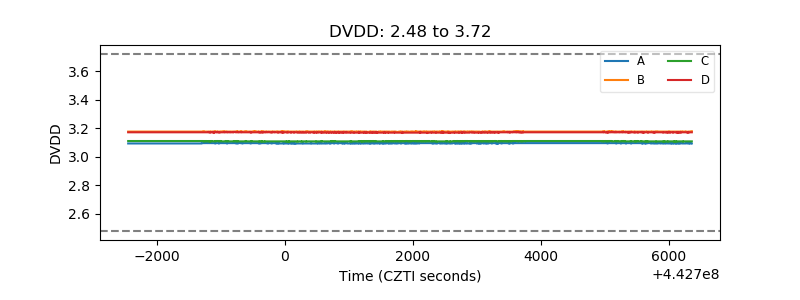 |
| Temperature 1 | 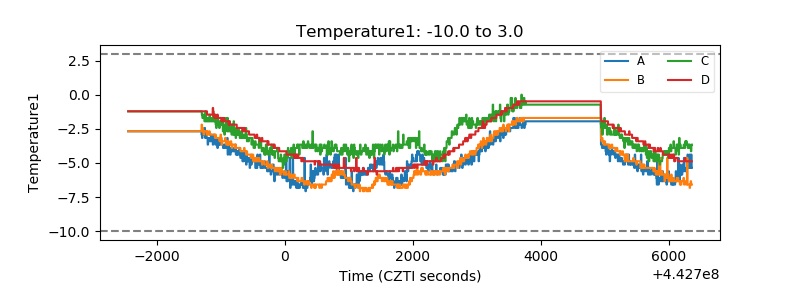 |
| Veto HV Monitor |  |
| Veto LLD | 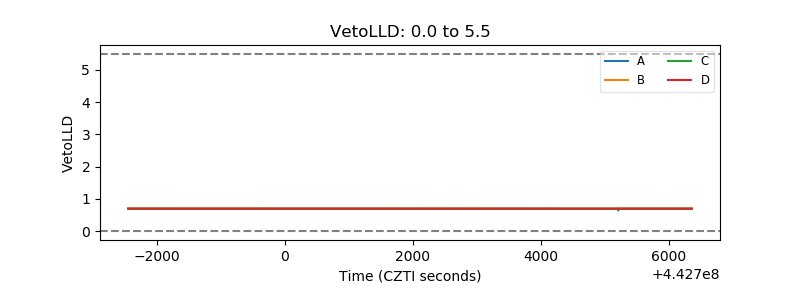 |
| Alpha Counter | 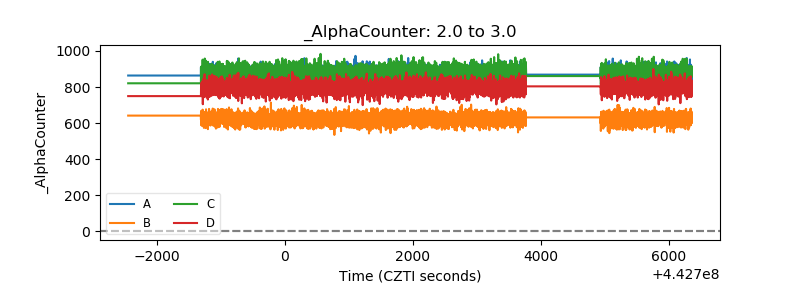 |
| _CPM_Rate | 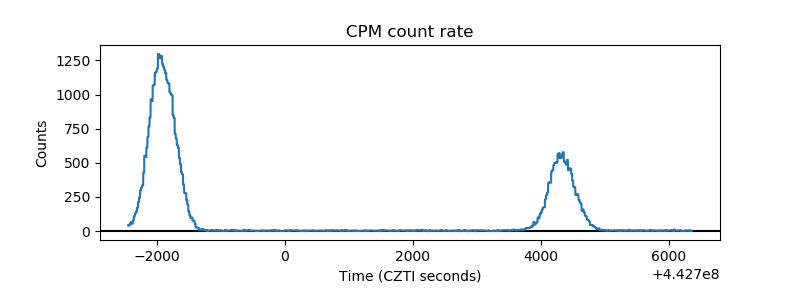 |
| CZT Counter | 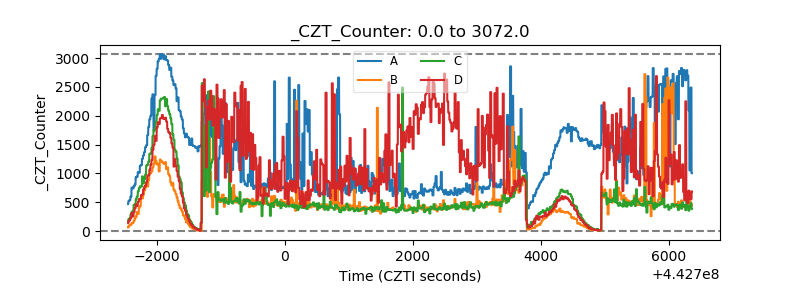 |
| +2.5 Volts monitor | 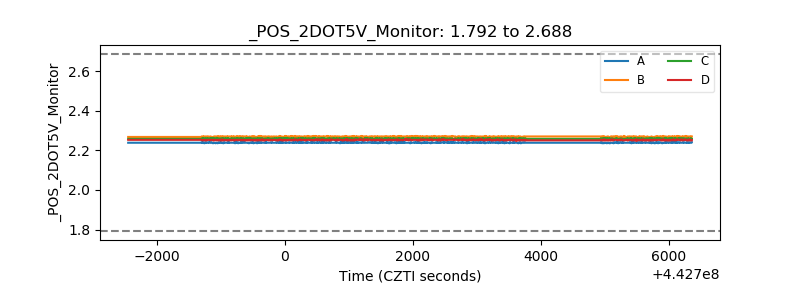 |
| +5 Volts monitor | 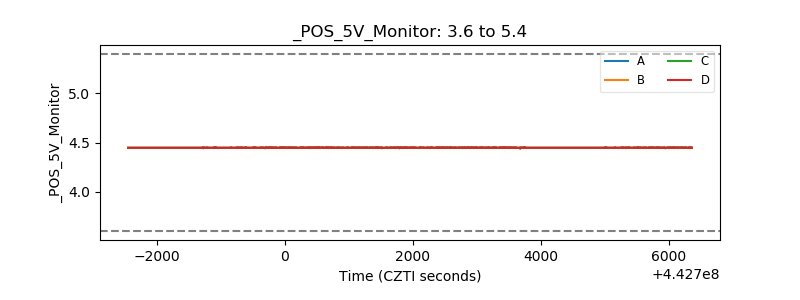 |
| _ROLL_ROT | 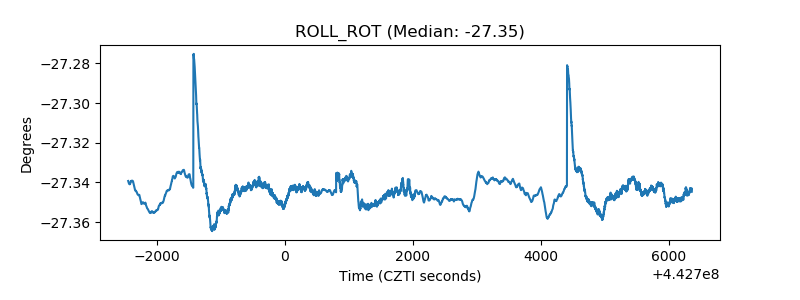 |
| _Roll_DEC | 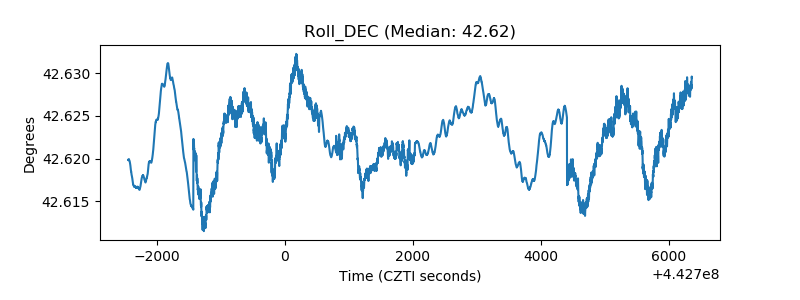 |
| _Roll_RA | 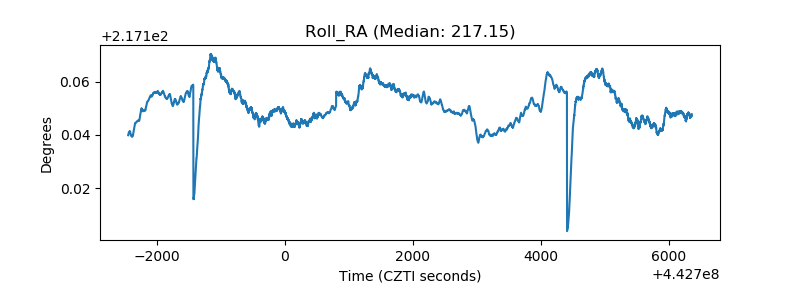 |
| Veto Counter | 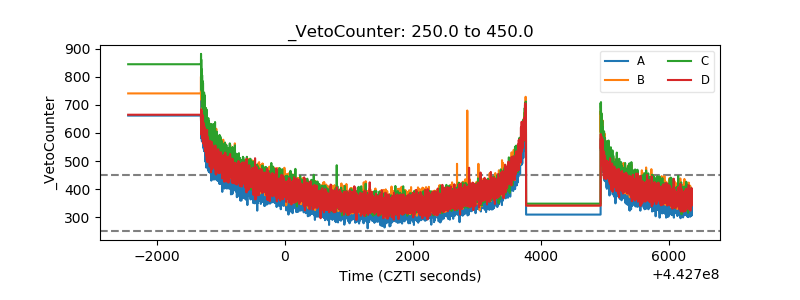 |