| Param | Original file | Final file |
|---|---|---|
| Filename | modeM0/AS1A13_017T01_9000006028_44824cztM0_level2.fits | modeM0/AS1A13_017T01_9000006028_44824cztM0_level2_quad_clean.evt |
| Size (bytes) | 743,155,200 | 90,432,000 |
| Size | 708.7 MB | 86.2 MB |
| Events in quadrant A | 12,348,998 | 350,134 |
| Events in quadrant B | 3,814,628 | 696,589 |
| Events in quadrant C | 3,338,518 | 683,280 |
| Events in quadrant D | 7,513,463 | 563,215 |
| Mode M0 | |||
|---|---|---|---|
| Quadrant | BADHDUFLAG | Total packets | Discarded packets |
| A | 0 | 41064 | 8 |
| B | 0 | 15734 | 1 |
| C | 0 | 14569 | 1 |
| D | 0 | 26773 | 1 |
| Mode SS | |||
|---|---|---|---|
| Quadrant | BADHDUFLAG | Total packets | Discarded packets |
| A | 0 | 130 | 0 |
| B | 0 | 130 | 0 |
| C | 0 | 130 | 0 |
| D | 0 | 130 | 0 |
| Mode M9 | |||
|---|---|---|---|
| Quadrant | BADHDUFLAG | Total packets | Discarded packets |
| A | 0 | 9 | 0 |
| B | 0 | 9 | 0 |
| C | 0 | 9 | 0 |
| D | 0 | 9 | 0 |
| Quadrant | Total seconds | Saturated seconds | Saturation percentage |
|---|---|---|---|
| A | 6372 | 3564 | 55.932203% |
| B | 6374 | 344 | 5.396925% |
| C | 6374 | 160 | 2.510198% |
| D | 6374 | 924 | 14.496392% |
Noise dominated data is calculated using 1-second bins in cleaned event files. If a bin has >2000 counts, and if more than 50% of those come from <1% of pixels, then it is considered to be noise-dominated and hence unusable.
| Quadrant | # 1 sec bins | Bins with >0 counts | Bins with >2000 counts | High rate bins dominated by noise | Noise dominated (total time) | Noise dominated (detector-on time) | Marked lightcurve |
|---|---|---|---|---|---|---|---|
| A | 7308 | 6374 | 3311 | 3311 | 45.31% | 51.95% | 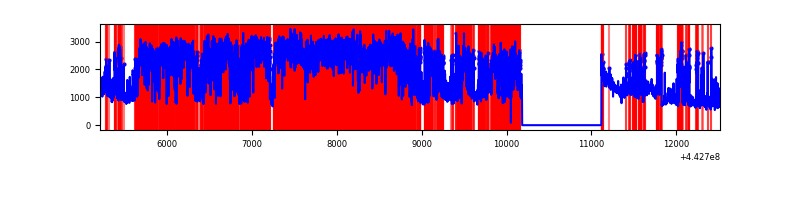 |
| B | 7309 | 6374 | 231 | 231 | 3.16% | 3.62% | 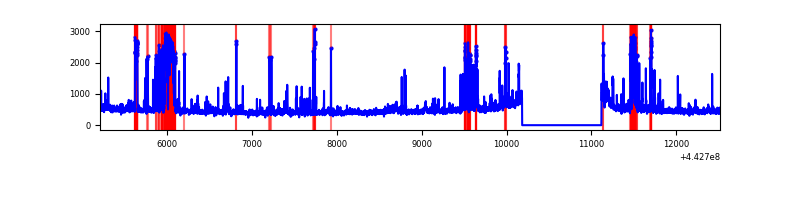 |
| C | 7309 | 6374 | 154 | 154 | 2.11% | 2.42% | 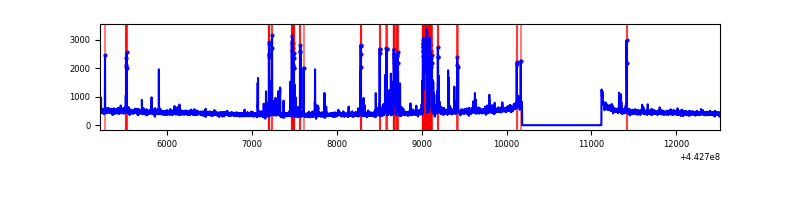 |
| D | 7309 | 6375 | 1020 | 1020 | 13.96% | 16.00% | 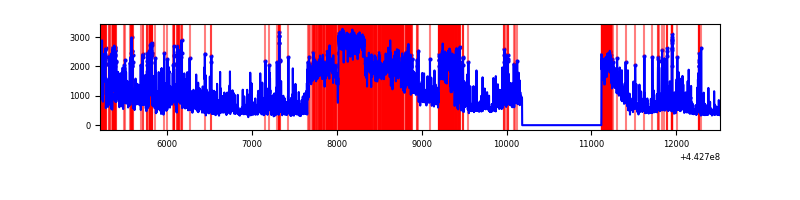 |
Top three noisy pixels from each quadrant. If the there are fewer than three noisy pixels in the level2.evt file, extra rows are filled as -1
| Pixel properties | Quadrant properties | ||||||
|---|---|---|---|---|---|---|---|
| Quadrant | DetID | PixID | Counts | Sigma | Mean | Median | Sigma |
| A | 15 | 223 | 8776960 | 80829.42 | 517 | 505 | 108.6 |
| A | 10 | 83 | 1510943 | 13910.84 | 517 | 505 | 108.6 |
| A | 13 | 248 | 43967 | 400.28 | 517 | 505 | 108.6 |
| B | 5 | 172 | 492303 | 3610.87 | 693 | 672 | 136.2 |
| B | 5 | 255 | 198377 | 1452.08 | 693 | 672 | 136.2 |
| B | 0 | 219 | 191303 | 1400.12 | 693 | 672 | 136.2 |
| C | 12 | 2 | 475050 | 2912.14 | 694 | 698 | 162.9 |
| C | 12 | 250 | 90789 | 553.09 | 694 | 698 | 162.9 |
| C | 14 | 254 | 42640 | 257.49 | 694 | 698 | 162.9 |
| D | 13 | 187 | 2747786 | 16517.91 | 653 | 630 | 166.3 |
| D | 1 | 52 | 1386724 | 8334.21 | 653 | 630 | 166.3 |
| D | 13 | 171 | 163726 | 980.65 | 653 | 630 | 166.3 |
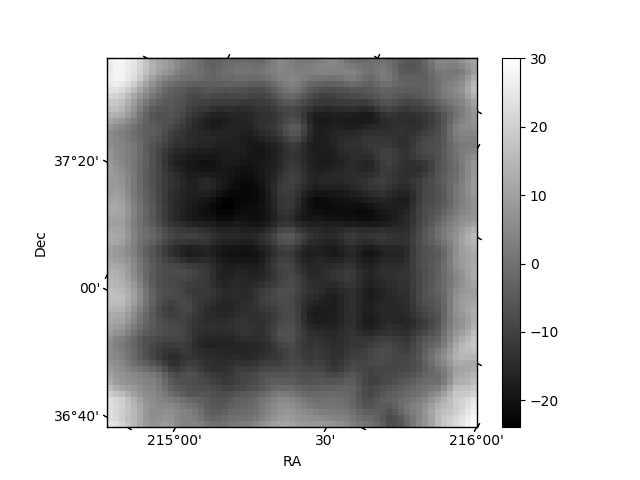
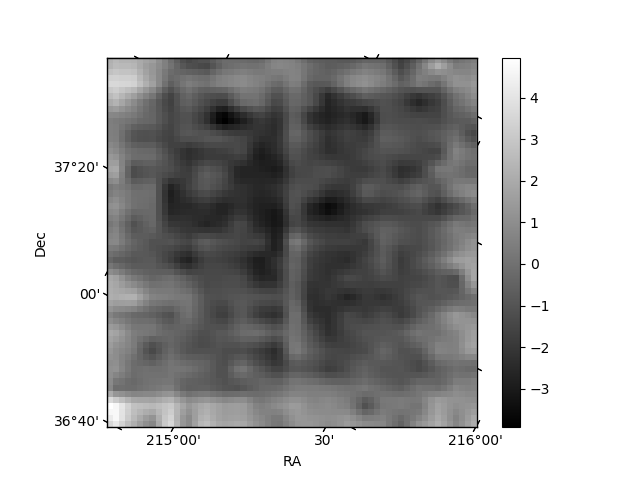
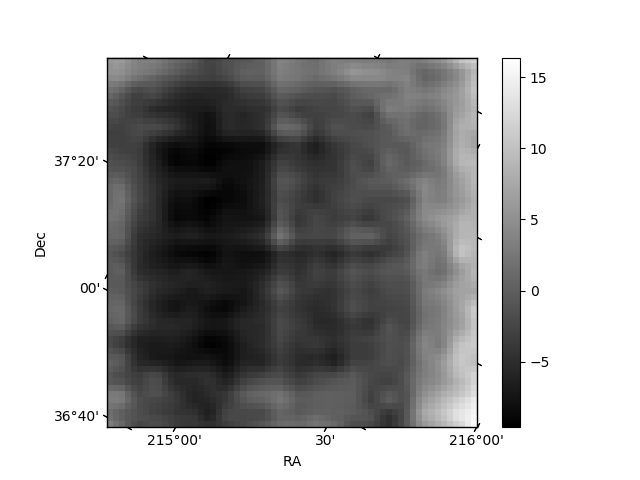
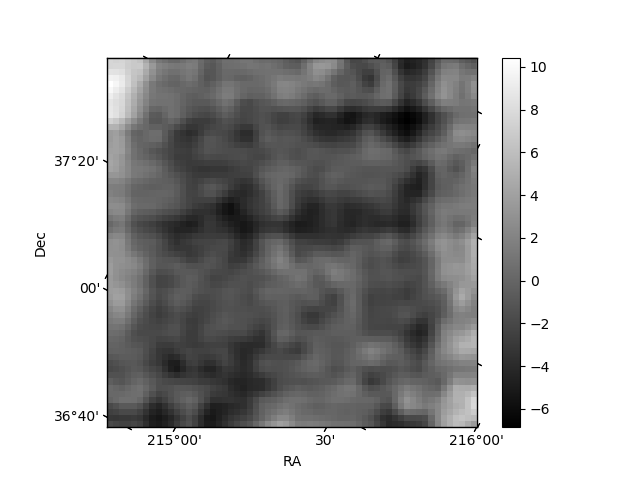
Histogram calculated using DETX and DETY for each event in the final _common_clean file
| Quadrant A | 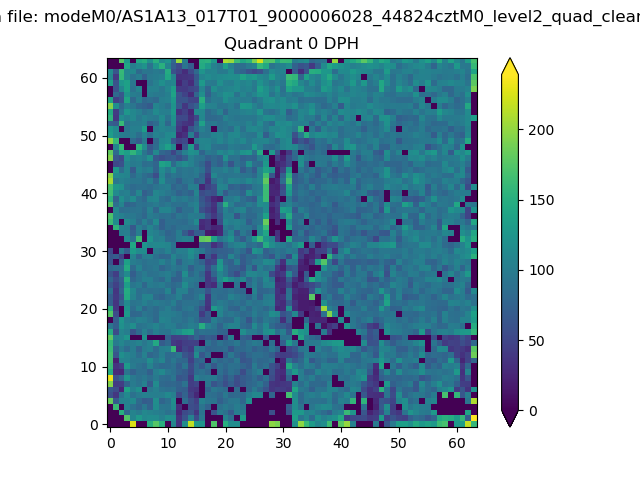 |
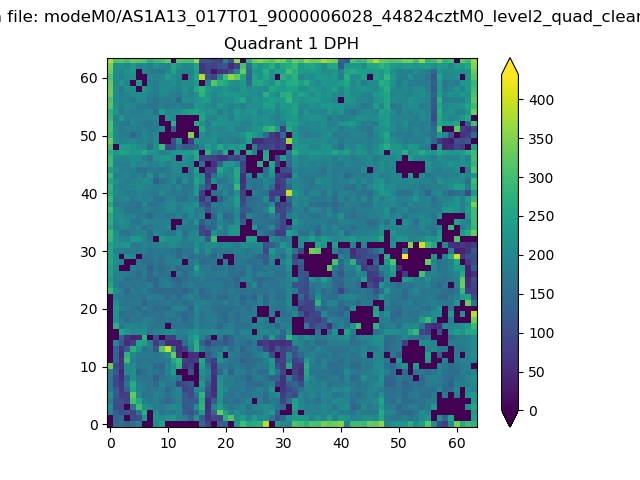 |
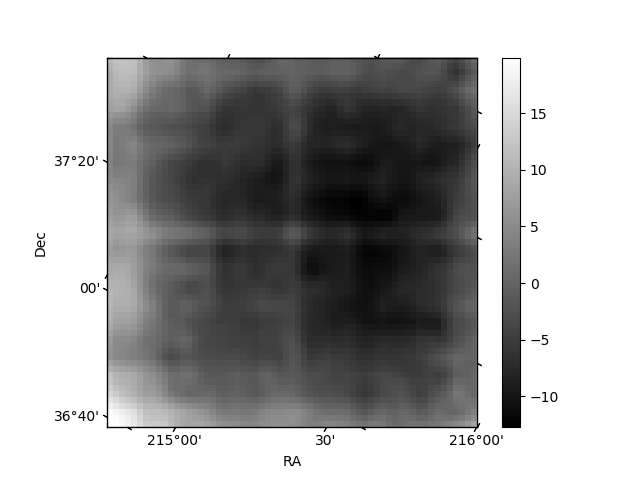
Quadrant B |
|---|---|---|---|
| Quadrant D | 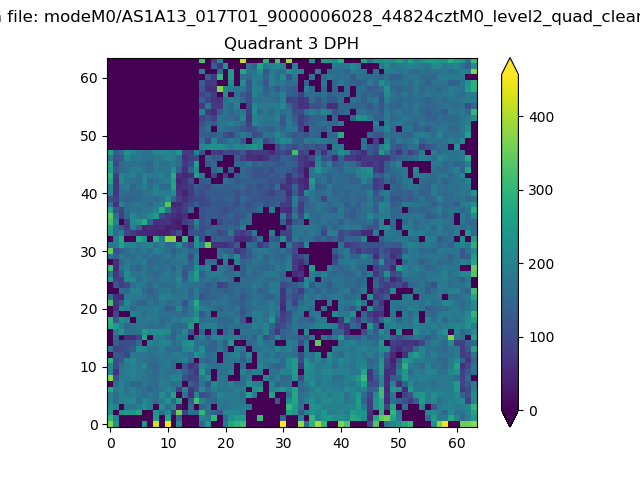 |
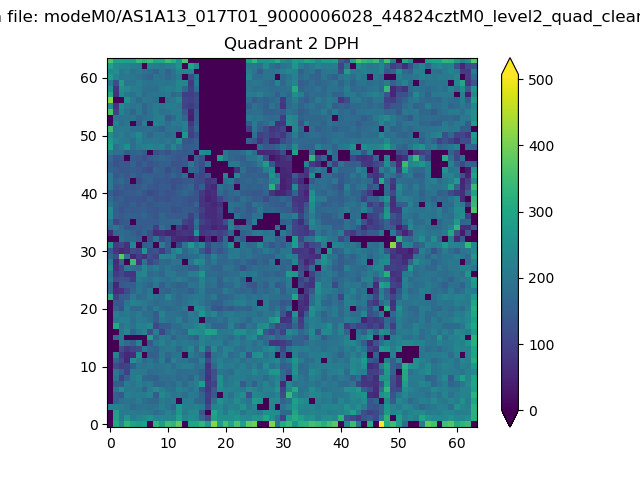 |
Quadrant C |
| Plot type | Count rate plots | Images |
|---|---|---|
| Comparison with Poisson distribution Blue bars denote a histogram of data divided into 1 sec bins. Red curve is a Poisson curve with rate = median count rate of data. |
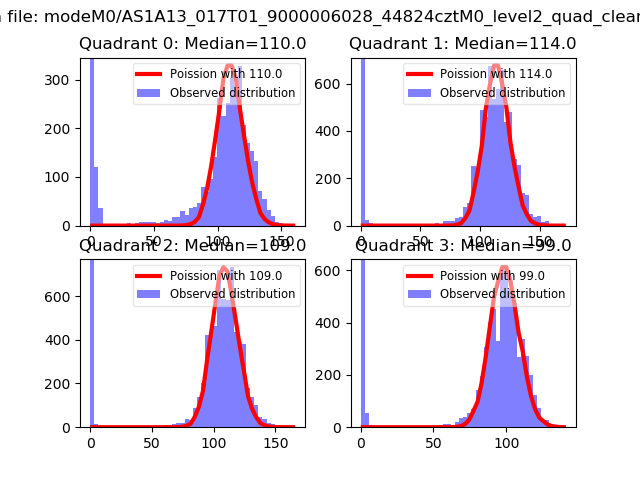 |
 |
| Quadrant-wise count rates Data is divided into 100 sec bins |
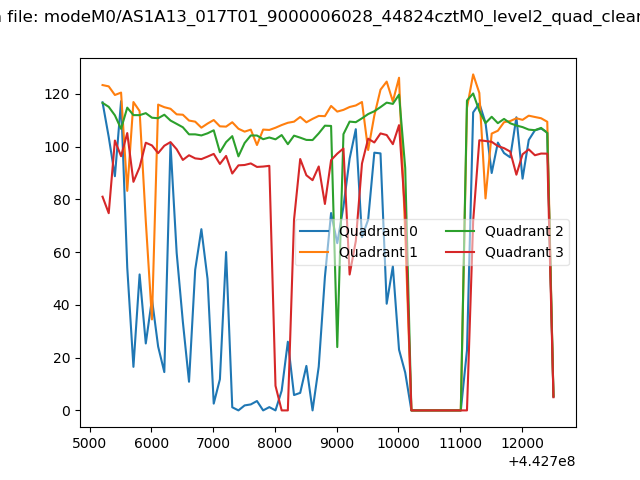 |
|
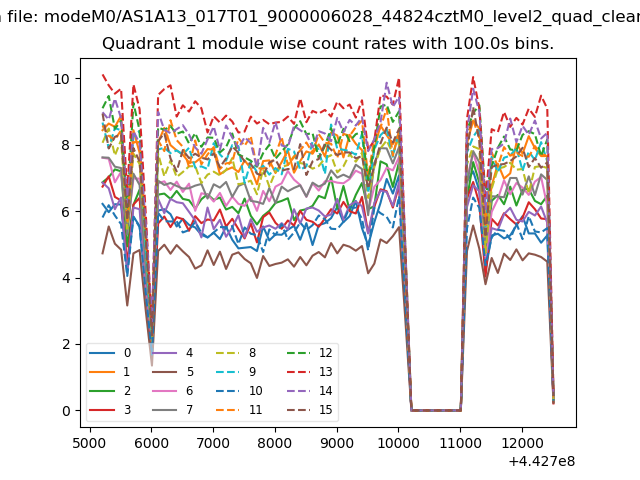
| Module-wise count rates for Quadrant A Data is divided into 100 sec bins |
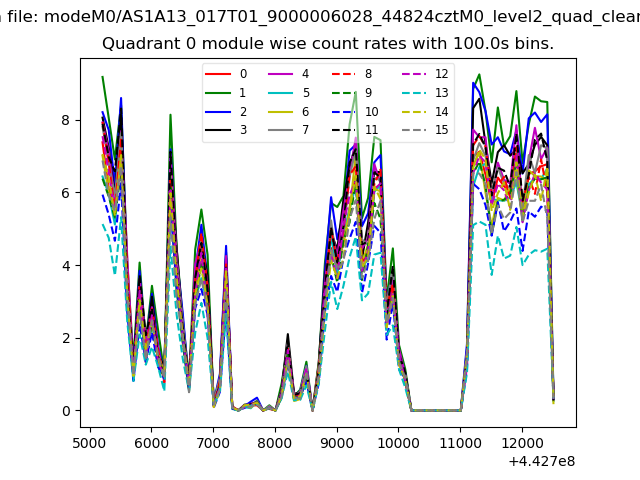 |
 |
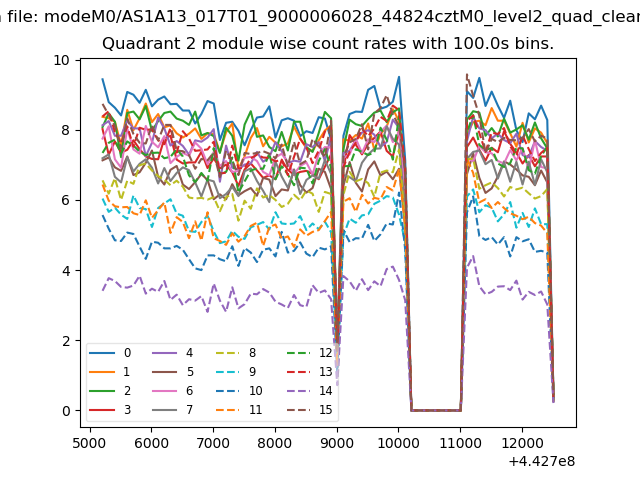
| Module-wise count rates for Quadrant B Data is divided into 100 sec bins |
 |
 |
| Module-wise count rates for Quadrant C Data is divided into 100 sec bins |
 |
 |
| Module-wise count rates for Quadrant D Data is divided into 100 sec bins |
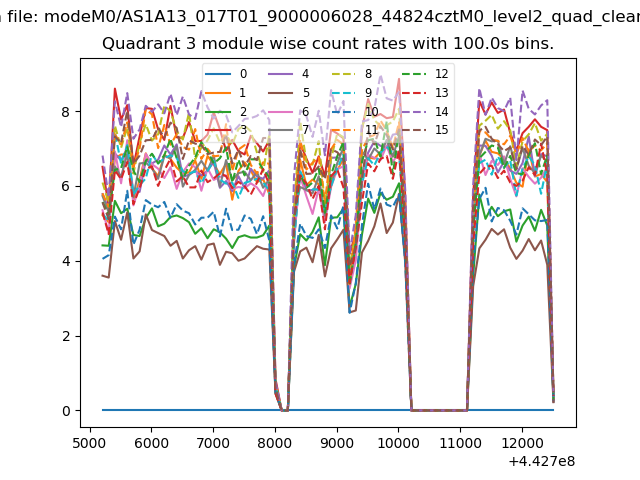 |
 |
| Parameter | Plot |
|---|---|
| CZT HV Monitor | 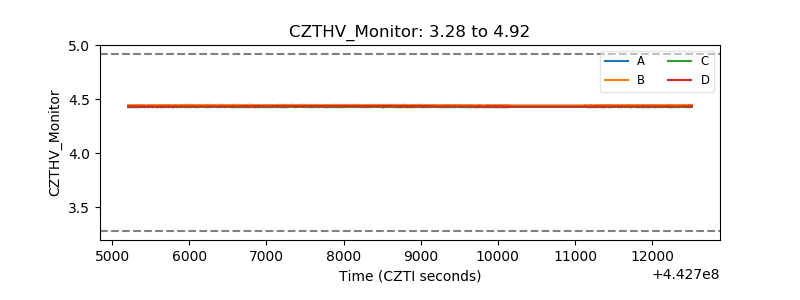 |
| D_VDD | 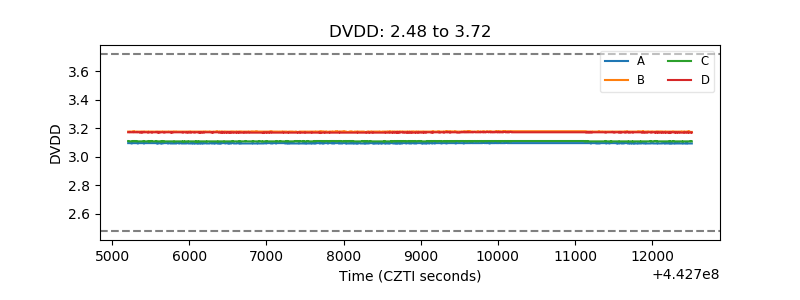 |
| Temperature 1 | 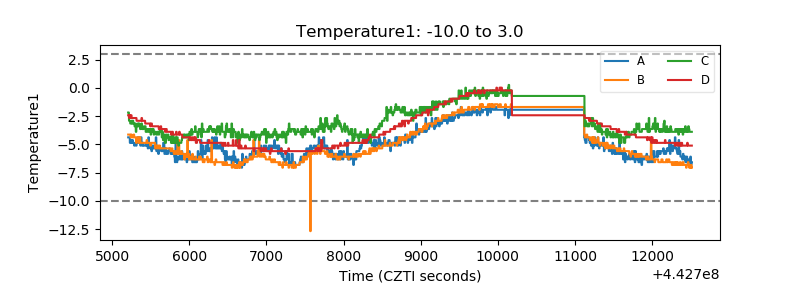 |
| Veto HV Monitor | 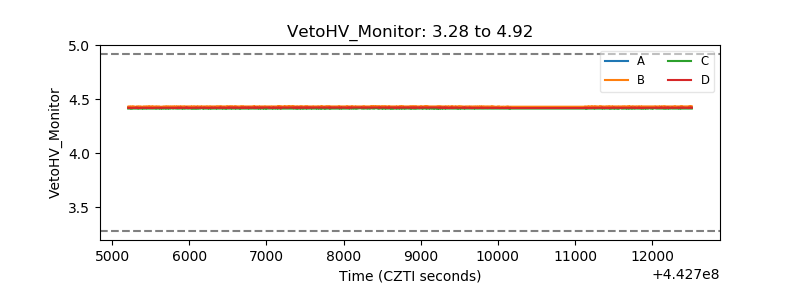 |
| Veto LLD | 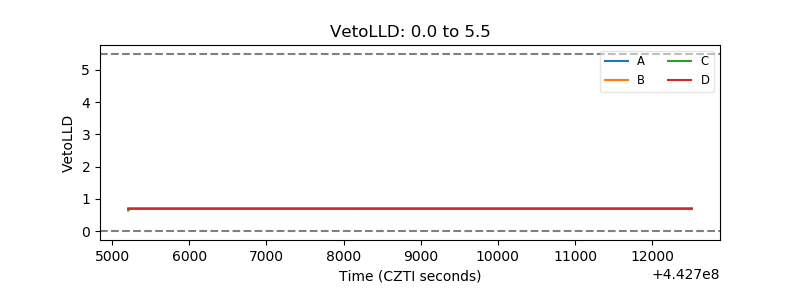 |
| Alpha Counter | 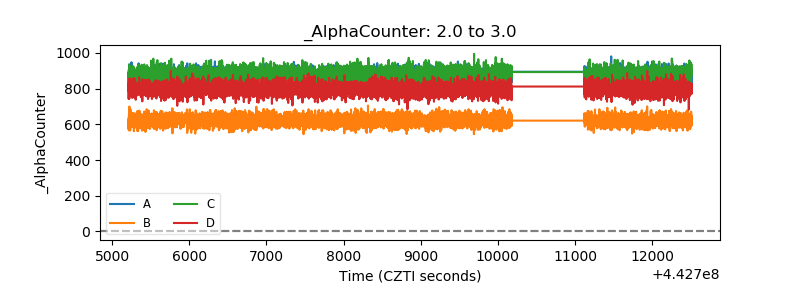 |
| _CPM_Rate | 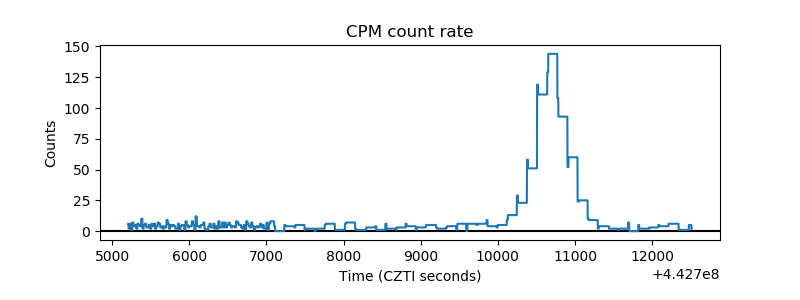 |
| CZT Counter | 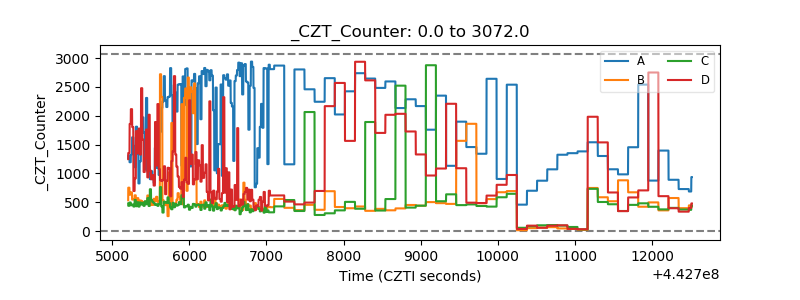 |
| +2.5 Volts monitor | 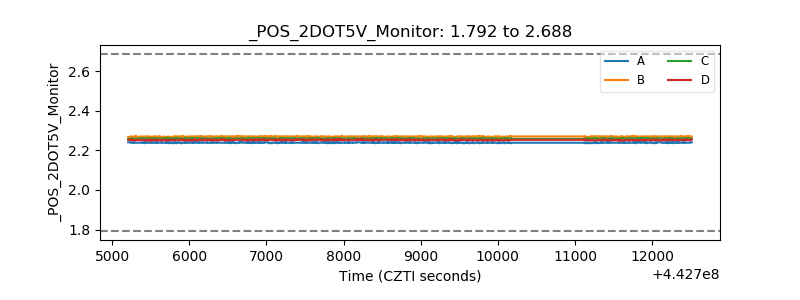 |
| +5 Volts monitor | 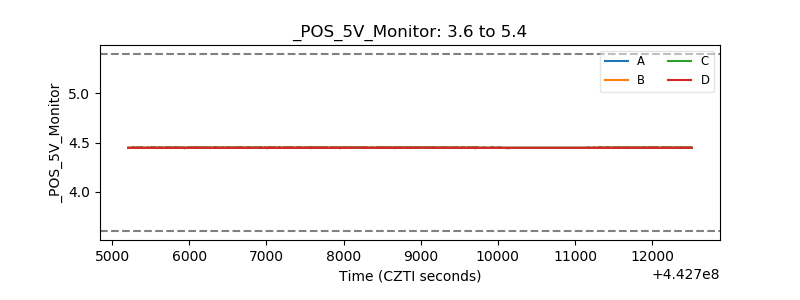 |
| _ROLL_ROT | 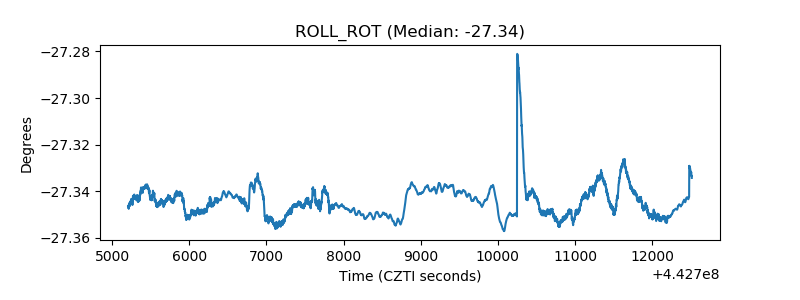 |
| _Roll_DEC | 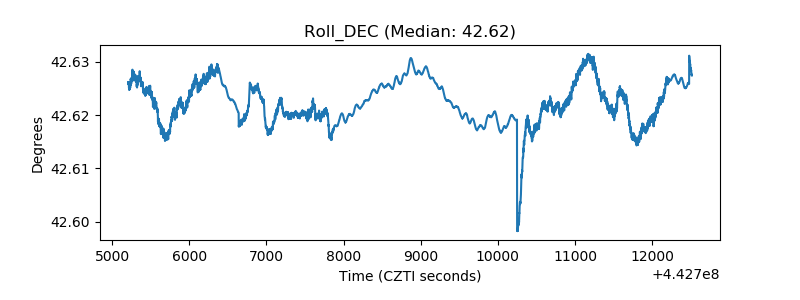 |
| _Roll_RA |  |
| Veto Counter | 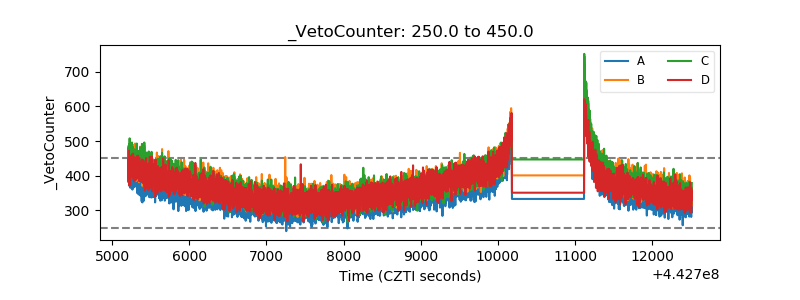 |