| Param | Original file | Final file |
|---|---|---|
| Filename | modeM0/AS1A13_017T01_9000006028_44825cztM0_level2.fits | modeM0/AS1A13_017T01_9000006028_44825cztM0_level2_quad_clean.evt |
| Size (bytes) | 583,833,600 | 113,901,120 |
| Size | 556.8 MB | 108.6 MB |
| Events in quadrant A | 6,654,997 | 758,247 |
| Events in quadrant B | 4,037,309 | 801,545 |
| Events in quadrant C | 3,305,217 | 775,507 |
| Events in quadrant D | 7,049,274 | 606,488 |
| Mode M0 | |||
|---|---|---|---|
| Quadrant | BADHDUFLAG | Total packets | Discarded packets |
| A | 0 | 25503 | 2 |
| B | 0 | 17176 | 2 |
| C | 0 | 15349 | 2 |
| D | 0 | 26091 | 2 |
| Mode SS | |||
|---|---|---|---|
| Quadrant | BADHDUFLAG | Total packets | Discarded packets |
| A | 0 | 148 | 0 |
| B | 0 | 148 | 0 |
| C | 0 | 148 | 0 |
| D | 0 | 148 | 0 |
| Mode M9 | |||
|---|---|---|---|
| Quadrant | BADHDUFLAG | Total packets | Discarded packets |
| A | 0 | 11 | 0 |
| B | 0 | 12 | 0 |
| C | 0 | 12 | 0 |
| D | 0 | 12 | 0 |
| Quadrant | Total seconds | Saturated seconds | Saturation percentage |
|---|---|---|---|
| A | 7285 | 383 | 5.257378% |
| B | 7285 | 217 | 2.978723% |
| C | 7285 | 52 | 0.713795% |
| D | 7285 | 1090 | 14.962251% |
Noise dominated data is calculated using 1-second bins in cleaned event files. If a bin has >2000 counts, and if more than 50% of those come from <1% of pixels, then it is considered to be noise-dominated and hence unusable.
| Quadrant | # 1 sec bins | Bins with >0 counts | Bins with >2000 counts | High rate bins dominated by noise | Noise dominated (total time) | Noise dominated (detector-on time) | Marked lightcurve |
|---|---|---|---|---|---|---|---|
| A | 7800 | 7287 | 200 | 200 | 2.56% | 2.74% |  |
| B | 7799 | 7286 | 123 | 123 | 1.58% | 1.69% | 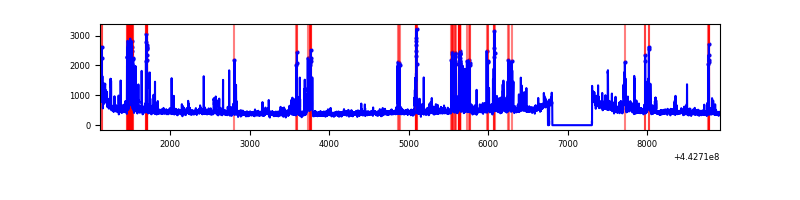 |
| C | 7799 | 7286 | 19 | 19 | 0.24% | 0.26% | 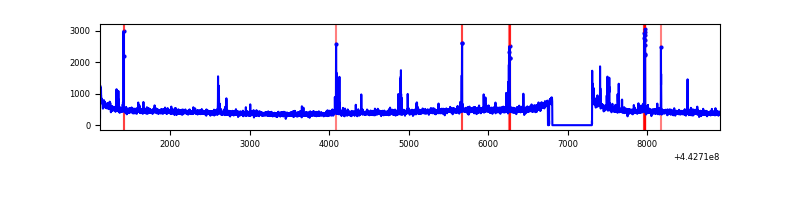 |
| D | 7800 | 7287 | 811 | 811 | 10.40% | 11.13% | 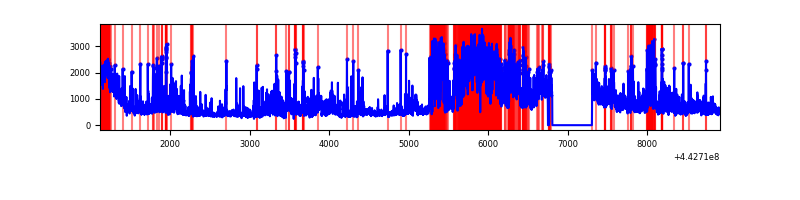 |
Top three noisy pixels from each quadrant. If the there are fewer than three noisy pixels in the level2.evt file, extra rows are filled as -1
| Pixel properties | Quadrant properties | ||||||
|---|---|---|---|---|---|---|---|
| Quadrant | DetID | PixID | Counts | Sigma | Mean | Median | Sigma |
| A | 10 | 83 | 2285309 | 13630.41 | 800 | 783 | 167.6 |
| A | 15 | 223 | 1227839 | 7321.11 | 800 | 783 | 167.6 |
| A | 13 | 248 | 32761 | 190.79 | 800 | 783 | 167.6 |
| B | 5 | 255 | 176283 | 1100.91 | 805 | 780 | 159.4 |
| B | 5 | 172 | 146511 | 914.15 | 805 | 780 | 159.4 |
| B | 0 | 219 | 90435 | 562.4 | 805 | 780 | 159.4 |
| C | 12 | 2 | 50378 | 264.89 | 797 | 802 | 187.2 |
| C | 3 | 233 | 48821 | 256.57 | 797 | 802 | 187.2 |
| C | 14 | 254 | 36595 | 191.25 | 797 | 802 | 187.2 |
| D | 1 | 52 | 1216224 | 6693.5 | 723 | 699 | 181.6 |
| D | 13 | 174 | 1115277 | 6137.61 | 723 | 699 | 181.6 |
| D | 13 | 187 | 896909 | 4935.13 | 723 | 699 | 181.6 |
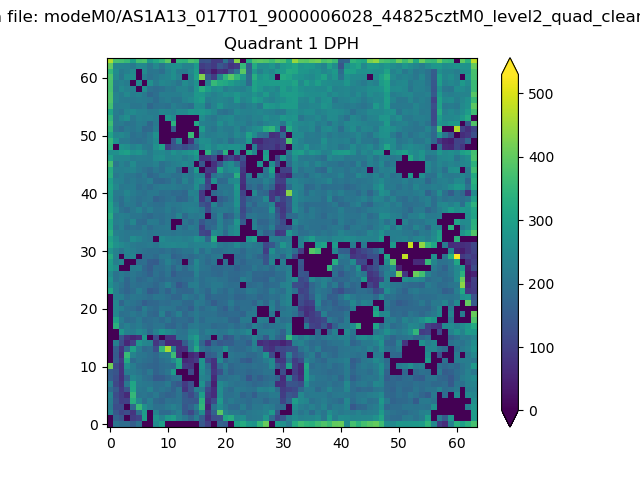
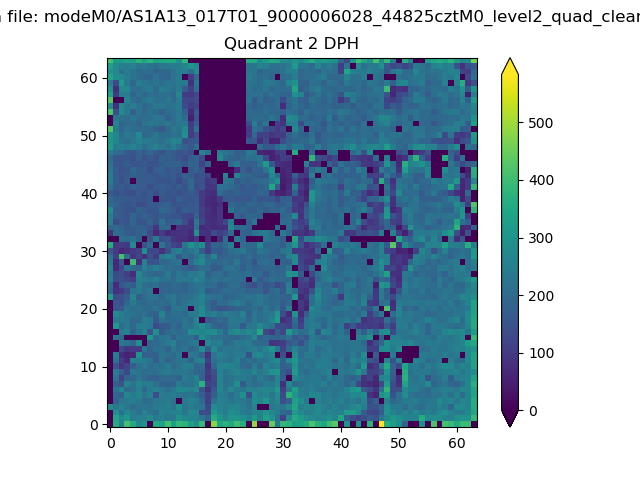
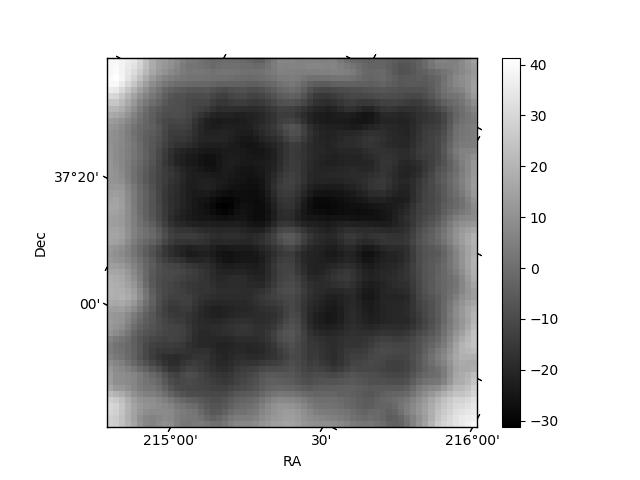
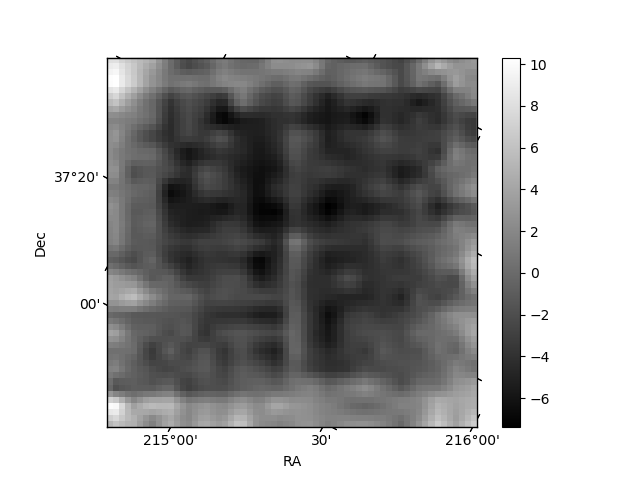
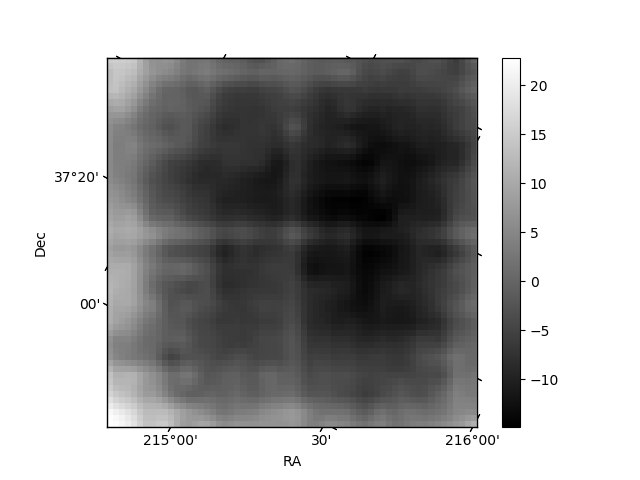
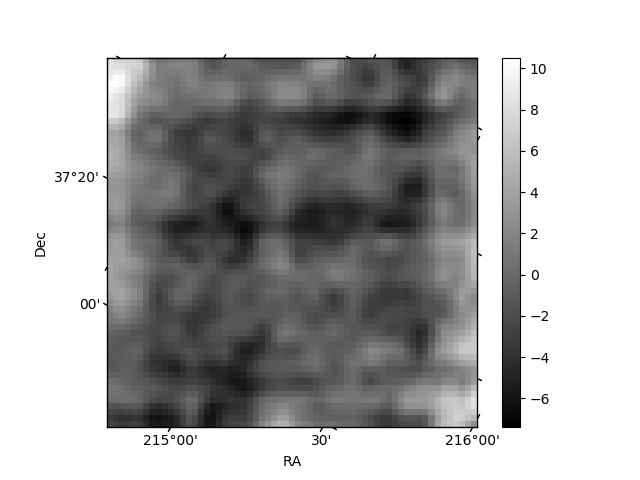
Histogram calculated using DETX and DETY for each event in the final _common_clean file
| Quadrant A | 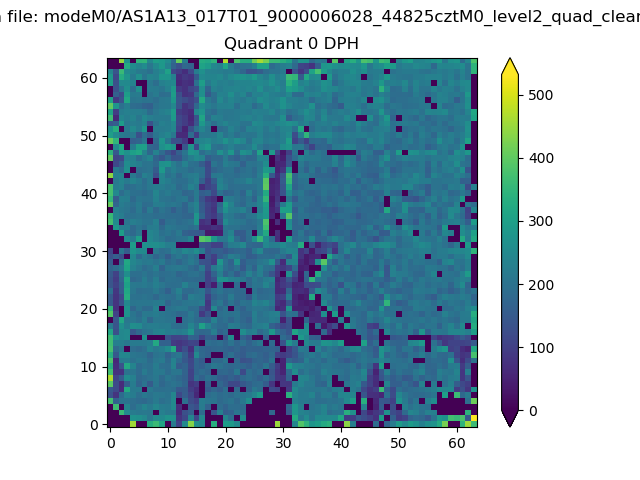 |
 |
Quadrant B |
|---|---|---|---|
| Quadrant D | 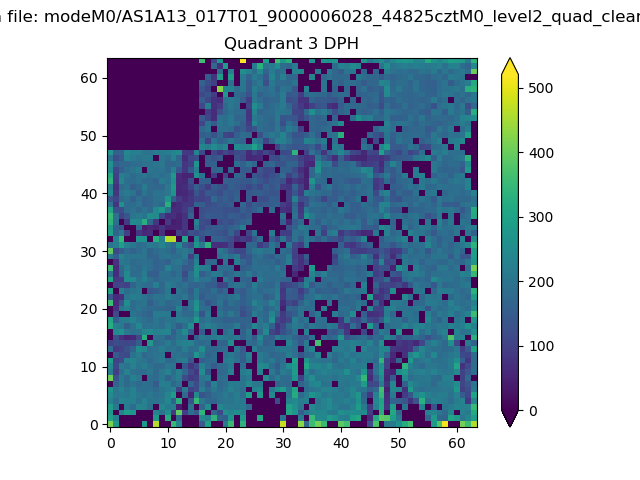 |
 |
Quadrant C |
| Plot type | Count rate plots | Images |
|---|---|---|
| Comparison with Poisson distribution Blue bars denote a histogram of data divided into 1 sec bins. Red curve is a Poisson curve with rate = median count rate of data. |
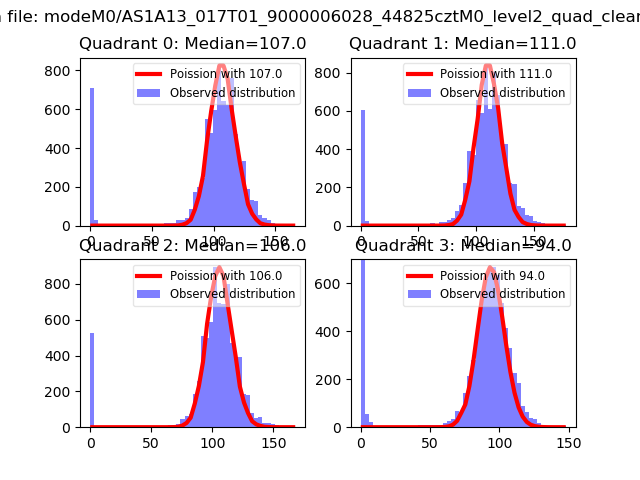 |
 |
| Quadrant-wise count rates Data is divided into 100 sec bins |
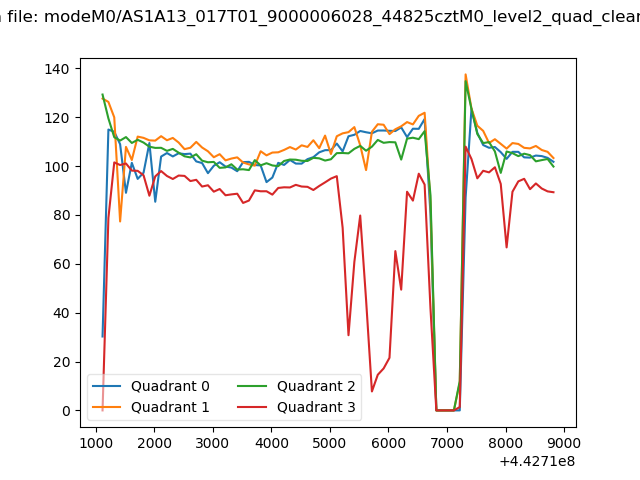 |
|
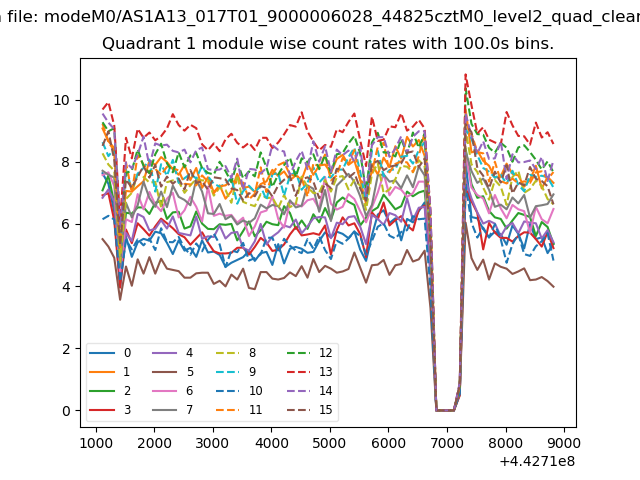
| Module-wise count rates for Quadrant A Data is divided into 100 sec bins |
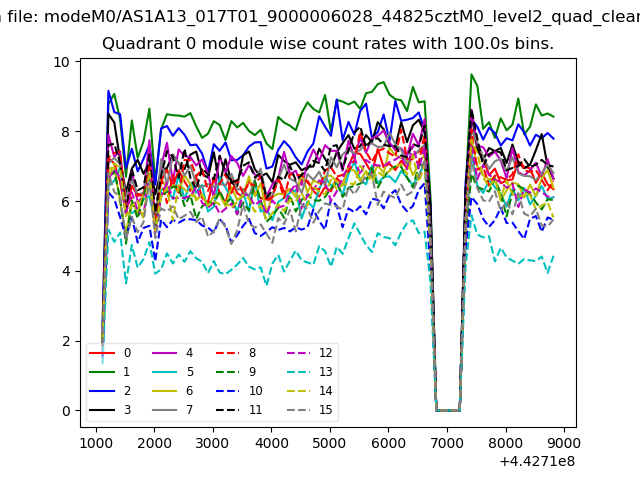 |
 |
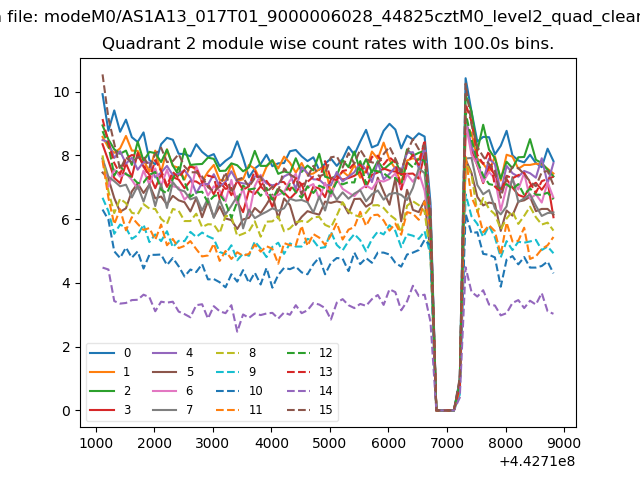
| Module-wise count rates for Quadrant B Data is divided into 100 sec bins |
 |
 |
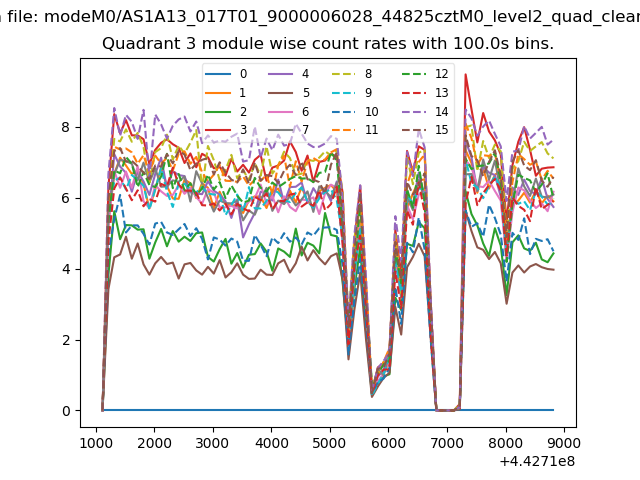
| Module-wise count rates for Quadrant C Data is divided into 100 sec bins |
 |
 |
| Module-wise count rates for Quadrant D Data is divided into 100 sec bins |
 |
 |
| Parameter | Plot |
|---|---|
| CZT HV Monitor | 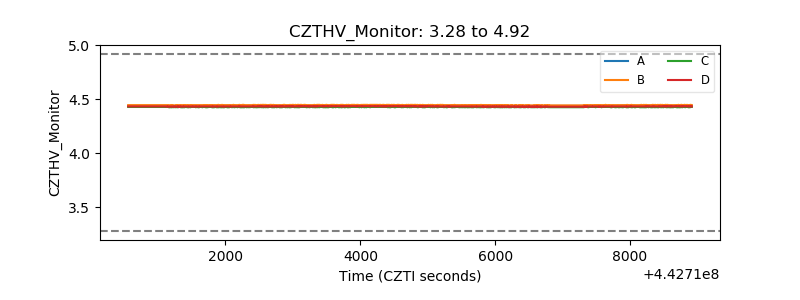 |
| D_VDD | 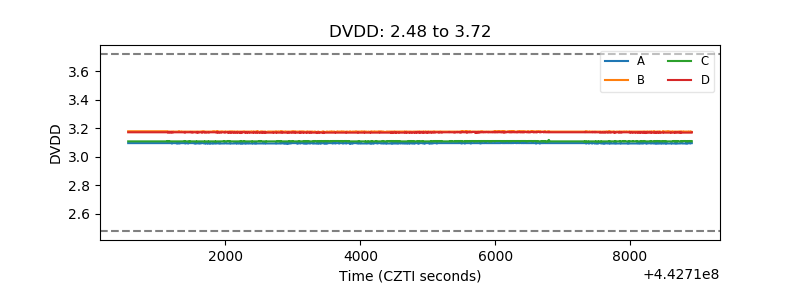 |
| Temperature 1 | 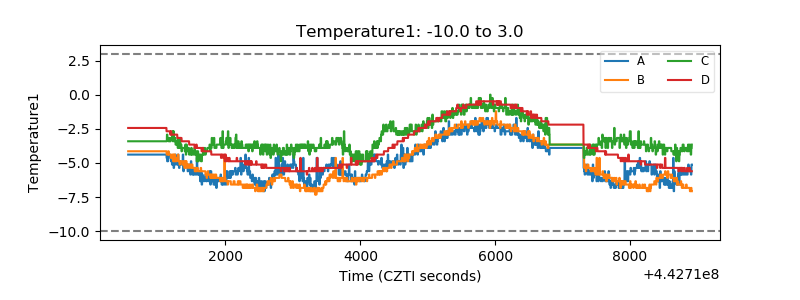 |
| Veto HV Monitor | 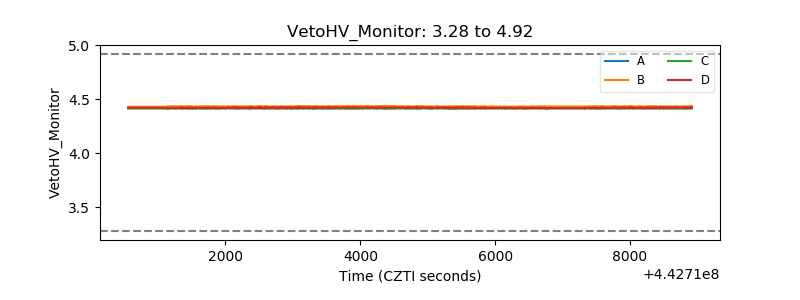 |
| Veto LLD | 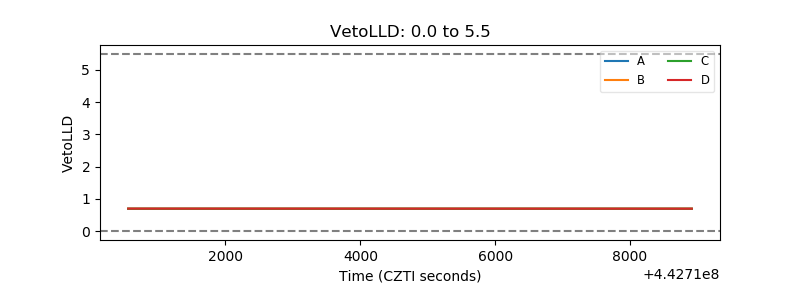 |
| Alpha Counter | 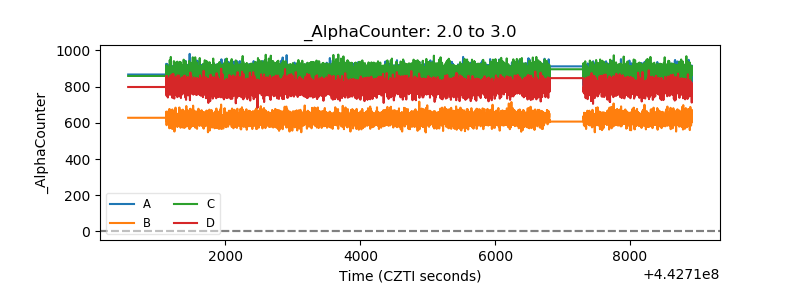 |
| _CPM_Rate | 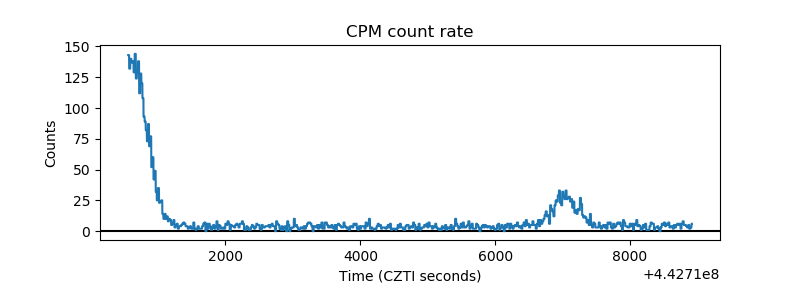 |
| CZT Counter | 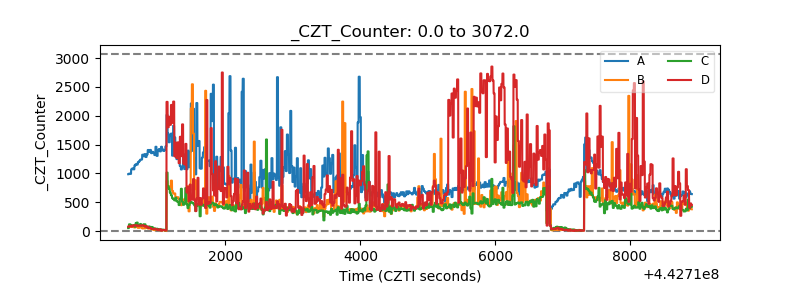 |
| +2.5 Volts monitor | 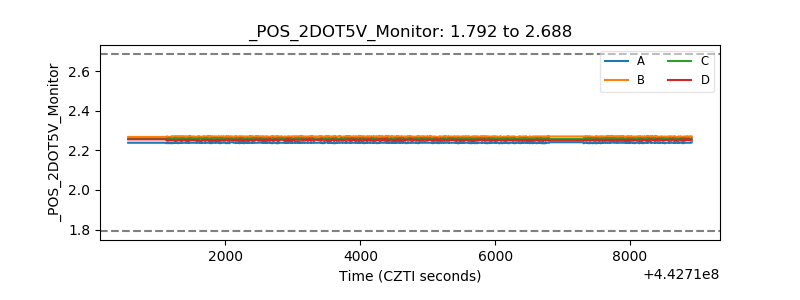 |
| +5 Volts monitor | 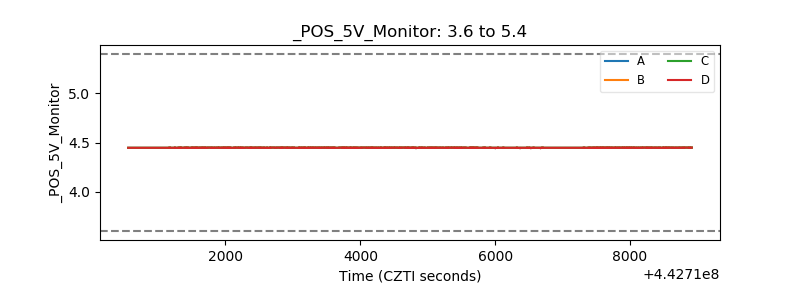 |
| _ROLL_ROT | 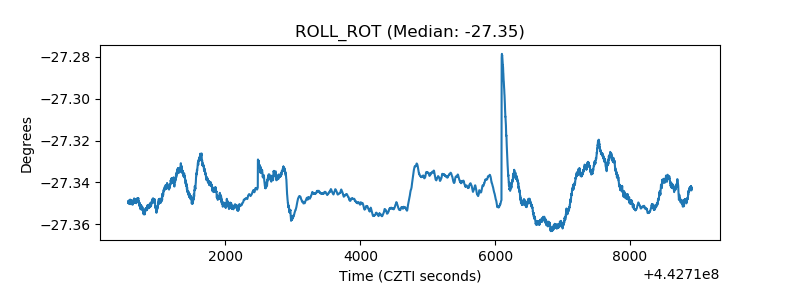 |
| _Roll_DEC | 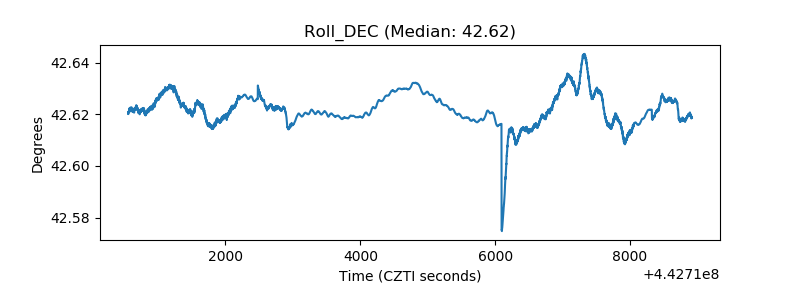 |
| _Roll_RA | 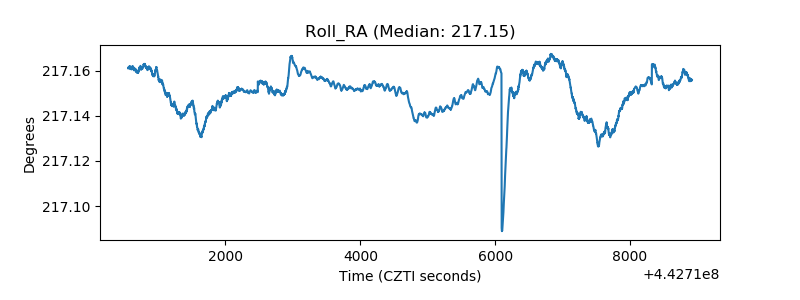 |
| Veto Counter | 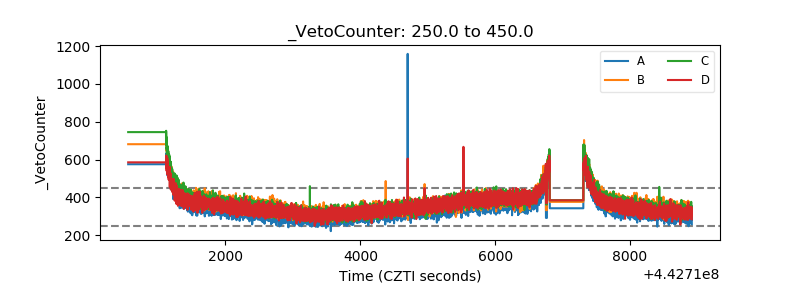 |