| Param | Original file | Final file |
|---|---|---|
| Filename | modeM0/AS1A13_017T01_9000006028_44830cztM0_level2.fits | modeM0/AS1A13_017T01_9000006028_44830cztM0_level2_quad_clean.evt |
| Size (bytes) | 1,261,244,160 | 289,137,600 |
| Size | 1.2 GB | 275.7 MB |
| Events in quadrant A | 13,700,799 | 1,921,279 |
| Events in quadrant B | 9,475,608 | 1,979,256 |
| Events in quadrant C | 8,675,003 | 1,917,190 |
| Events in quadrant D | 13,373,955 | 1,634,533 |
| Mode M0 | |||
|---|---|---|---|
| Quadrant | BADHDUFLAG | Total packets | Discarded packets |
| A | 0 | 57282 | 2 |
| B | 0 | 41547 | 2 |
| C | 0 | 39962 | 7 |
| D | 0 | 53040 | 10 |
| Mode SS | |||
|---|---|---|---|
| Quadrant | BADHDUFLAG | Total packets | Discarded packets |
| A | 0 | 382 | 0 |
| B | 0 | 382 | 0 |
| C | 0 | 382 | 0 |
| D | 0 | 382 | 0 |
| Mode M9 | |||
|---|---|---|---|
| Quadrant | BADHDUFLAG | Total packets | Discarded packets |
| A | 0 | 10 | 0 |
| B | 0 | 10 | 0 |
| C | 0 | 10 | 0 |
| D | 0 | 10 | 0 |
| Quadrant | Total seconds | Saturated seconds | Saturation percentage |
|---|---|---|---|
| A | 18889 | 510 | 2.699984% |
| B | 18889 | 613 | 3.245275% |
| C | 18888 | 270 | 1.429479% |
| D | 18887 | 1455 | 7.703712% |
Noise dominated data is calculated using 1-second bins in cleaned event files. If a bin has >2000 counts, and if more than 50% of those come from <1% of pixels, then it is considered to be noise-dominated and hence unusable.
| Quadrant | # 1 sec bins | Bins with >0 counts | Bins with >2000 counts | High rate bins dominated by noise | Noise dominated (total time) | Noise dominated (detector-on time) | Marked lightcurve |
|---|---|---|---|---|---|---|---|
| A | 19914 | 18891 | 17 | 17 | 0.09% | 0.09% | 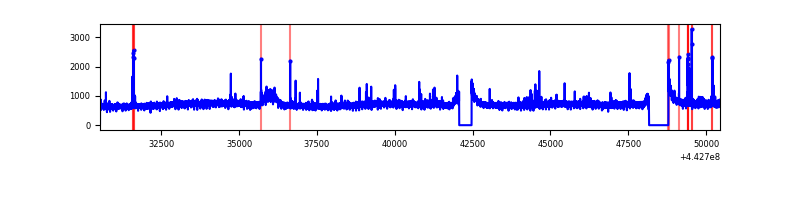 |
| B | 19914 | 18891 | 191 | 191 | 0.96% | 1.01% | 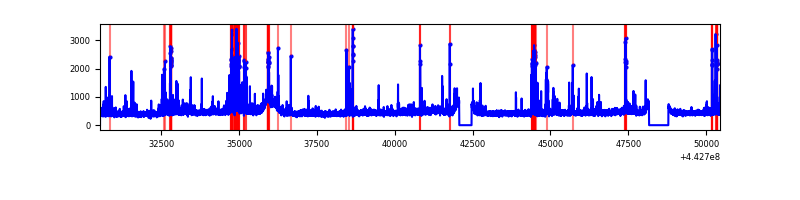 |
| C | 19915 | 18891 | 63 | 63 | 0.32% | 0.33% | 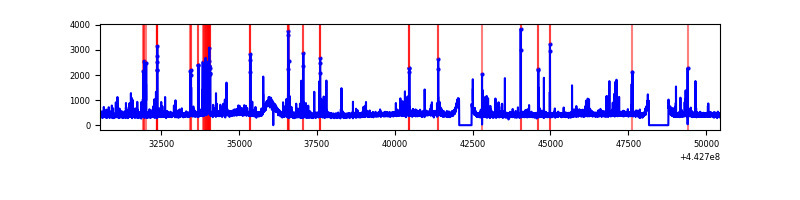 |
| D | 19914 | 18890 | 1021 | 1021 | 5.13% | 5.40% | 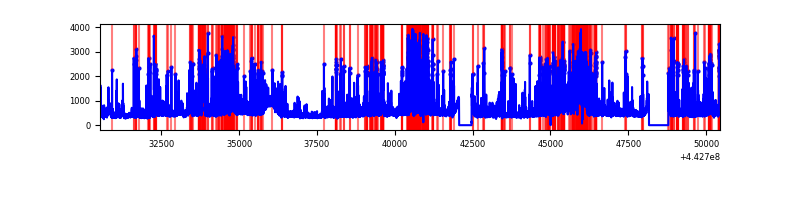 |
Top three noisy pixels from each quadrant. If the there are fewer than three noisy pixels in the level2.evt file, extra rows are filled as -1
| Pixel properties | Quadrant properties | ||||||
|---|---|---|---|---|---|---|---|
| Quadrant | DetID | PixID | Counts | Sigma | Mean | Median | Sigma |
| A | 10 | 83 | 5394583 | 12341.67 | 2092 | 2046 | 436.9 |
| A | 13 | 248 | 108166 | 242.87 | 2092 | 2046 | 436.9 |
| A | 7 | 3 | 43024 | 93.78 | 2092 | 2046 | 436.9 |
| B | 5 | 172 | 542828 | 1329.75 | 2066 | 1995 | 406.7 |
| B | 5 | 255 | 214023 | 521.31 | 2066 | 1995 | 406.7 |
| B | 4 | 171 | 135537 | 328.34 | 2066 | 1995 | 406.7 |
| C | 14 | 254 | 344162 | 713.32 | 2042 | 2050 | 479.6 |
| C | 15 | 158 | 128730 | 264.14 | 2042 | 2050 | 479.6 |
| C | 1 | 3 | 73561 | 149.1 | 2042 | 2050 | 479.6 |
| D | 1 | 52 | 1838853 | 3702.99 | 1979 | 1917 | 496.1 |
| D | 5 | 235 | 1683407 | 3389.64 | 1979 | 1917 | 496.1 |
| D | 2 | 249 | 557606 | 1120.19 | 1979 | 1917 | 496.1 |
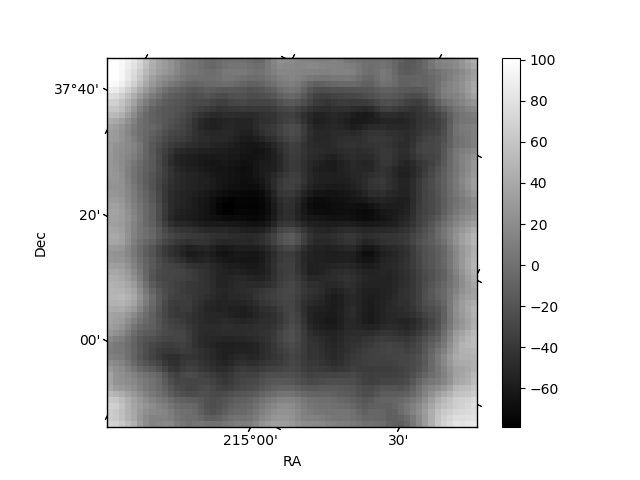
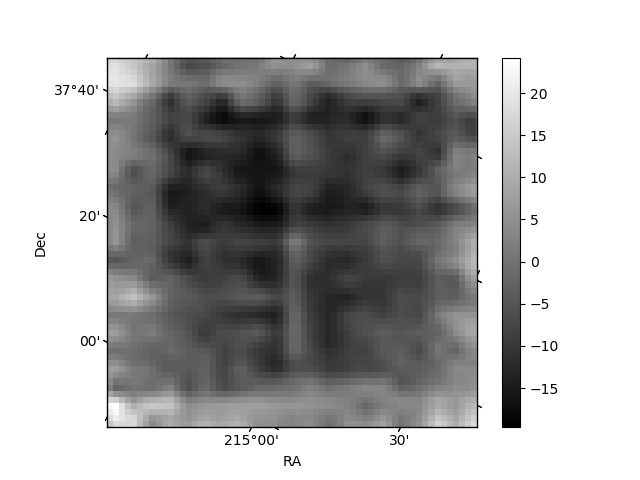
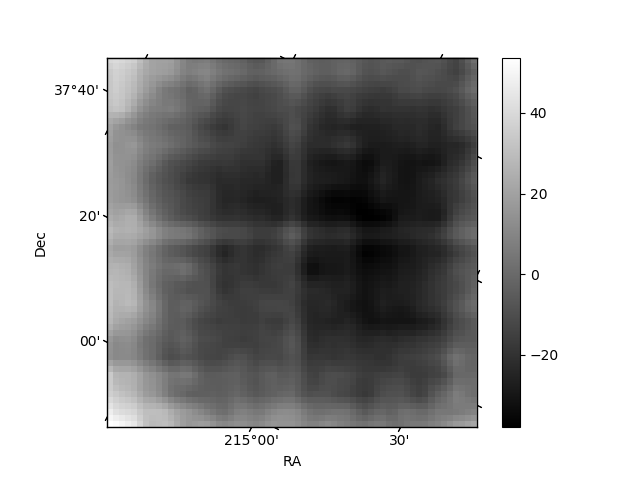
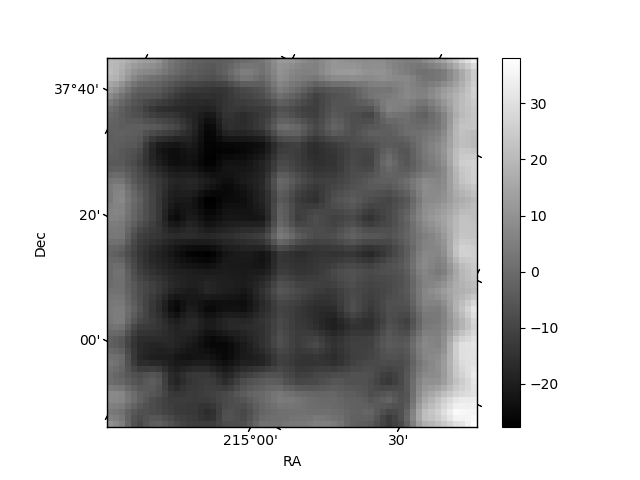
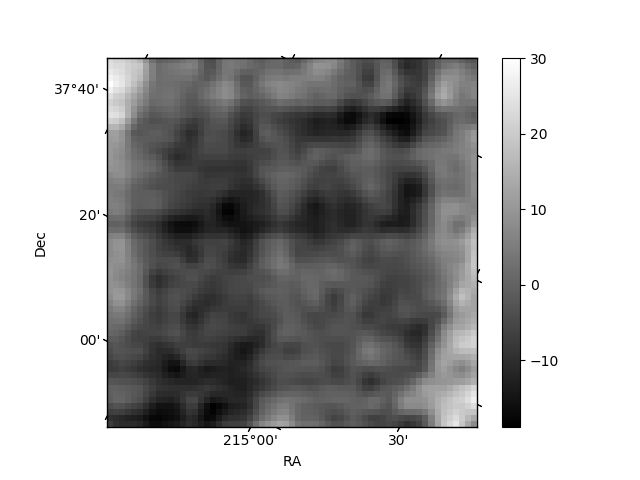
Histogram calculated using DETX and DETY for each event in the final _common_clean file
| Quadrant A | 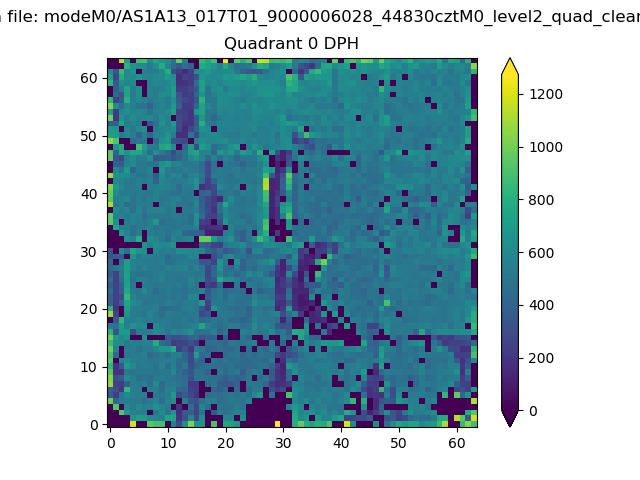 |
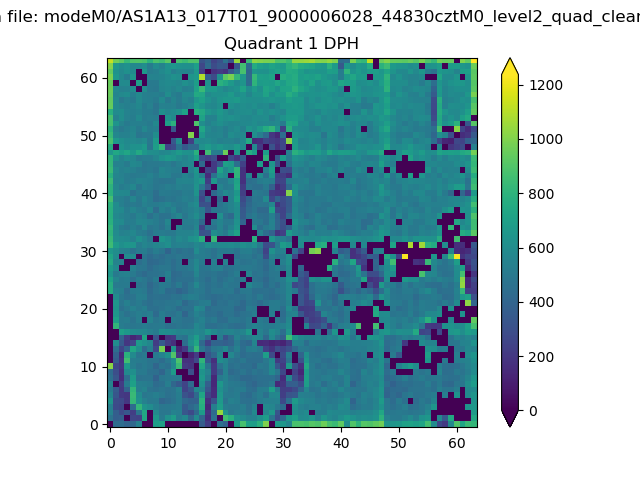 |
Quadrant B |
|---|---|---|---|
| Quadrant D | 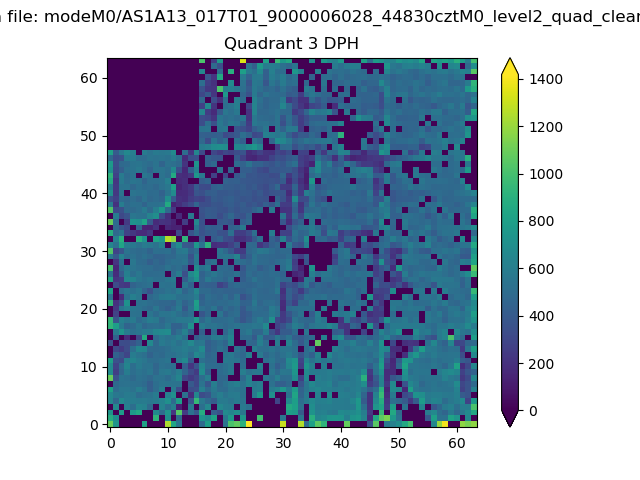 |
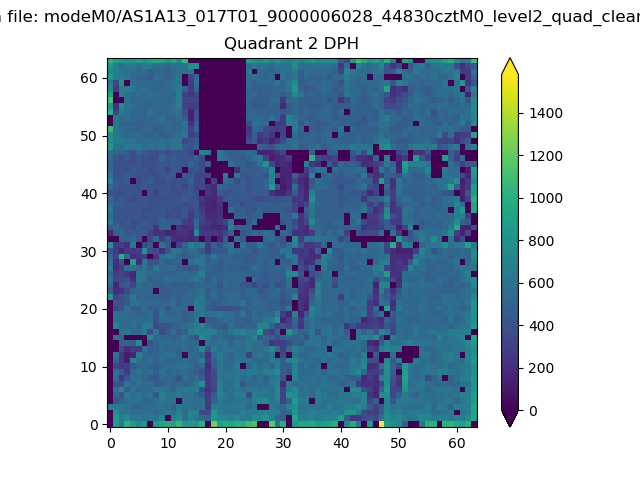 |
Quadrant C |
| Plot type | Count rate plots | Images |
|---|---|---|
| Comparison with Poisson distribution Blue bars denote a histogram of data divided into 1 sec bins. Red curve is a Poisson curve with rate = median count rate of data. |
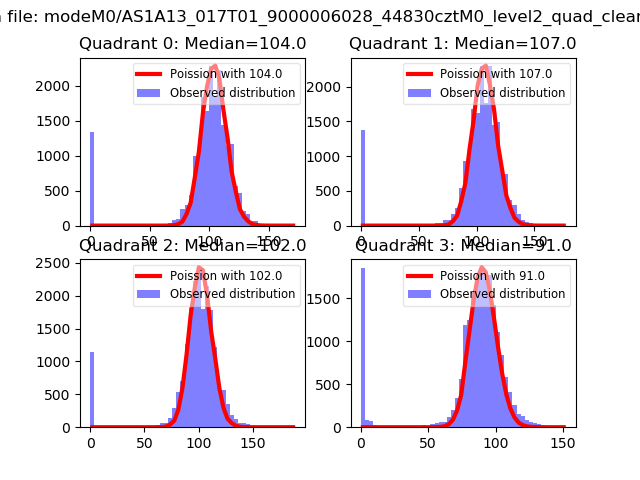 |
 |
| Quadrant-wise count rates Data is divided into 100 sec bins |
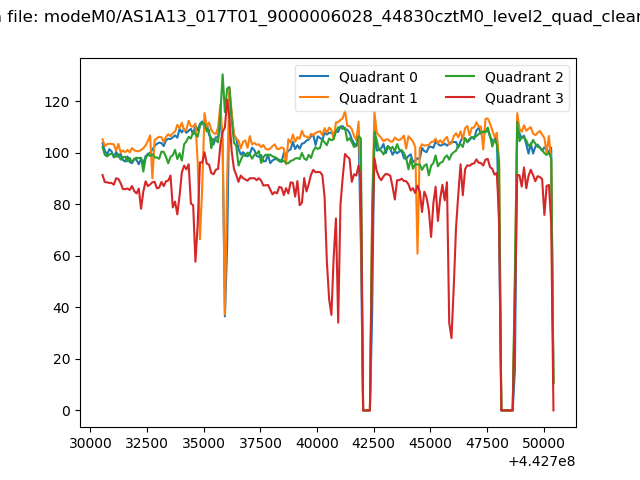 |
|
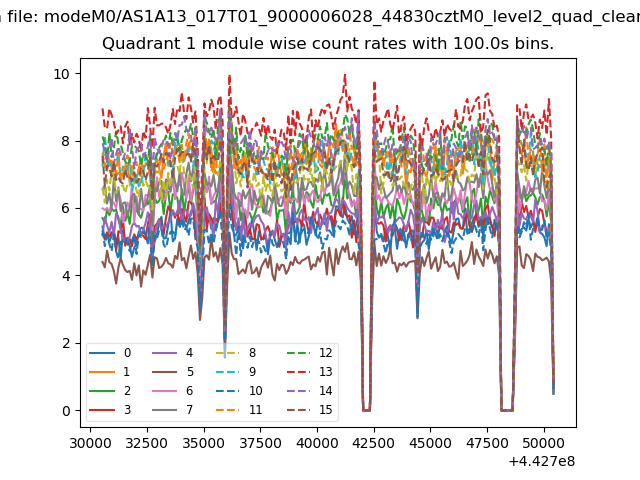
| Module-wise count rates for Quadrant A Data is divided into 100 sec bins |
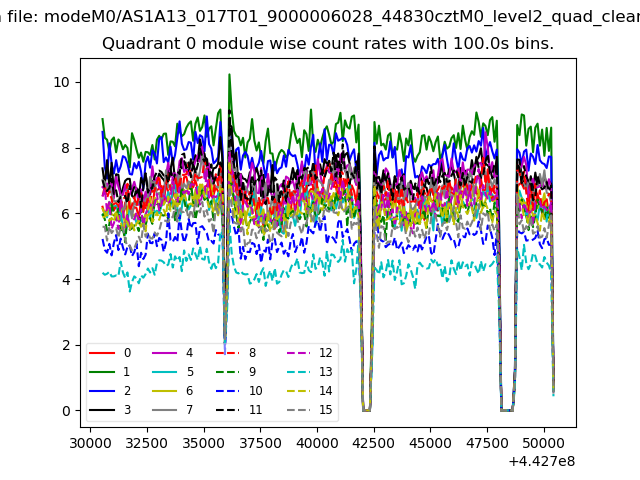 |
 |
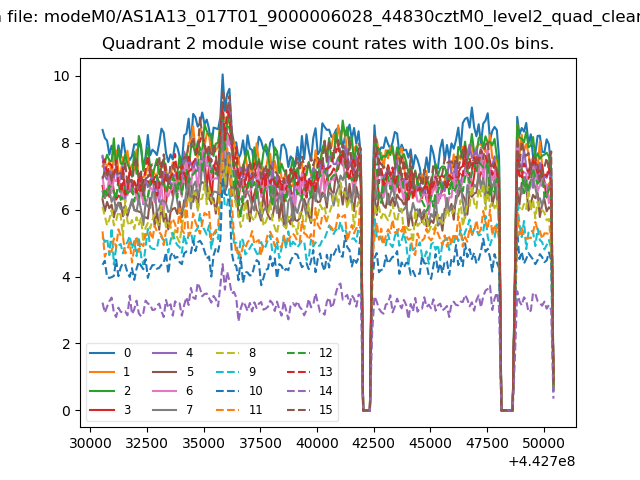
| Module-wise count rates for Quadrant B Data is divided into 100 sec bins |
 |
 |
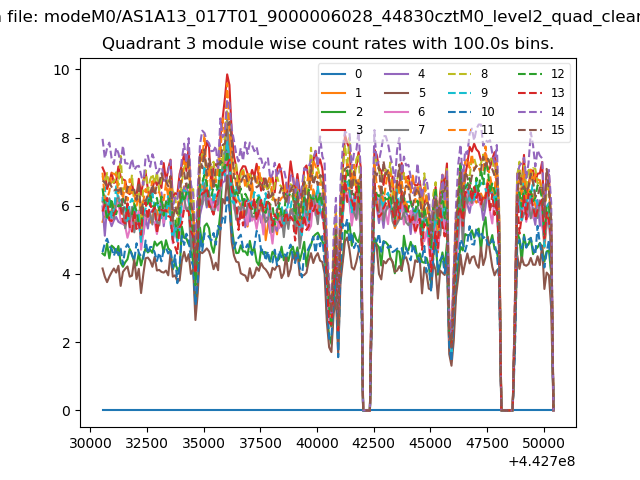
| Module-wise count rates for Quadrant C Data is divided into 100 sec bins |
 |
 |
| Module-wise count rates for Quadrant D Data is divided into 100 sec bins |
 |
 |
| Parameter | Plot |
|---|---|
| CZT HV Monitor | 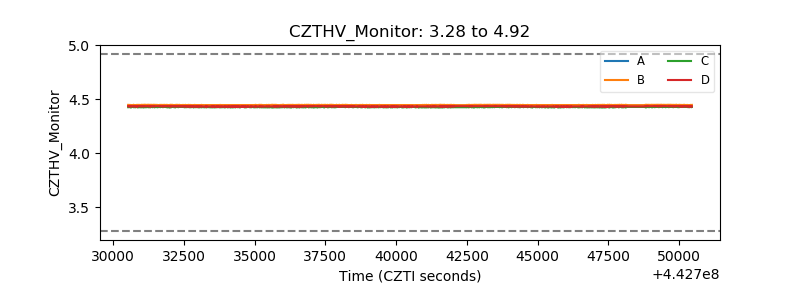 |
| D_VDD | 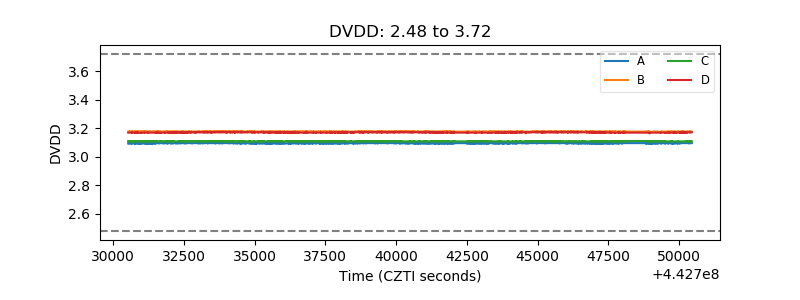 |
| Temperature 1 | 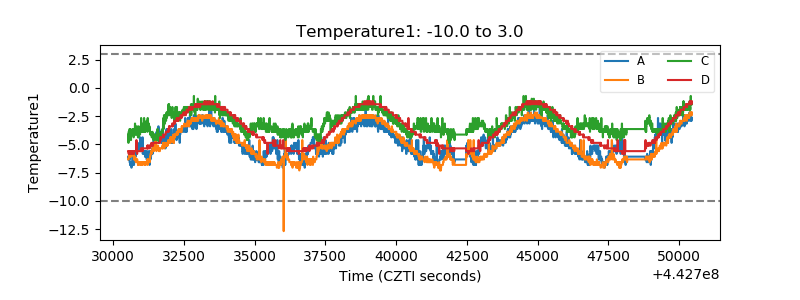 |
| Veto HV Monitor | 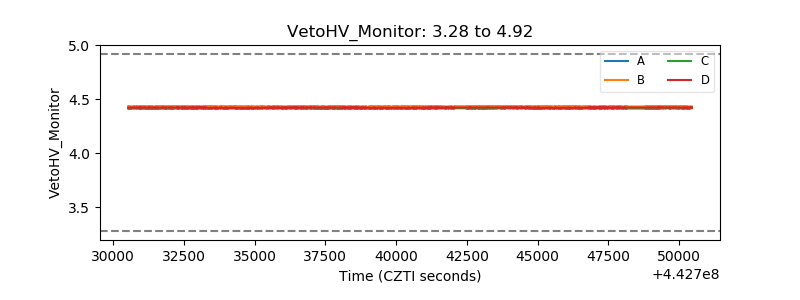 |
| Veto LLD | 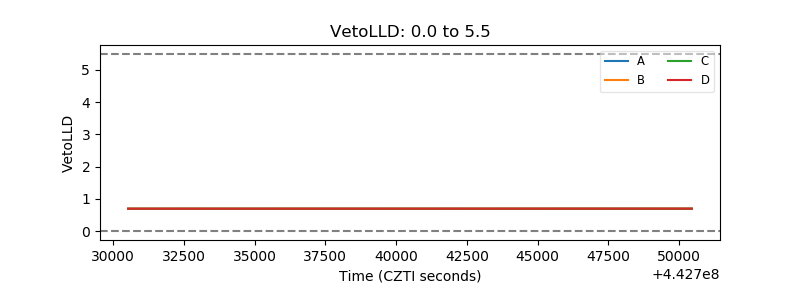 |
| Alpha Counter | 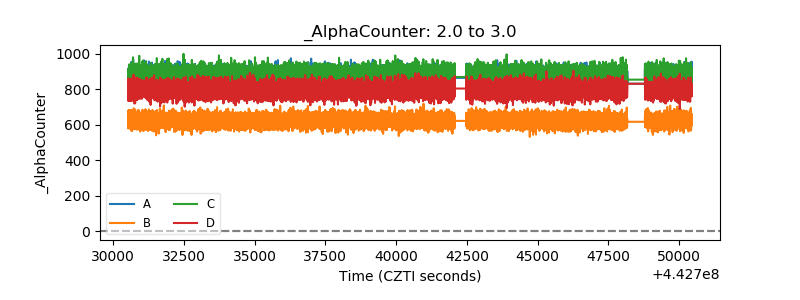 |
| _CPM_Rate | 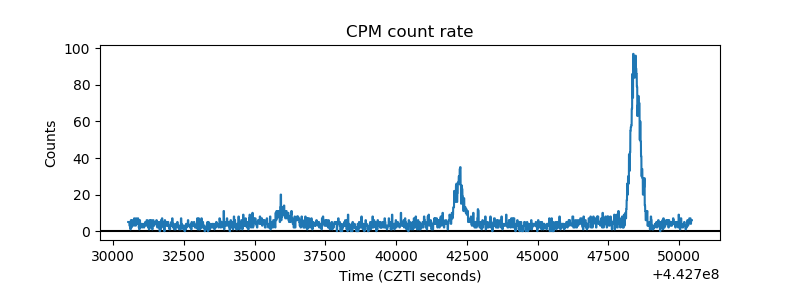 |
| CZT Counter | 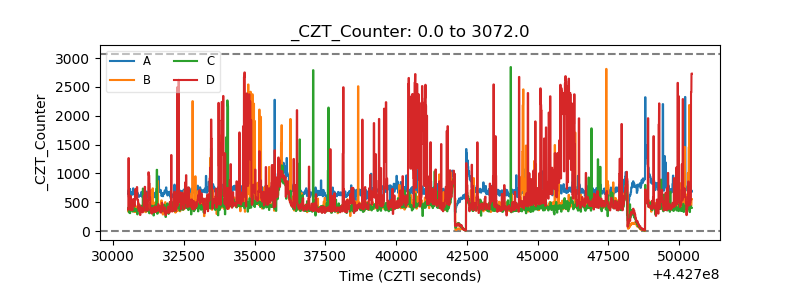 |
| +2.5 Volts monitor | 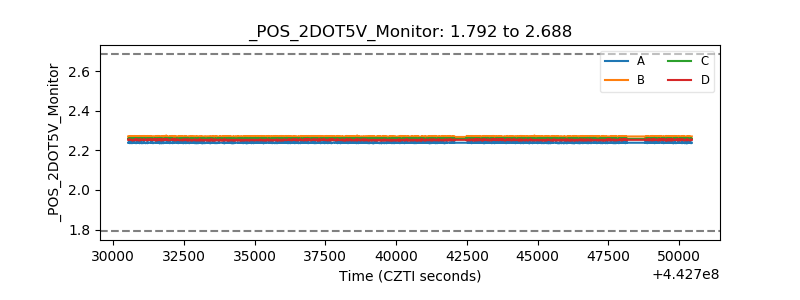 |
| +5 Volts monitor | 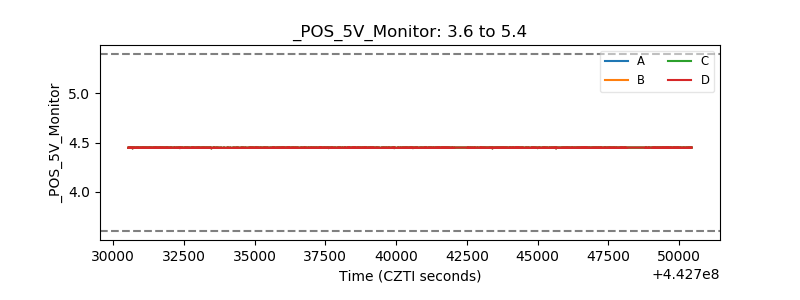 |
| _ROLL_ROT | 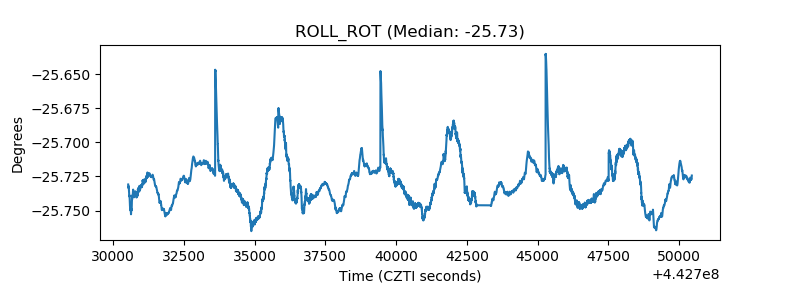 |
| _Roll_DEC | 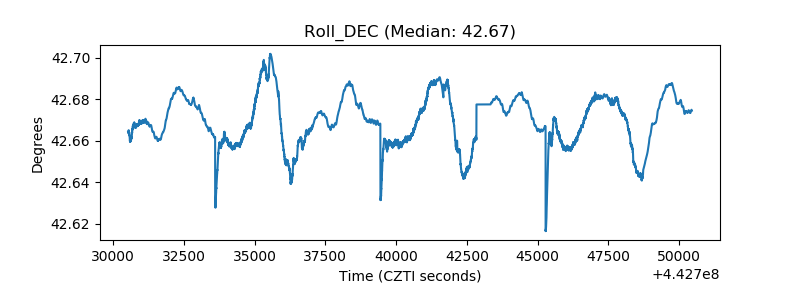 |
| _Roll_RA | 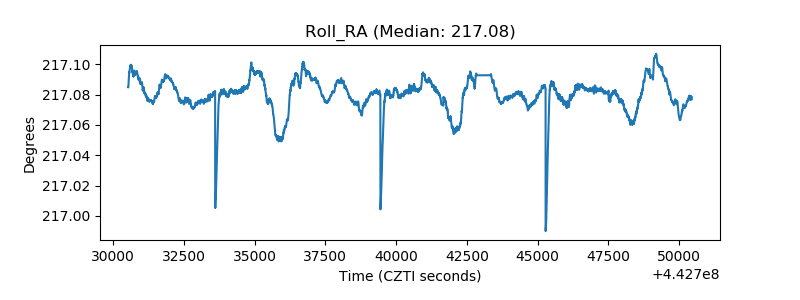 |
| Veto Counter | 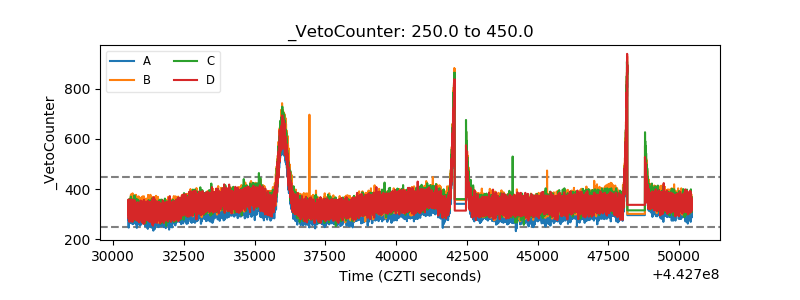 |