| Param | Original file | Final file |
|---|---|---|
| Filename | modeM0/AS1A13_017T01_9000006028_44831cztM0_level2.fits | modeM0/AS1A13_017T01_9000006028_44831cztM0_level2_quad_clean.evt |
| Size (bytes) | 1,795,541,760 | 384,096,960 |
| Size | 1.7 GB | 366.3 MB |
| Events in quadrant A | 17,890,475 | 2,600,097 |
| Events in quadrant B | 12,919,022 | 2,663,287 |
| Events in quadrant C | 14,600,802 | 2,427,188 |
| Events in quadrant D | 19,152,758 | 2,244,451 |
| Mode M0 | |||
|---|---|---|---|
| Quadrant | BADHDUFLAG | Total packets | Discarded packets |
| A | 0 | 74057 | 5 |
| B | 0 | 55608 | 1 |
| C | 0 | 61839 | 2 |
| D | 0 | 74308 | 1 |
| Mode SS | |||
|---|---|---|---|
| Quadrant | BADHDUFLAG | Total packets | Discarded packets |
| A | 0 | 496 | 0 |
| B | 0 | 496 | 0 |
| C | 0 | 496 | 0 |
| D | 0 | 496 | 0 |
| Mode M9 | |||
|---|---|---|---|
| Quadrant | BADHDUFLAG | Total packets | Discarded packets |
| A | 0 | 8 | 0 |
| B | 0 | 8 | 0 |
| C | 0 | 8 | 0 |
| D | 0 | 8 | 0 |
| Quadrant | Total seconds | Saturated seconds | Saturation percentage |
|---|---|---|---|
| A | 24617 | 436 | 1.771134% |
| B | 24620 | 623 | 2.530463% |
| C | 24619 | 1685 | 6.844307% |
| D | 24619 | 1611 | 6.543726% |
Noise dominated data is calculated using 1-second bins in cleaned event files. If a bin has >2000 counts, and if more than 50% of those come from <1% of pixels, then it is considered to be noise-dominated and hence unusable.
| Quadrant | # 1 sec bins | Bins with >0 counts | Bins with >2000 counts | High rate bins dominated by noise | Noise dominated (total time) | Noise dominated (detector-on time) | Marked lightcurve |
|---|---|---|---|---|---|---|---|
| A | 38289 | 24619 | 30 | 30 | 0.08% | 0.12% | 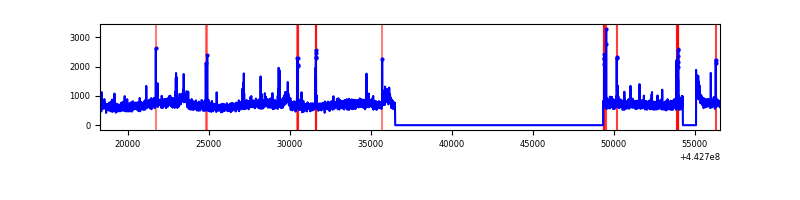 |
| B | 38290 | 24622 | 220 | 220 | 0.57% | 0.89% | 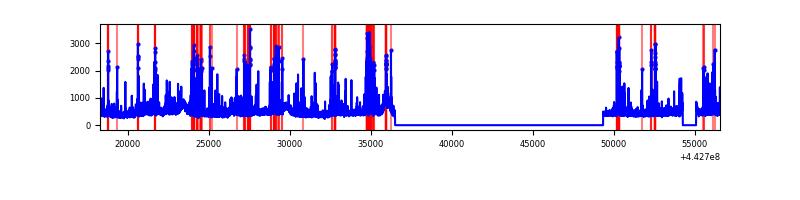 |
| C | 38289 | 24621 | 1281 | 1281 | 3.35% | 5.20% | 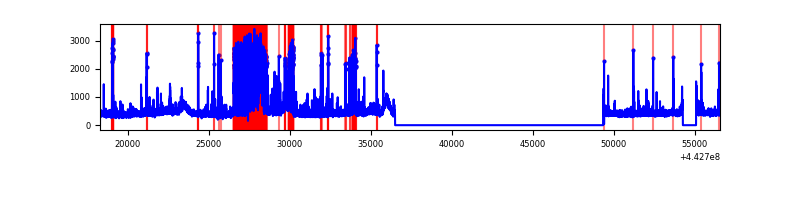 |
| D | 38289 | 24621 | 1299 | 1299 | 3.39% | 5.28% | 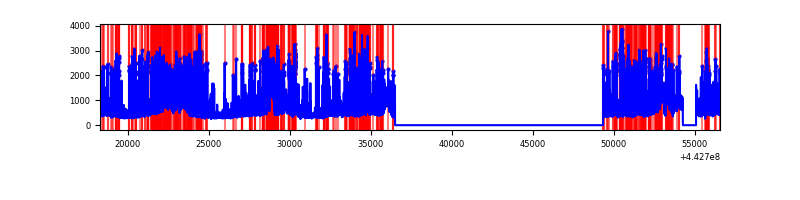 |
Top three noisy pixels from each quadrant. If the there are fewer than three noisy pixels in the level2.evt file, extra rows are filled as -1
| Pixel properties | Quadrant properties | ||||||
|---|---|---|---|---|---|---|---|
| Quadrant | DetID | PixID | Counts | Sigma | Mean | Median | Sigma |
| A | 10 | 83 | 6937427 | 12074.79 | 2757 | 2702 | 574.3 |
| A | 13 | 248 | 173596 | 297.56 | 2757 | 2702 | 574.3 |
| A | 7 | 3 | 56540 | 93.74 | 2757 | 2702 | 574.3 |
| B | 5 | 172 | 626114 | 1151.68 | 2735 | 2646 | 541.4 |
| B | 4 | 171 | 323362 | 592.43 | 2735 | 2646 | 541.4 |
| B | 5 | 255 | 298211 | 545.97 | 2735 | 2646 | 541.4 |
| C | 14 | 254 | 2772677 | 4509.0 | 2619 | 2634 | 614.3 |
| C | 12 | 2 | 1262029 | 2050.01 | 2619 | 2634 | 614.3 |
| C | 15 | 158 | 127510 | 203.27 | 2619 | 2634 | 614.3 |
| D | 1 | 52 | 1608405 | 2437.98 | 2621 | 2539 | 658.7 |
| D | 2 | 249 | 1265128 | 1916.83 | 2621 | 2539 | 658.7 |
| D | 13 | 171 | 1255043 | 1901.51 | 2621 | 2539 | 658.7 |
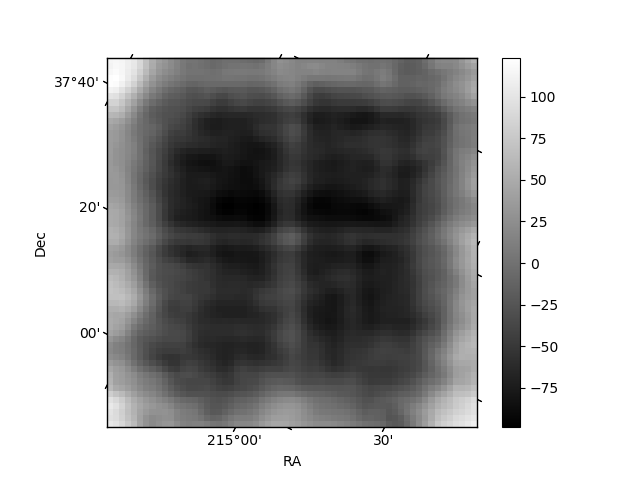
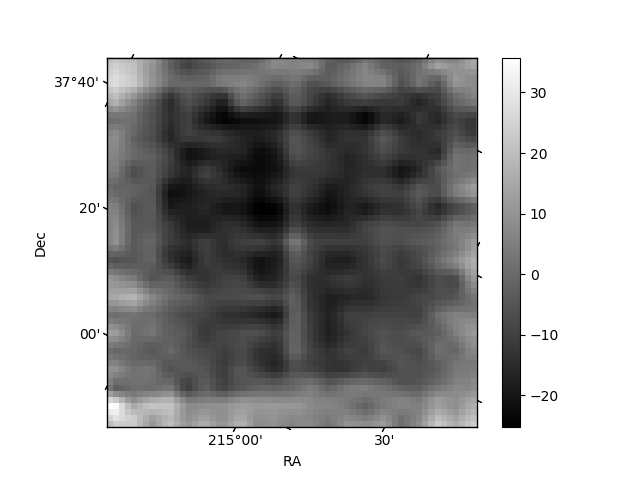
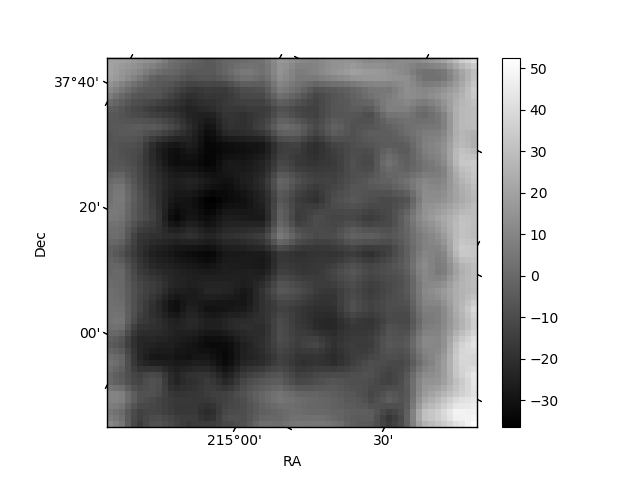
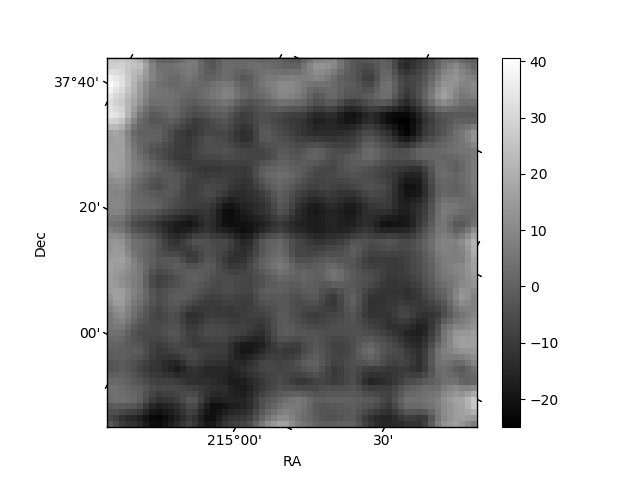
Histogram calculated using DETX and DETY for each event in the final _common_clean file
| Quadrant A | 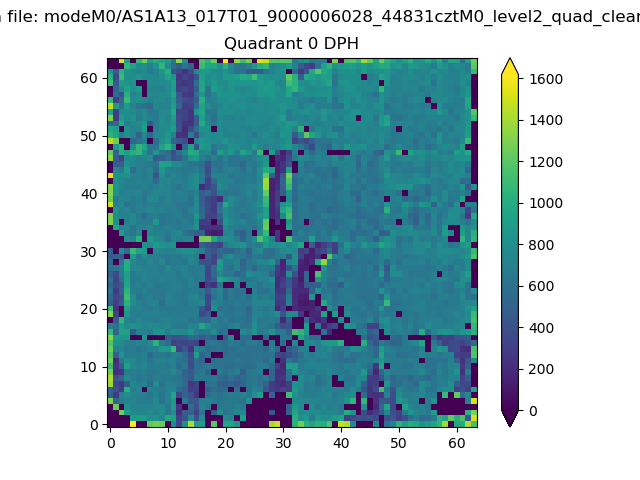 |
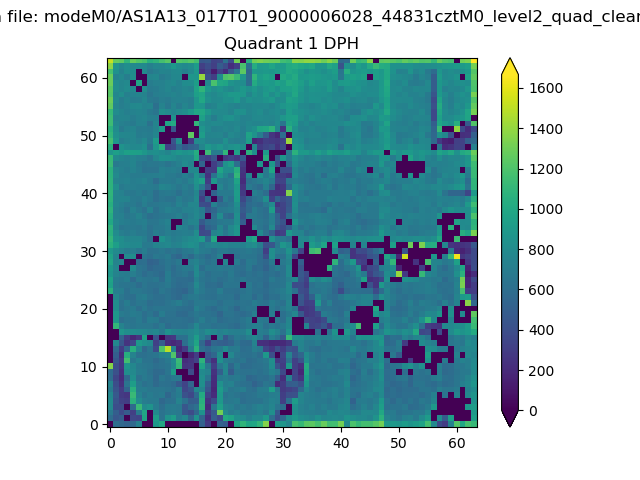 |
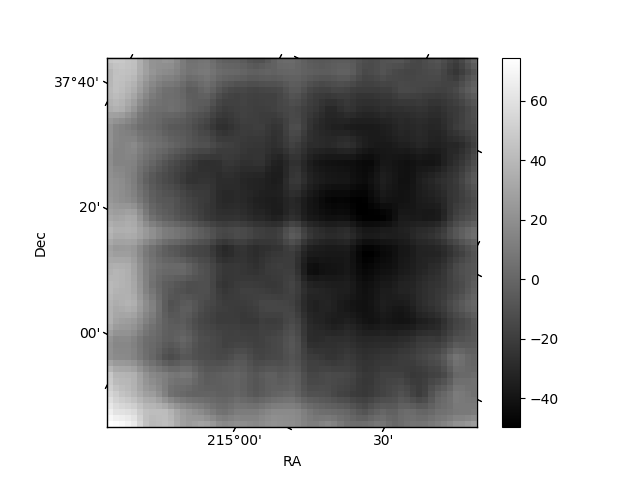
Quadrant B |
|---|---|---|---|
| Quadrant D | 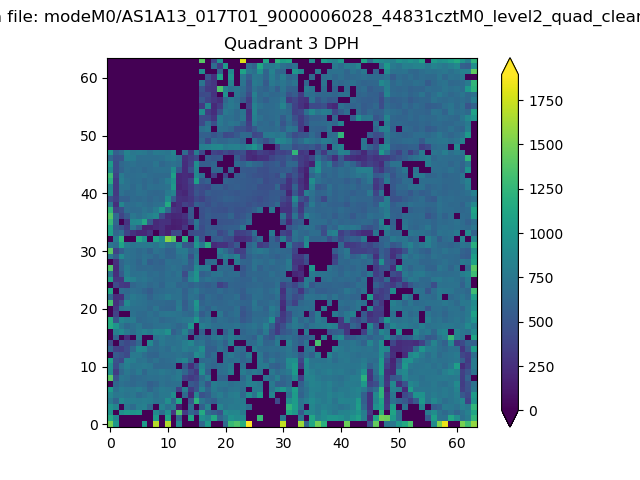 |
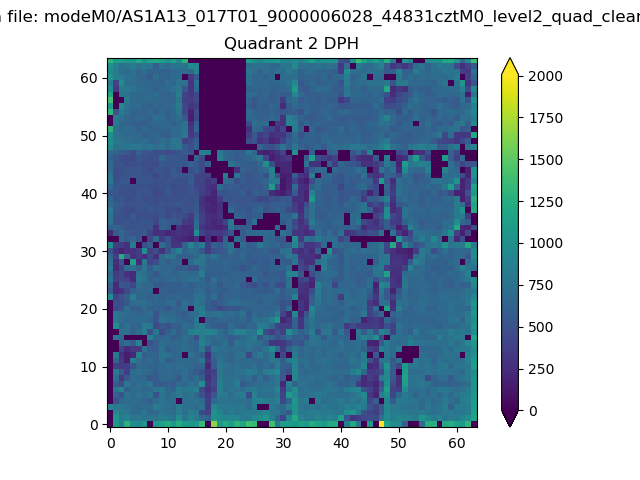 |
Quadrant C |
| Plot type | Count rate plots | Images |
|---|---|---|
| Comparison with Poisson distribution Blue bars denote a histogram of data divided into 1 sec bins. Red curve is a Poisson curve with rate = median count rate of data. |
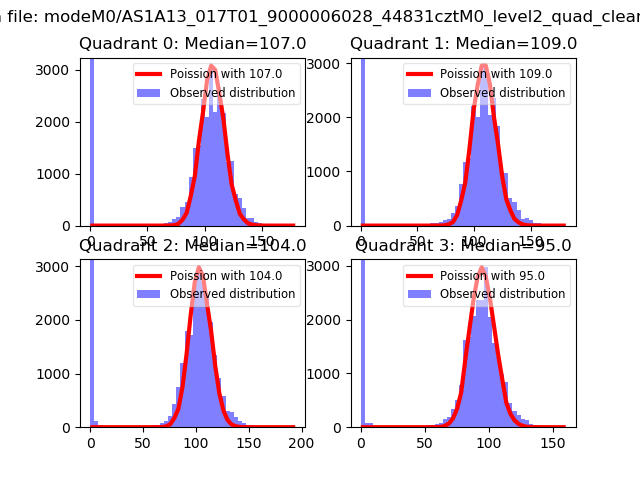 |
 |
| Quadrant-wise count rates Data is divided into 100 sec bins |
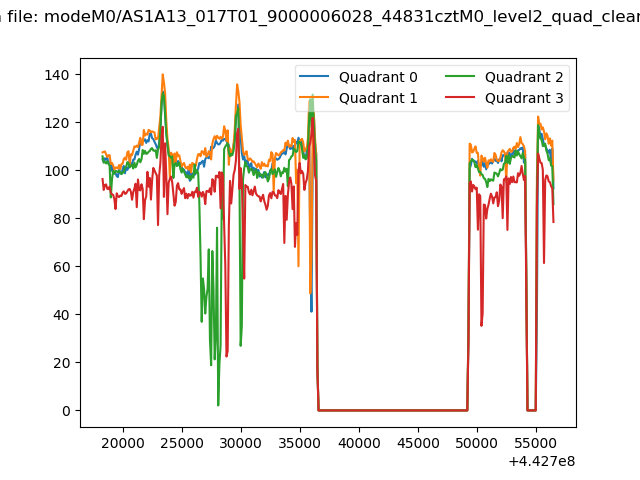 |
|
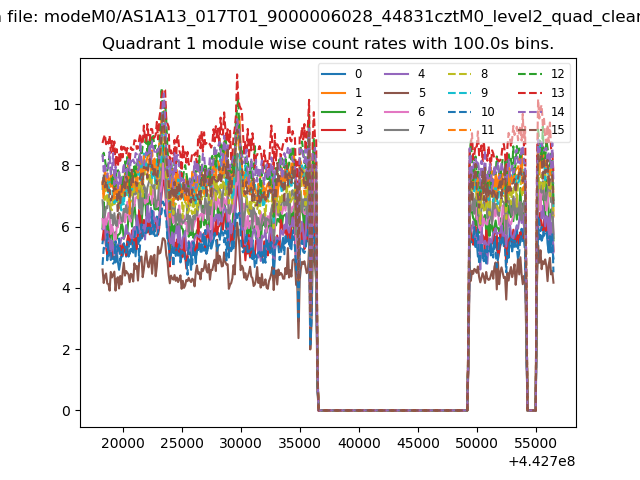
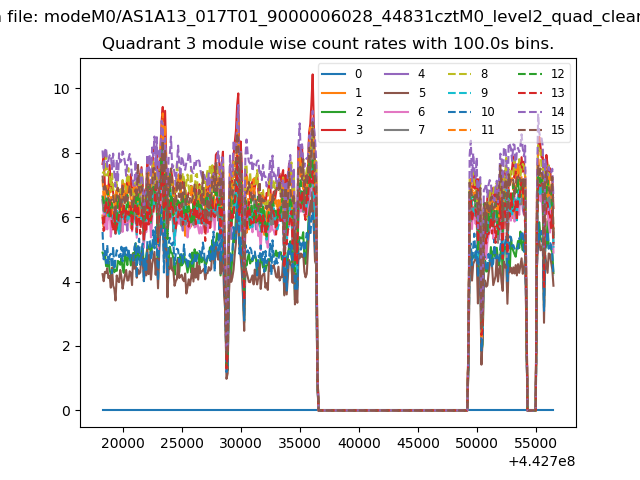
| Module-wise count rates for Quadrant A Data is divided into 100 sec bins |
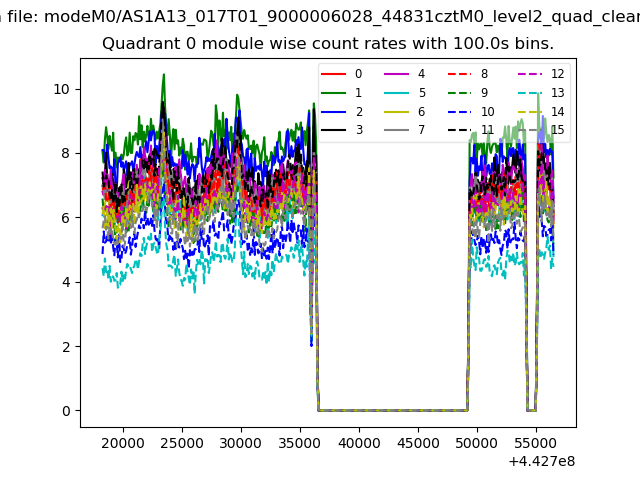 |
 |
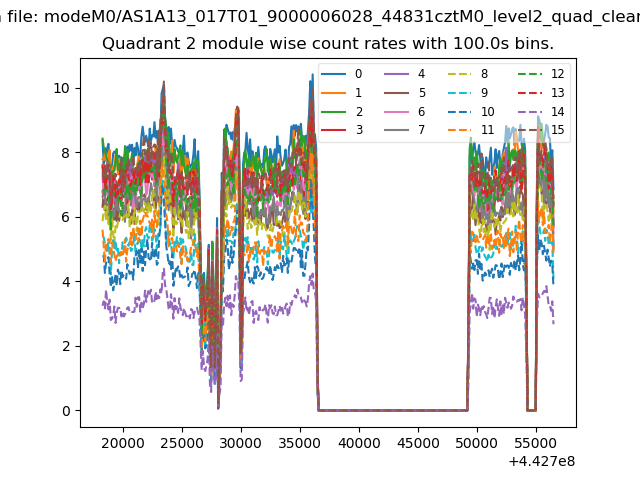
| Module-wise count rates for Quadrant B Data is divided into 100 sec bins |
 |
 |
| Module-wise count rates for Quadrant C Data is divided into 100 sec bins |
 |
 |
| Module-wise count rates for Quadrant D Data is divided into 100 sec bins |
 |
 |
| Parameter | Plot |
|---|---|
| CZT HV Monitor | 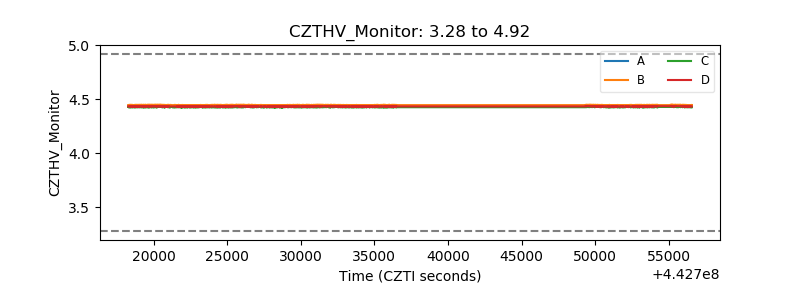 |
| D_VDD | 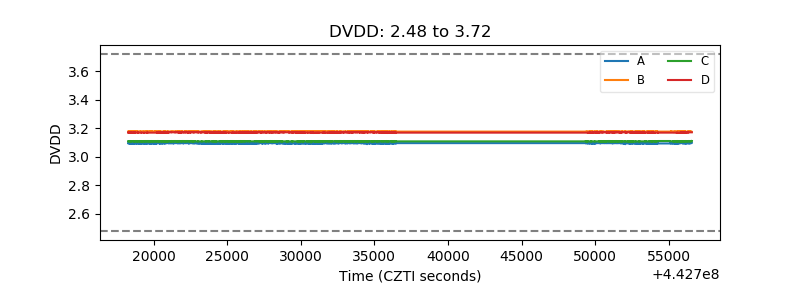 |
| Temperature 1 | 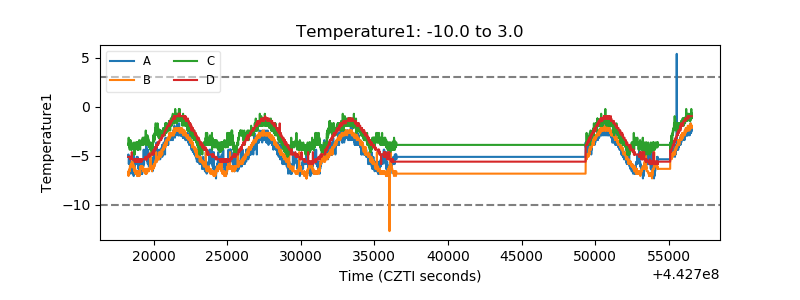 |
| Veto HV Monitor | 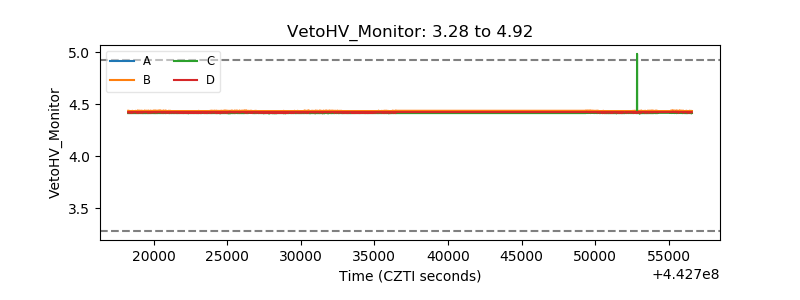 |
| Veto LLD | 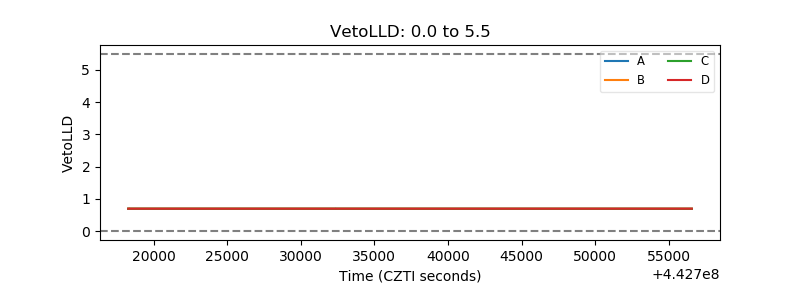 |
| Alpha Counter | 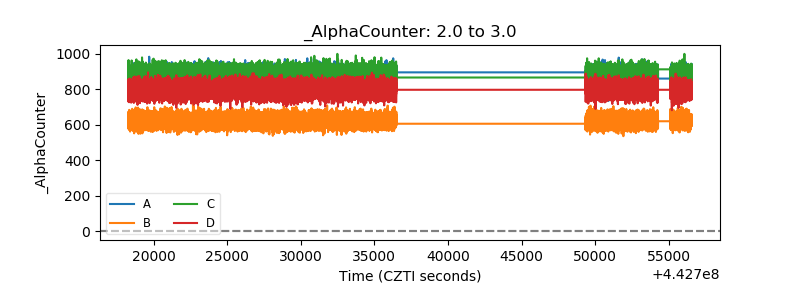 |
| _CPM_Rate | 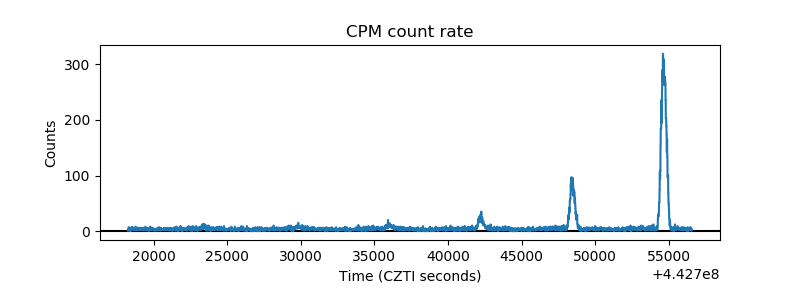 |
| CZT Counter | 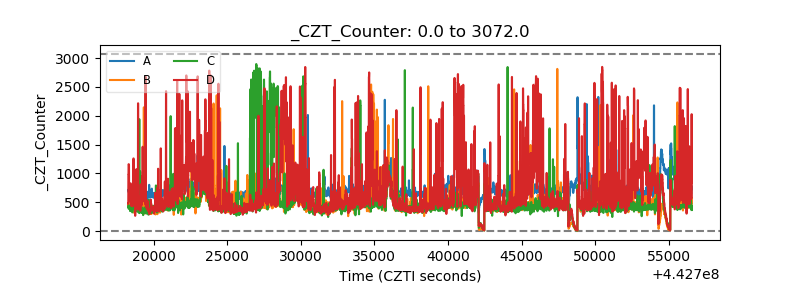 |
| +2.5 Volts monitor | 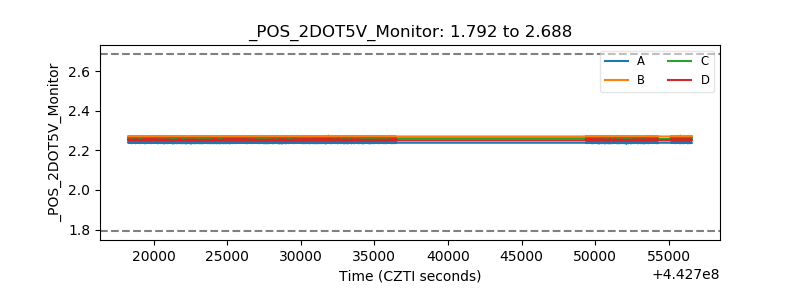 |
| +5 Volts monitor | 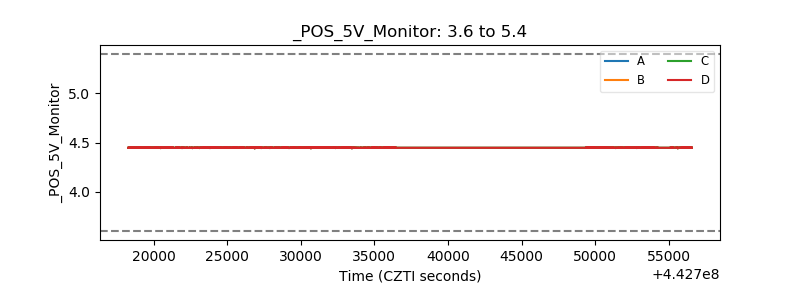 |
| _ROLL_ROT | 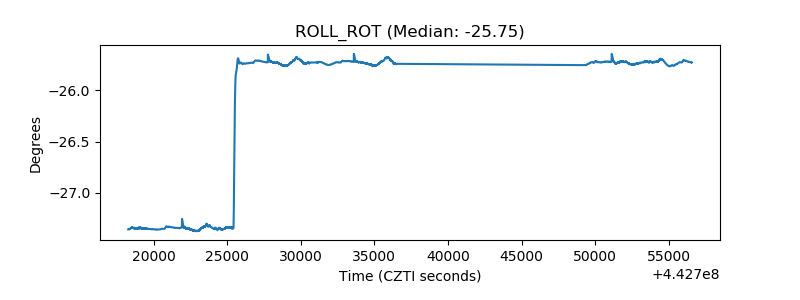 |
| _Roll_DEC | 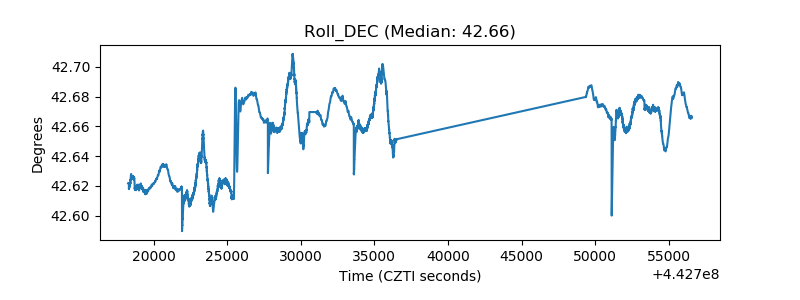 |
| _Roll_RA | 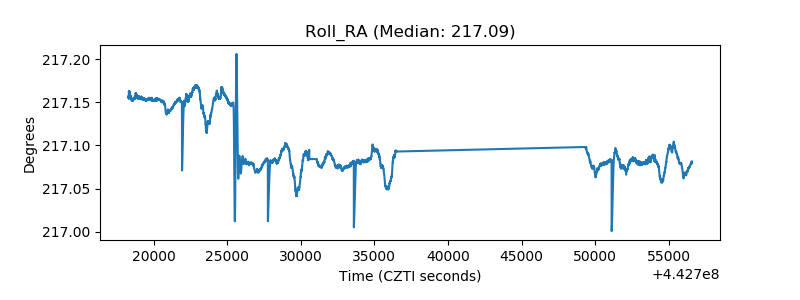 |
| Veto Counter | 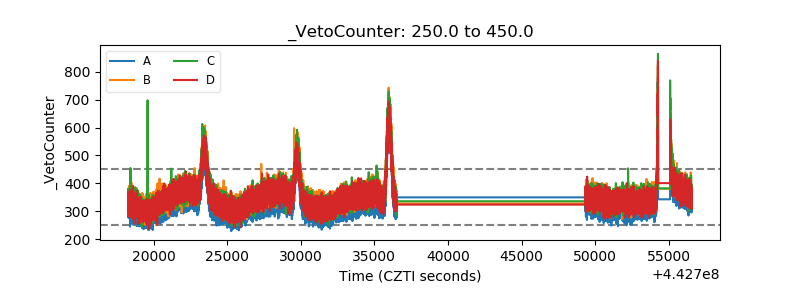 |