| Param | Original file | Final file |
|---|---|---|
| Filename | modeM0/AS1A13_017T01_9000006028_44832cztM0_level2.fits | modeM0/AS1A13_017T01_9000006028_44832cztM0_level2_quad_clean.evt |
| Size (bytes) | 513,904,320 | 107,933,760 |
| Size | 490.1 MB | 102.9 MB |
| Events in quadrant A | 5,413,284 | 721,117 |
| Events in quadrant B | 3,308,511 | 756,281 |
| Events in quadrant C | 3,153,190 | 712,825 |
| Events in quadrant D | 6,628,089 | 610,662 |
| Mode M0 | |||
|---|---|---|---|
| Quadrant | BADHDUFLAG | Total packets | Discarded packets |
| A | 0 | 21534 | 2 |
| B | 0 | 14272 | 2 |
| C | 0 | 14176 | 2 |
| D | 0 | 24275 | 2 |
| Mode SS | |||
|---|---|---|---|
| Quadrant | BADHDUFLAG | Total packets | Discarded packets |
| A | 0 | 136 | 0 |
| B | 0 | 136 | 0 |
| C | 0 | 136 | 0 |
| D | 0 | 136 | 0 |
| Mode M9 | |||
|---|---|---|---|
| Quadrant | BADHDUFLAG | Total packets | Discarded packets |
| A | 0 | 11 | 0 |
| B | 0 | 11 | 0 |
| C | 0 | 12 | 0 |
| D | 0 | 12 | 0 |
| Quadrant | Total seconds | Saturated seconds | Saturation percentage |
|---|---|---|---|
| A | 6703 | 245 | 3.655080% |
| B | 6703 | 102 | 1.521707% |
| C | 6702 | 83 | 1.238436% |
| D | 6702 | 673 | 10.041779% |
Noise dominated data is calculated using 1-second bins in cleaned event files. If a bin has >2000 counts, and if more than 50% of those come from <1% of pixels, then it is considered to be noise-dominated and hence unusable.
| Quadrant | # 1 sec bins | Bins with >0 counts | Bins with >2000 counts | High rate bins dominated by noise | Noise dominated (total time) | Noise dominated (detector-on time) | Marked lightcurve |
|---|---|---|---|---|---|---|---|
| A | 7713 | 6704 | 67 | 67 | 0.87% | 1.00% | 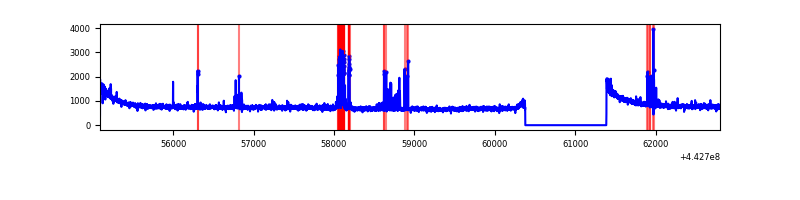 |
| B | 7713 | 6704 | 16 | 16 | 0.21% | 0.24% | 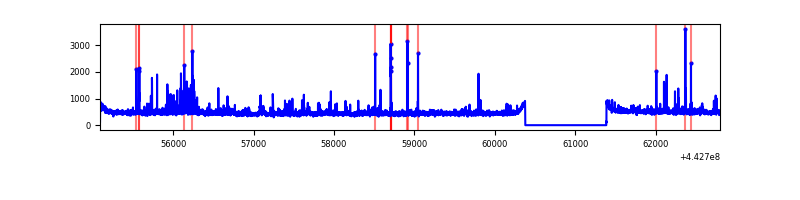 |
| C | 7712 | 6703 | 21 | 21 | 0.27% | 0.31% | 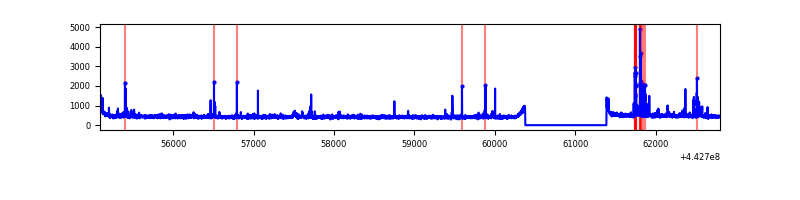 |
| D | 7712 | 6703 | 574 | 574 | 7.44% | 8.56% | 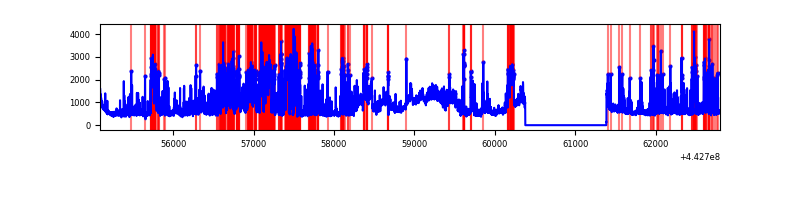 |
Top three noisy pixels from each quadrant. If the there are fewer than three noisy pixels in the level2.evt file, extra rows are filled as -1
| Pixel properties | Quadrant properties | ||||||
|---|---|---|---|---|---|---|---|
| Quadrant | DetID | PixID | Counts | Sigma | Mean | Median | Sigma |
| A | 10 | 83 | 2198119 | 13946.97 | 760 | 743 | 157.6 |
| A | 13 | 248 | 243033 | 1537.84 | 760 | 743 | 157.6 |
| A | 2 | 79 | 17964 | 109.3 | 760 | 743 | 157.6 |
| B | 5 | 172 | 75814 | 497.08 | 758 | 736 | 151.0 |
| B | 0 | 155 | 56221 | 367.36 | 758 | 736 | 151.0 |
| B | 4 | 171 | 52228 | 340.92 | 758 | 736 | 151.0 |
| C | 14 | 254 | 109638 | 623.31 | 744 | 748 | 174.7 |
| C | 3 | 233 | 77442 | 439.01 | 744 | 748 | 174.7 |
| C | 12 | 2 | 31537 | 176.24 | 744 | 748 | 174.7 |
| D | 13 | 187 | 1254728 | 6948.4 | 718 | 695 | 180.5 |
| D | 5 | 235 | 1095552 | 6066.43 | 718 | 695 | 180.5 |
| D | 1 | 52 | 312269 | 1726.38 | 718 | 695 | 180.5 |
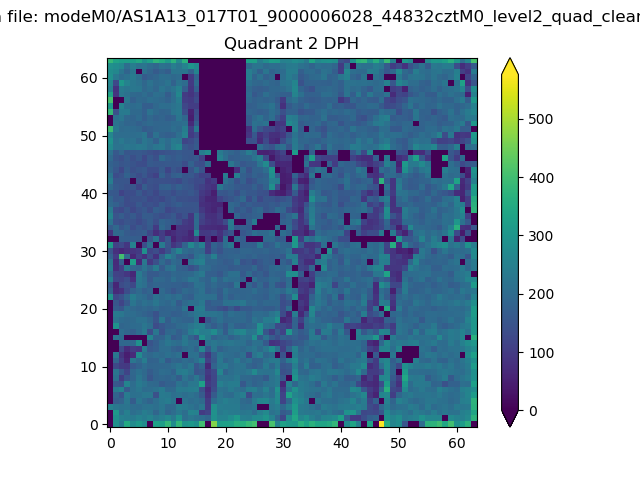
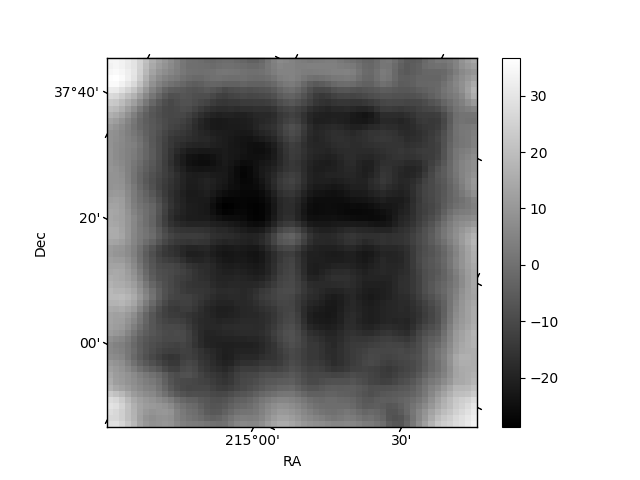
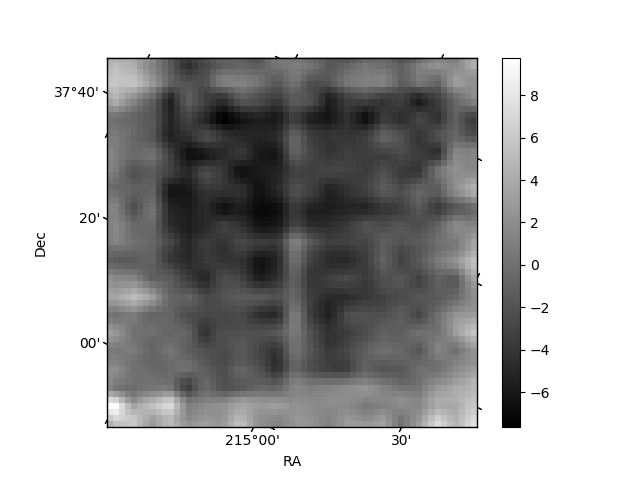
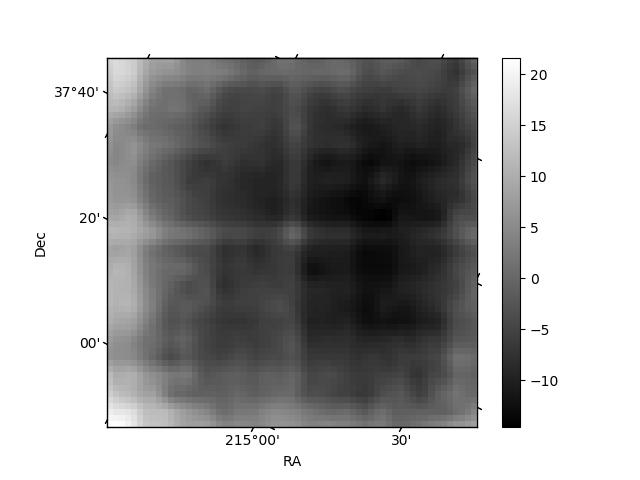
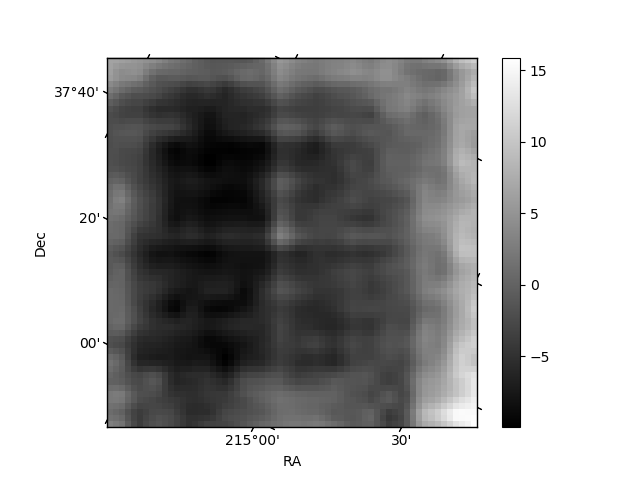
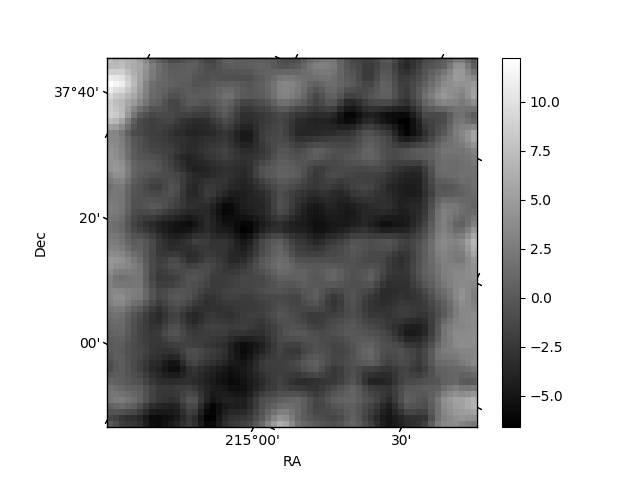
Histogram calculated using DETX and DETY for each event in the final _common_clean file
| Quadrant A | 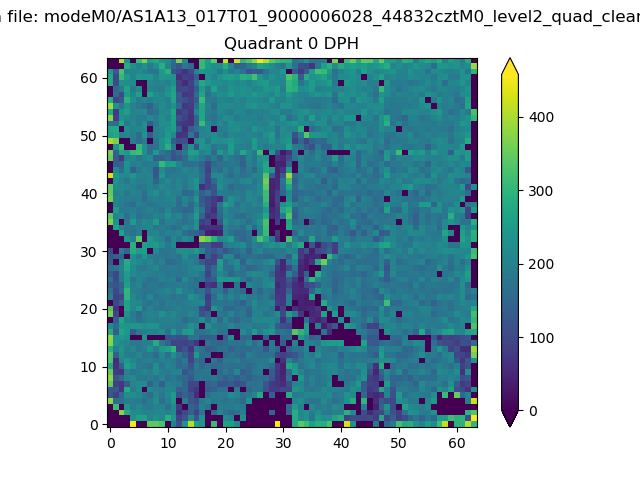 |
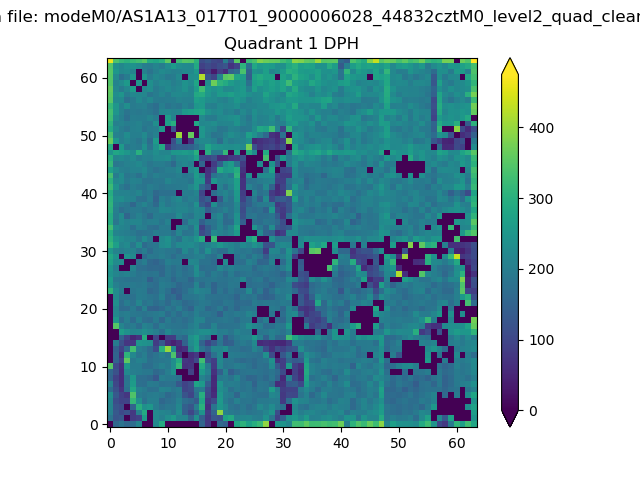 |
Quadrant B |
|---|---|---|---|
| Quadrant D | 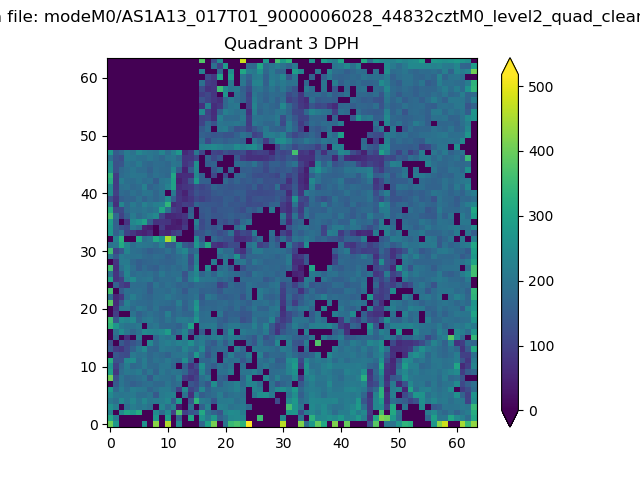 |
 |
Quadrant C |
| Plot type | Count rate plots | Images |
|---|---|---|
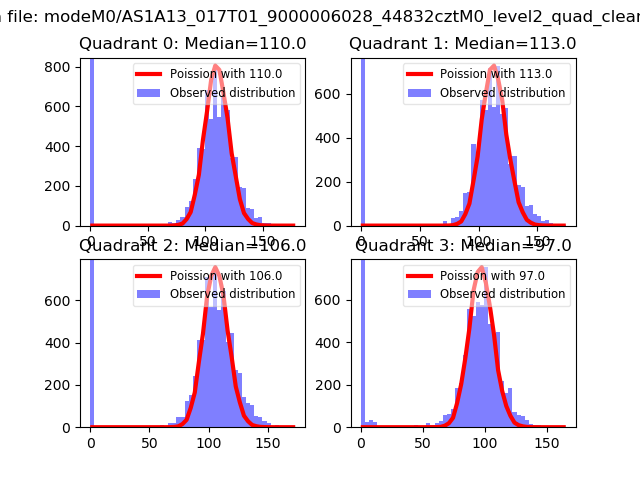
| Comparison with Poisson distribution Blue bars denote a histogram of data divided into 1 sec bins. Red curve is a Poisson curve with rate = median count rate of data. |
 |
 |
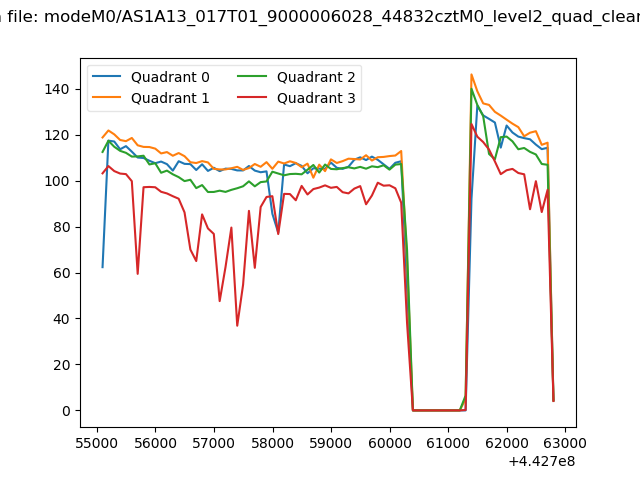
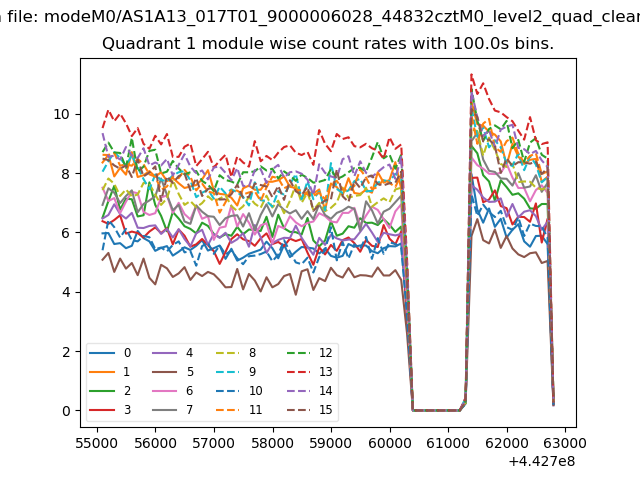
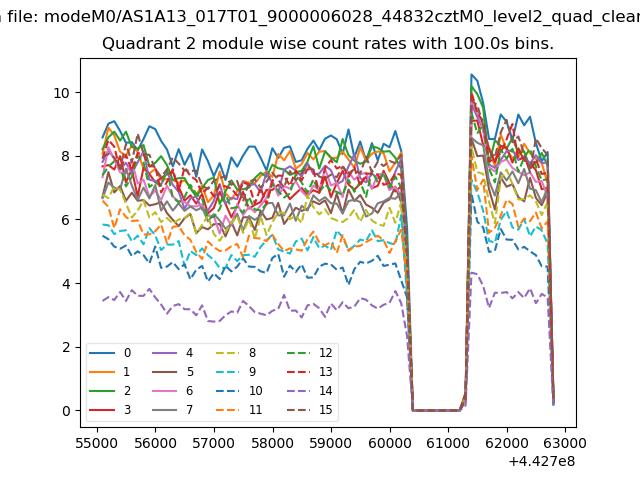
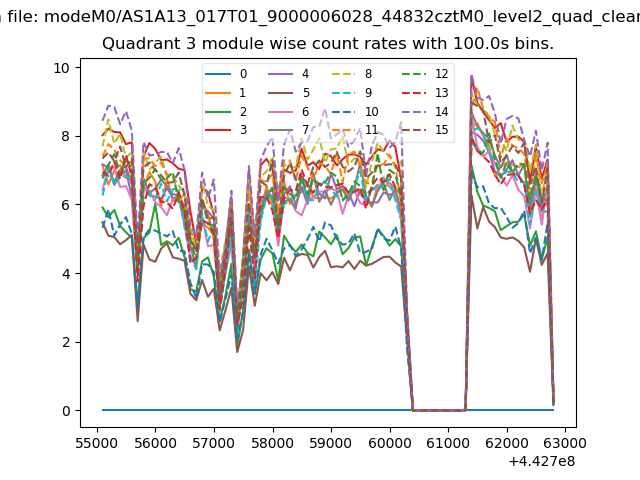
| Quadrant-wise count rates Data is divided into 100 sec bins |
 |
|
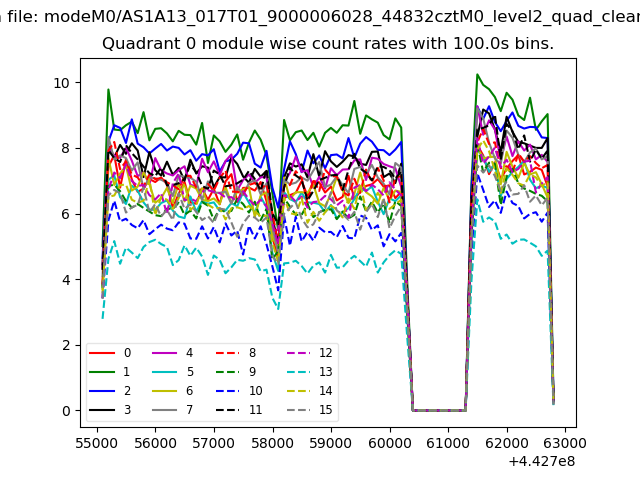
| Module-wise count rates for Quadrant A Data is divided into 100 sec bins |
 |
 |
| Module-wise count rates for Quadrant B Data is divided into 100 sec bins |
 |
 |
| Module-wise count rates for Quadrant C Data is divided into 100 sec bins |
 |
 |
| Module-wise count rates for Quadrant D Data is divided into 100 sec bins |
 |
 |
| Parameter | Plot |
|---|---|
| CZT HV Monitor | 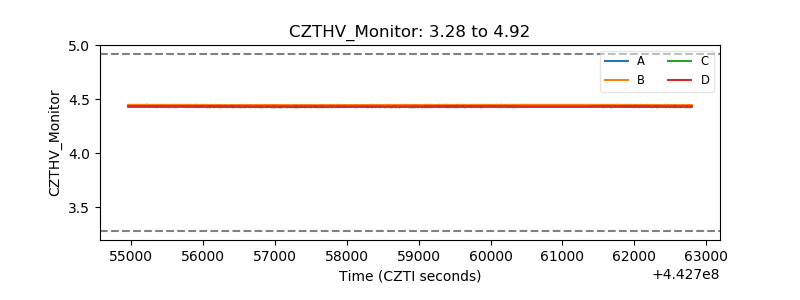 |
| D_VDD | 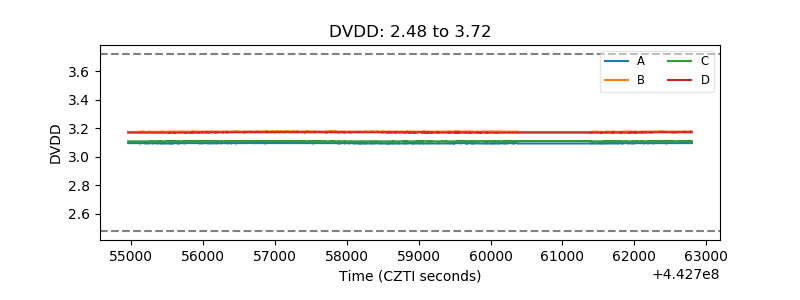 |
| Temperature 1 | 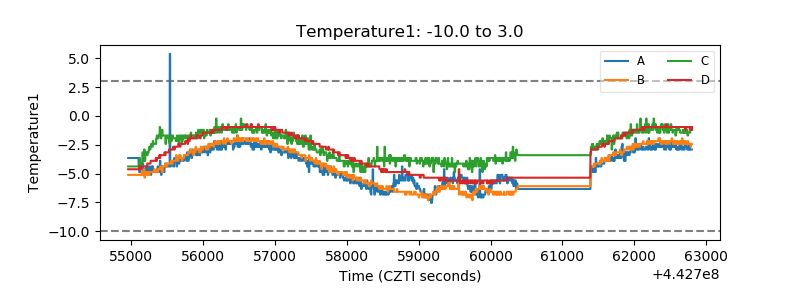 |
| Veto HV Monitor | 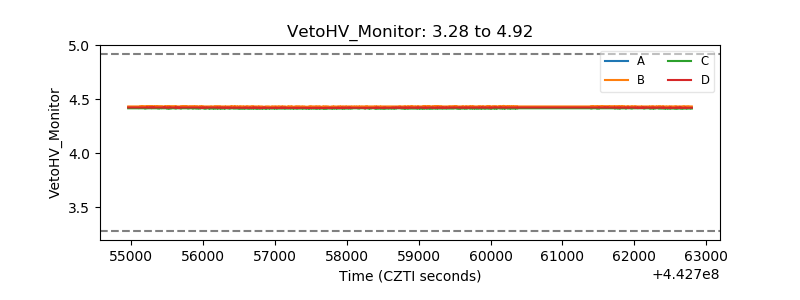 |
| Veto LLD | 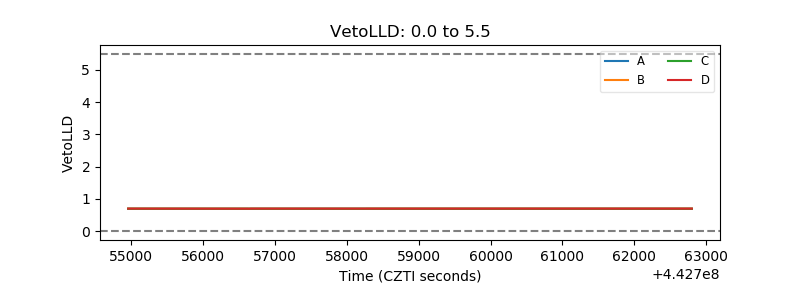 |
| Alpha Counter | 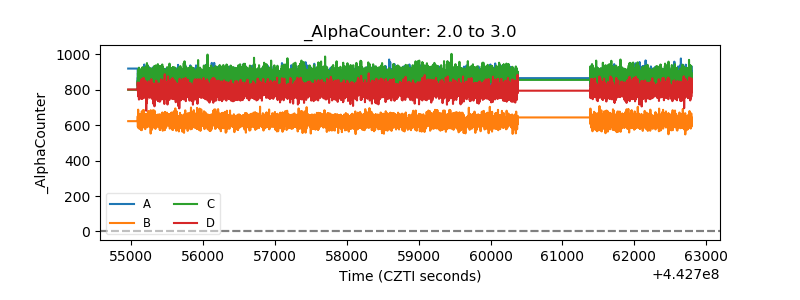 |
| _CPM_Rate | 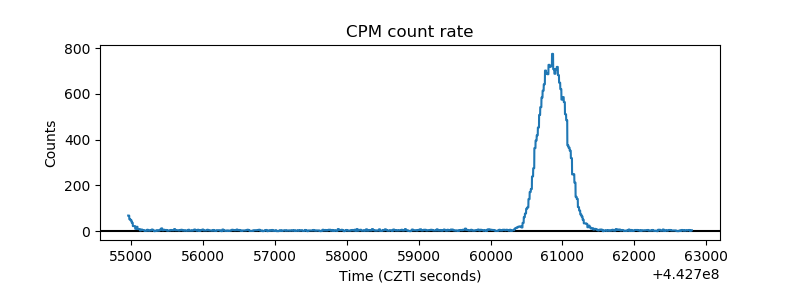 |
| CZT Counter | 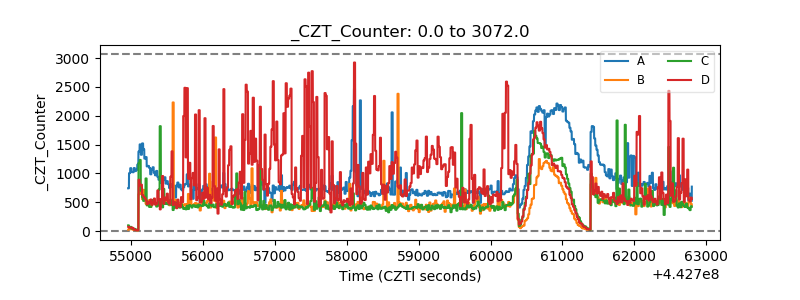 |
| +2.5 Volts monitor | 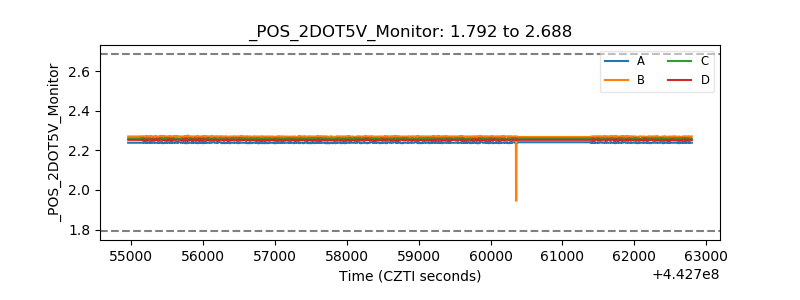 |
| +5 Volts monitor | 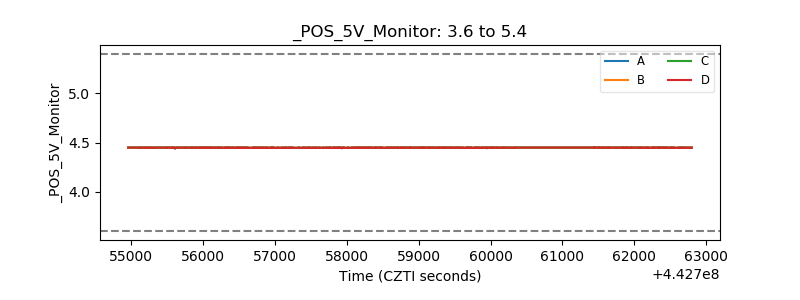 |
| _ROLL_ROT | 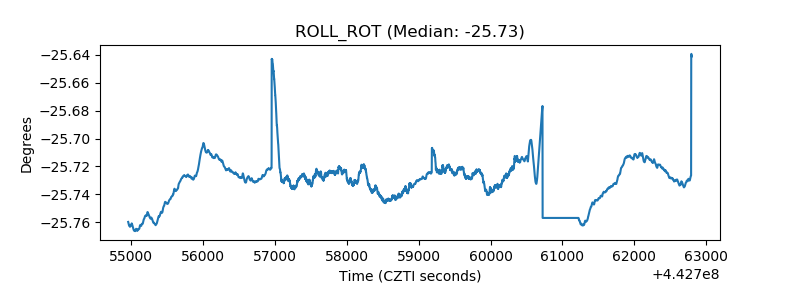 |
| _Roll_DEC | 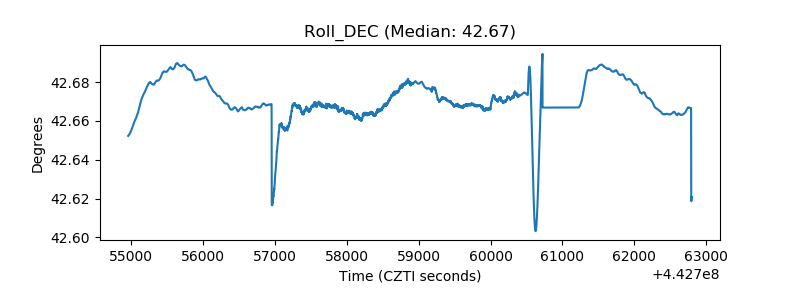 |
| _Roll_RA | 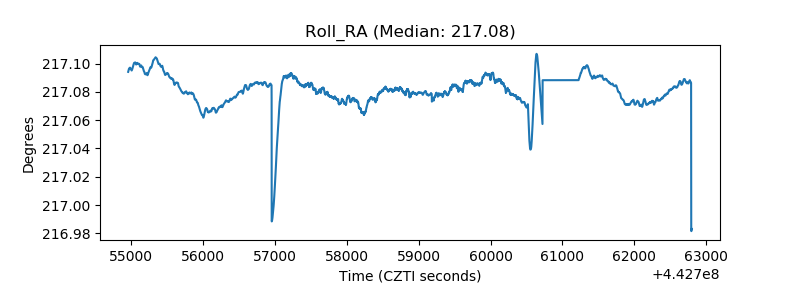 |
| Veto Counter | 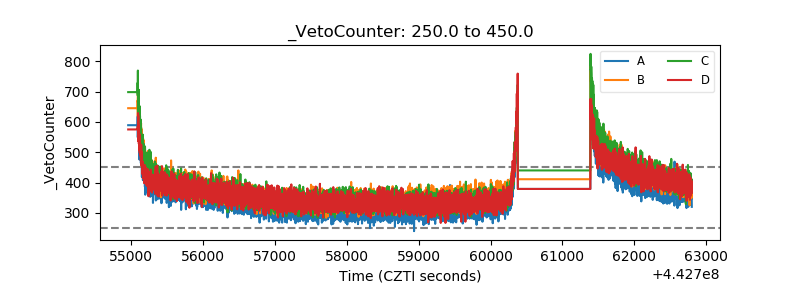 |