| Param | Original file | Final file |
|---|---|---|
| Filename | modeM0/AS1A13_017T01_9000006028_44834cztM0_level2.fits | modeM0/AS1A13_017T01_9000006028_44834cztM0_level2_quad_clean.evt |
| Size (bytes) | 540,633,600 | 112,875,840 |
| Size | 515.6 MB | 107.6 MB |
| Events in quadrant A | 5,328,202 | 766,557 |
| Events in quadrant B | 3,650,549 | 789,880 |
| Events in quadrant C | 3,245,680 | 750,690 |
| Events in quadrant D | 7,272,251 | 646,902 |
| Mode M0 | |||
|---|---|---|---|
| Quadrant | BADHDUFLAG | Total packets | Discarded packets |
| A | 0 | 21220 | 2 |
| B | 0 | 15245 | 2 |
| C | 0 | 14231 | 2 |
| D | 0 | 26175 | 6 |
| Mode SS | |||
|---|---|---|---|
| Quadrant | BADHDUFLAG | Total packets | Discarded packets |
| A | 0 | 134 | 0 |
| B | 0 | 134 | 0 |
| C | 0 | 134 | 0 |
| D | 0 | 134 | 0 |
| Mode M9 | |||
|---|---|---|---|
| Quadrant | BADHDUFLAG | Total packets | Discarded packets |
| A | 0 | 12 | 0 |
| B | 0 | 13 | 0 |
| C | 0 | 13 | 0 |
| D | 0 | 13 | 0 |
| Quadrant | Total seconds | Saturated seconds | Saturation percentage |
|---|---|---|---|
| A | 6657 | 212 | 3.184618% |
| B | 6657 | 173 | 2.598768% |
| C | 6657 | 100 | 1.502178% |
| D | 6656 | 658 | 9.885817% |
Noise dominated data is calculated using 1-second bins in cleaned event files. If a bin has >2000 counts, and if more than 50% of those come from <1% of pixels, then it is considered to be noise-dominated and hence unusable.
| Quadrant | # 1 sec bins | Bins with >0 counts | Bins with >2000 counts | High rate bins dominated by noise | Noise dominated (total time) | Noise dominated (detector-on time) | Marked lightcurve |
|---|---|---|---|---|---|---|---|
| A | 7757 | 6658 | 8 | 8 | 0.10% | 0.12% | 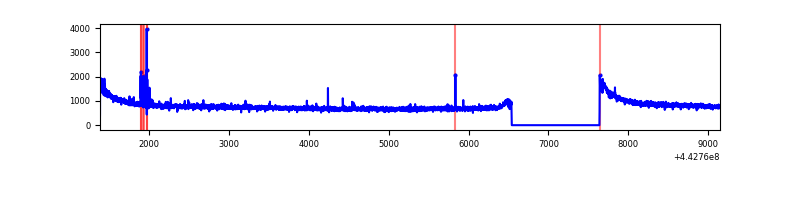 |
| B | 7757 | 6658 | 60 | 60 | 0.77% | 0.90% | 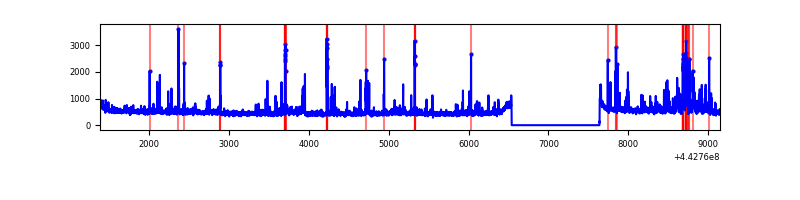 |
| C | 7757 | 6658 | 23 | 23 | 0.30% | 0.35% | 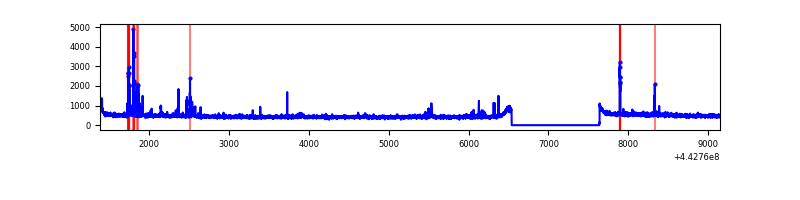 |
| D | 7756 | 6657 | 558 | 558 | 7.19% | 8.38% | 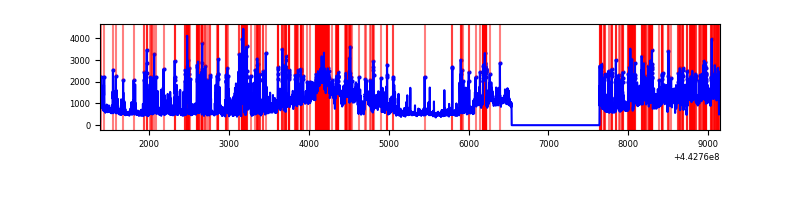 |
Top three noisy pixels from each quadrant. If the there are fewer than three noisy pixels in the level2.evt file, extra rows are filled as -1
| Pixel properties | Quadrant properties | ||||||
|---|---|---|---|---|---|---|---|
| Quadrant | DetID | PixID | Counts | Sigma | Mean | Median | Sigma |
| A | 10 | 83 | 2224579 | 13615.51 | 786 | 770 | 163.3 |
| A | 13 | 248 | 40676 | 244.33 | 786 | 770 | 163.3 |
| A | 2 | 79 | 12701 | 73.05 | 786 | 770 | 163.3 |
| B | 0 | 186 | 141459 | 903.46 | 781 | 758 | 155.7 |
| B | 0 | 155 | 112405 | 716.9 | 781 | 758 | 155.7 |
| B | 0 | 219 | 78351 | 498.23 | 781 | 758 | 155.7 |
| C | 14 | 254 | 122070 | 671.1 | 772 | 776 | 180.7 |
| C | 3 | 233 | 60921 | 332.77 | 772 | 776 | 180.7 |
| C | 12 | 2 | 26111 | 140.18 | 772 | 776 | 180.7 |
| D | 13 | 187 | 2631279 | 14130.92 | 747 | 726 | 186.2 |
| D | 5 | 235 | 502905 | 2697.63 | 747 | 726 | 186.2 |
| D | 8 | 129 | 435218 | 2334.02 | 747 | 726 | 186.2 |
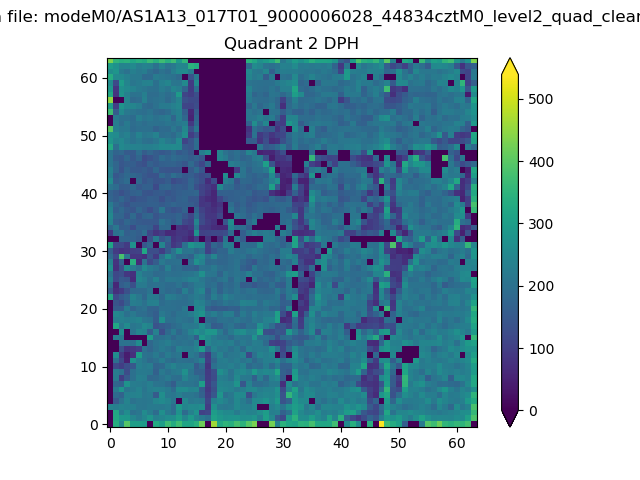
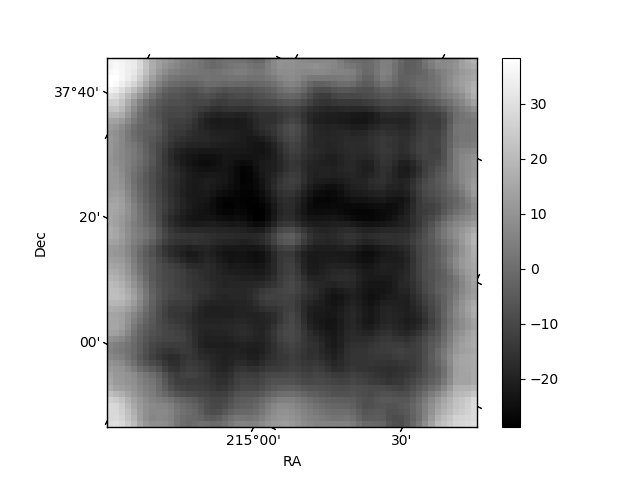
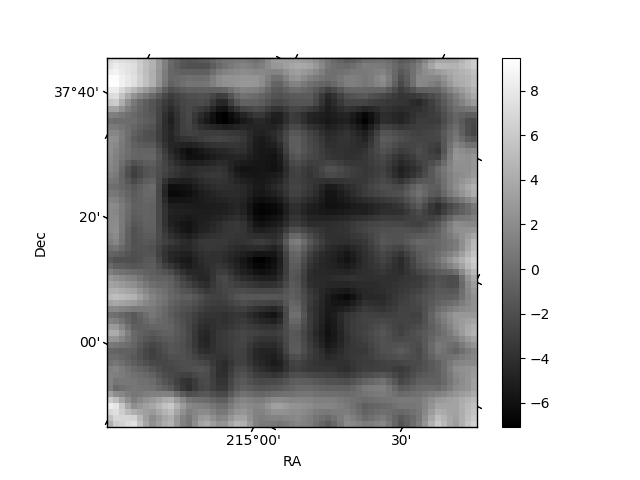
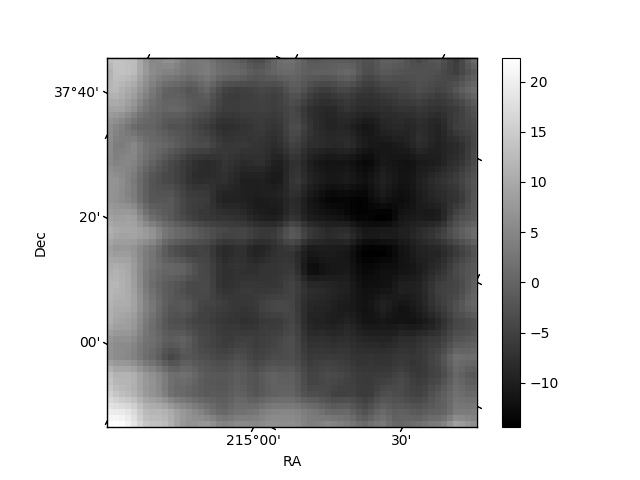
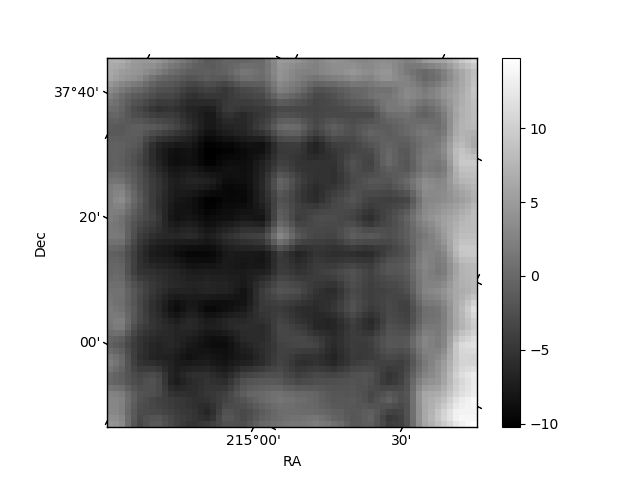
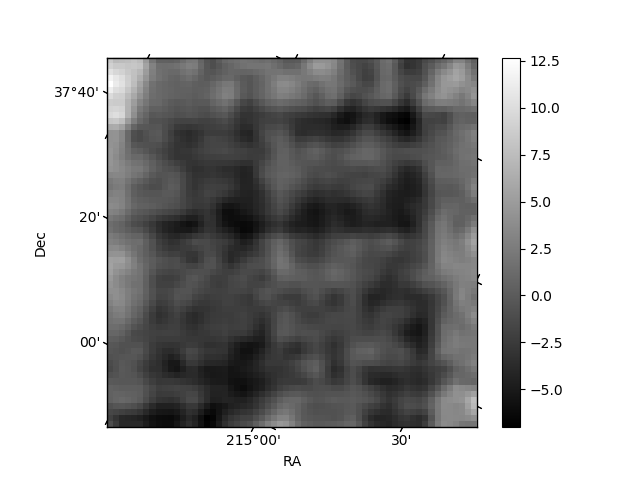
Histogram calculated using DETX and DETY for each event in the final _common_clean file
| Quadrant A | 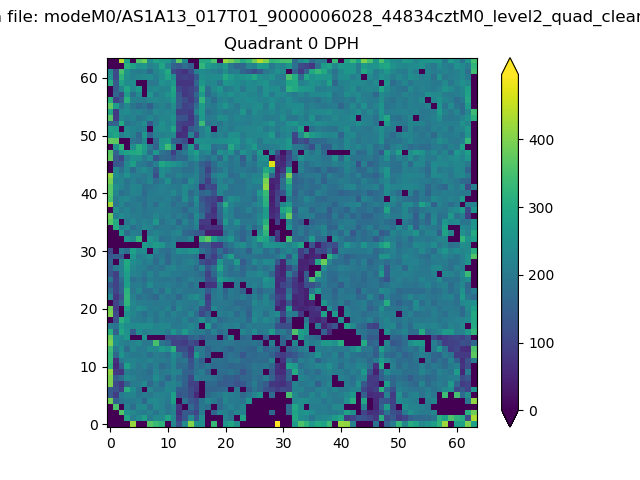 |
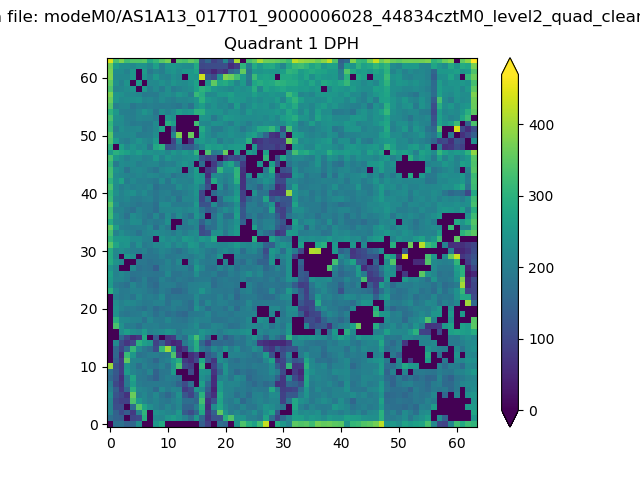 |
Quadrant B |
|---|---|---|---|
| Quadrant D | 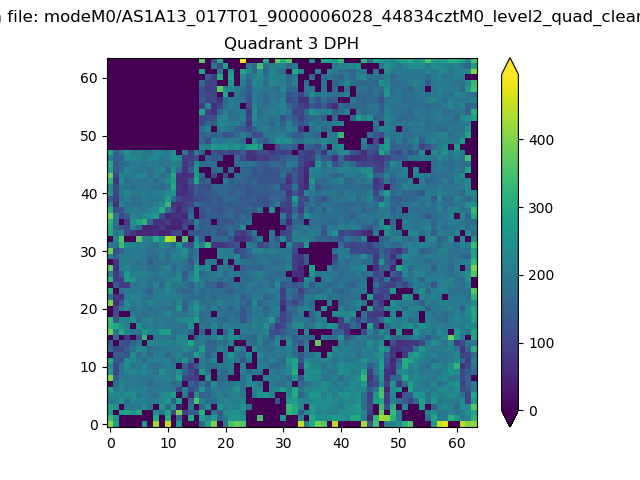 |
 |
Quadrant C |
| Plot type | Count rate plots | Images |
|---|---|---|
| Comparison with Poisson distribution Blue bars denote a histogram of data divided into 1 sec bins. Red curve is a Poisson curve with rate = median count rate of data. |
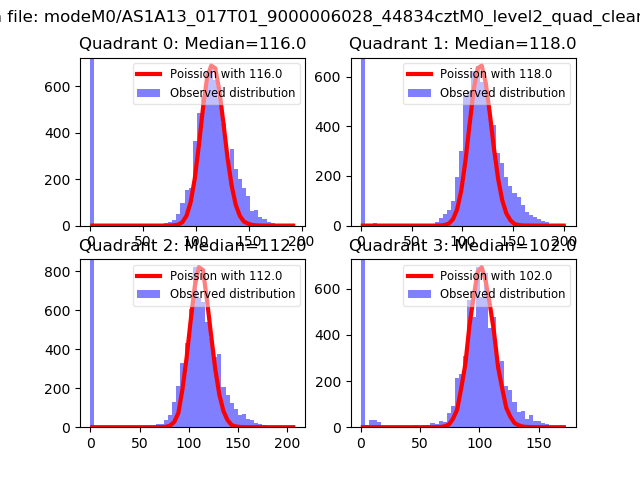 |
 |
| Quadrant-wise count rates Data is divided into 100 sec bins |
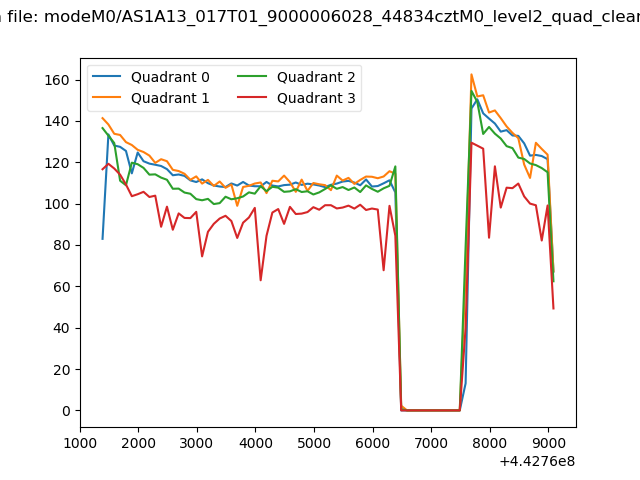 |
|
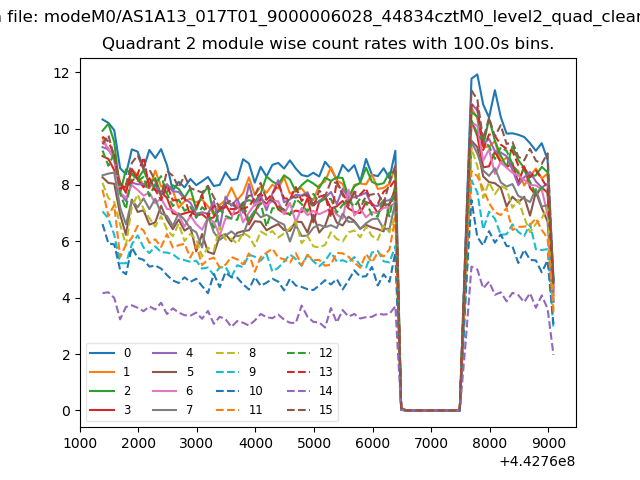
| Module-wise count rates for Quadrant A Data is divided into 100 sec bins |
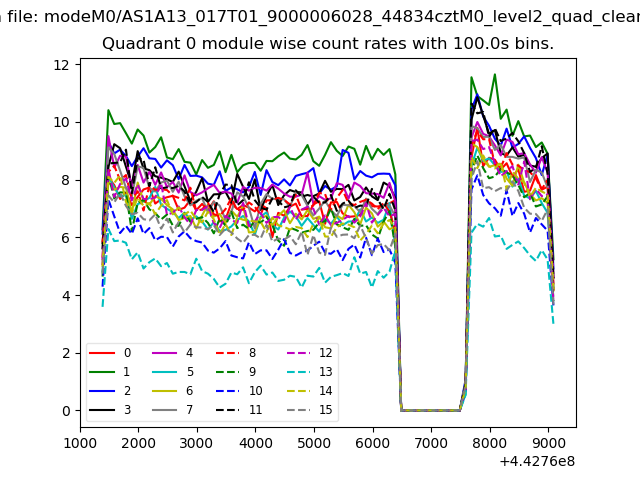 |
 |
| Module-wise count rates for Quadrant B Data is divided into 100 sec bins |
 |
 |
| Module-wise count rates for Quadrant C Data is divided into 100 sec bins |
 |
 |
| Module-wise count rates for Quadrant D Data is divided into 100 sec bins |
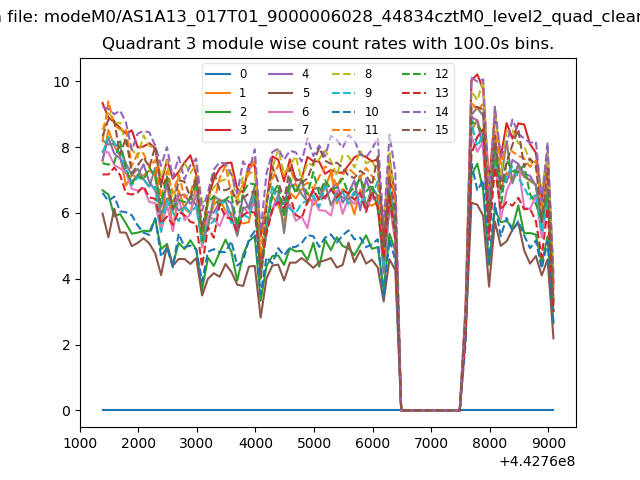 |
 |
| Parameter | Plot |
|---|---|
| CZT HV Monitor | 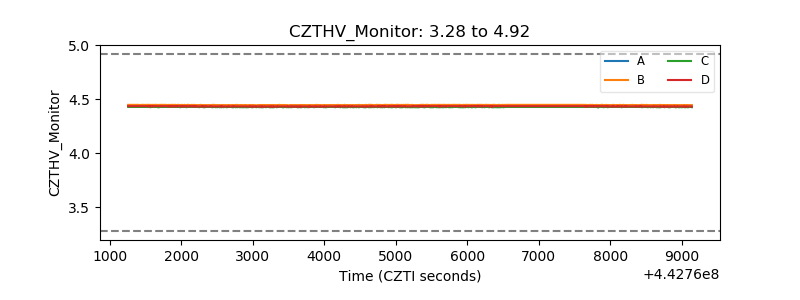 |
| D_VDD | 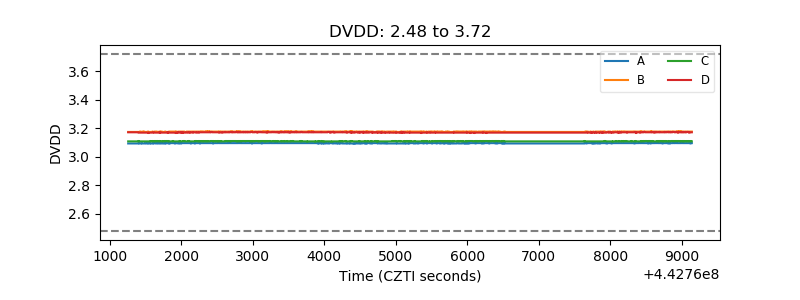 |
| Temperature 1 | 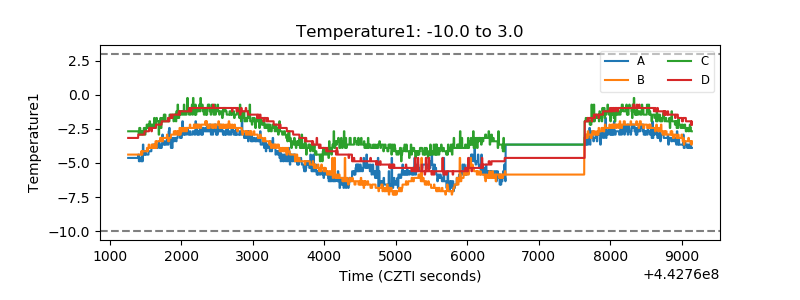 |
| Veto HV Monitor | 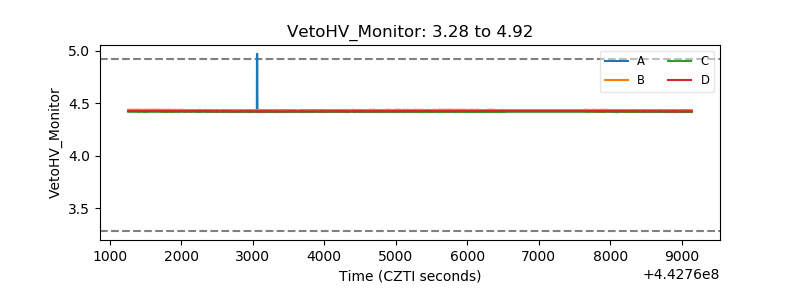 |
| Veto LLD | 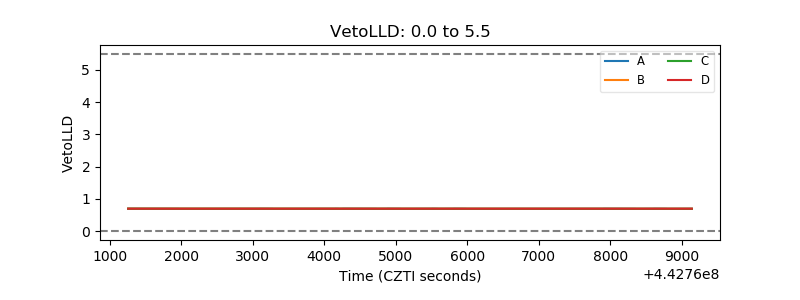 |
| Alpha Counter | 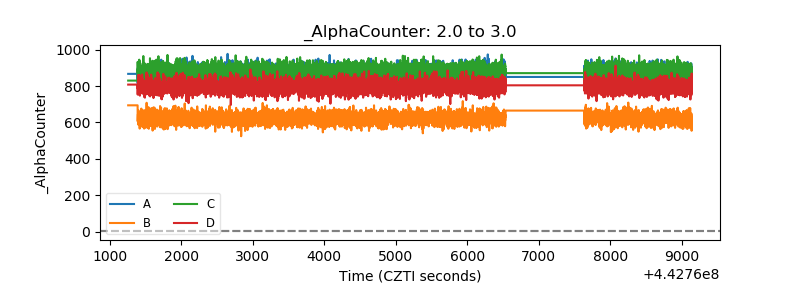 |
| _CPM_Rate | 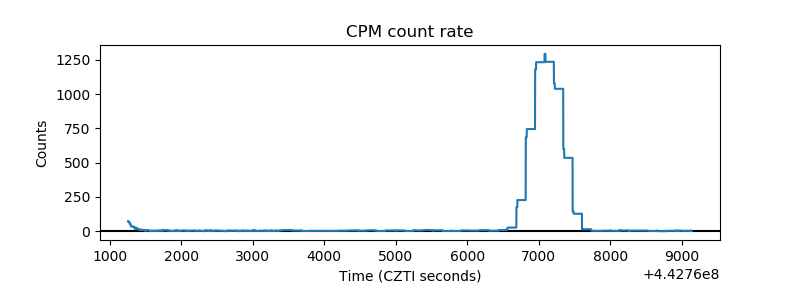 |
| CZT Counter | 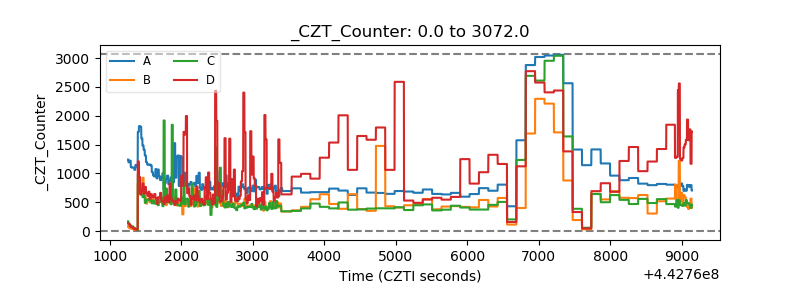 |
| +2.5 Volts monitor | 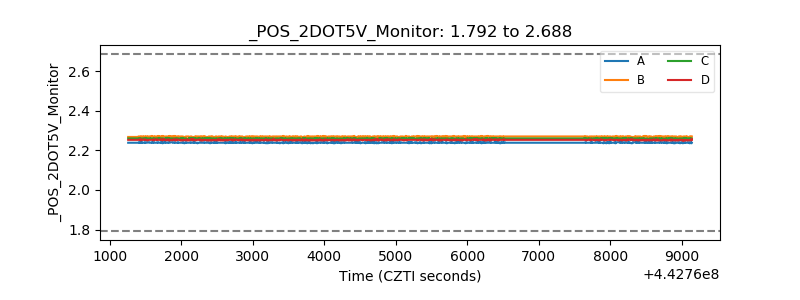 |
| +5 Volts monitor | 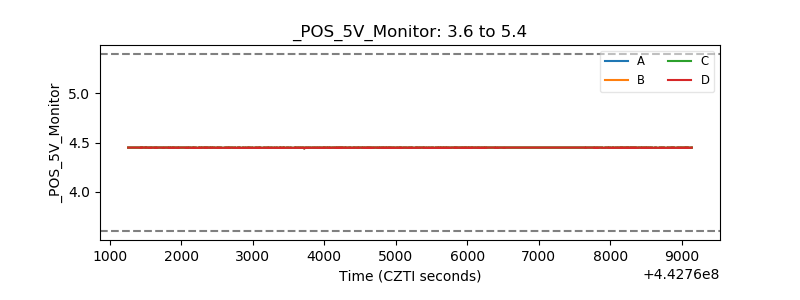 |
| _ROLL_ROT | 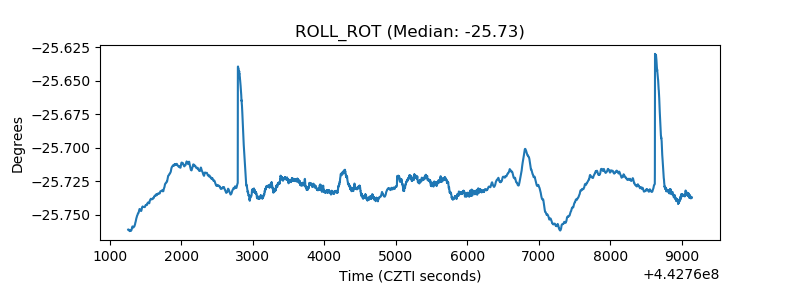 |
| _Roll_DEC | 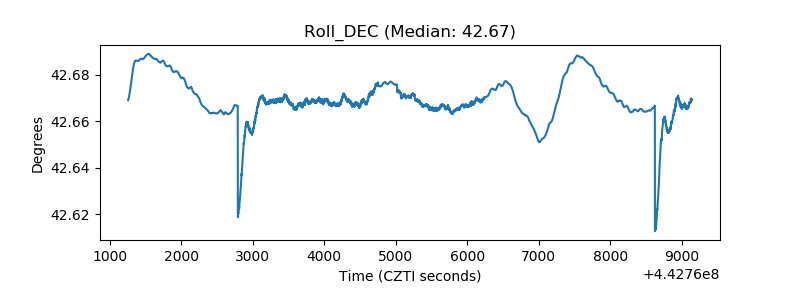 |
| _Roll_RA | 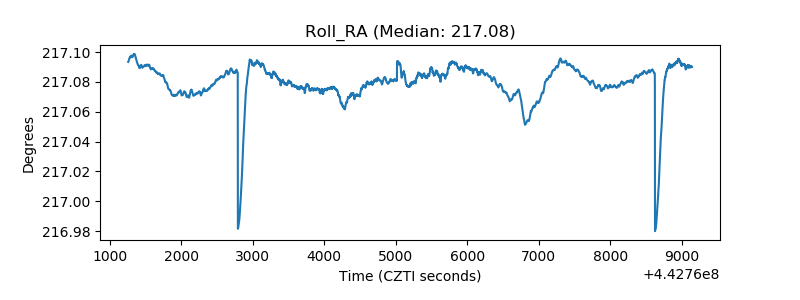 |
| Veto Counter | 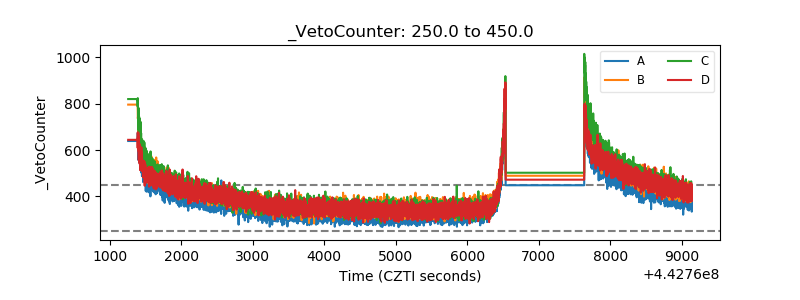 |