| Param | Original file | Final file |
|---|---|---|
| Filename | modeM0/AS1A13_017T01_9000006028_44835cztM0_level2.fits | modeM0/AS1A13_017T01_9000006028_44835cztM0_level2_quad_clean.evt |
| Size (bytes) | 557,328,960 | 116,956,800 |
| Size | 531.5 MB | 111.5 MB |
| Events in quadrant A | 5,316,643 | 799,277 |
| Events in quadrant B | 3,678,171 | 831,574 |
| Events in quadrant C | 3,734,124 | 772,350 |
| Events in quadrant D | 7,391,372 | 678,980 |
| Mode M0 | |||
|---|---|---|---|
| Quadrant | BADHDUFLAG | Total packets | Discarded packets |
| A | 0 | 21090 | 2 |
| B | 0 | 15374 | 2 |
| C | 0 | 15550 | 2 |
| D | 0 | 26657 | 2 |
| Mode SS | |||
|---|---|---|---|
| Quadrant | BADHDUFLAG | Total packets | Discarded packets |
| A | 0 | 134 | 0 |
| B | 0 | 134 | 0 |
| C | 0 | 134 | 0 |
| D | 0 | 134 | 0 |
| Mode M9 | |||
|---|---|---|---|
| Quadrant | BADHDUFLAG | Total packets | Discarded packets |
| A | 0 | 12 | 0 |
| B | 0 | 12 | 0 |
| C | 0 | 12 | 0 |
| D | 0 | 12 | 0 |
| Quadrant | Total seconds | Saturated seconds | Saturation percentage |
|---|---|---|---|
| A | 6586 | 205 | 3.112663% |
| B | 6586 | 159 | 2.414212% |
| C | 6587 | 268 | 4.068620% |
| D | 6586 | 693 | 10.522320% |
Noise dominated data is calculated using 1-second bins in cleaned event files. If a bin has >2000 counts, and if more than 50% of those come from <1% of pixels, then it is considered to be noise-dominated and hence unusable.
| Quadrant | # 1 sec bins | Bins with >0 counts | Bins with >2000 counts | High rate bins dominated by noise | Noise dominated (total time) | Noise dominated (detector-on time) | Marked lightcurve |
|---|---|---|---|---|---|---|---|
| A | 7781 | 6587 | 8 | 8 | 0.10% | 0.12% | 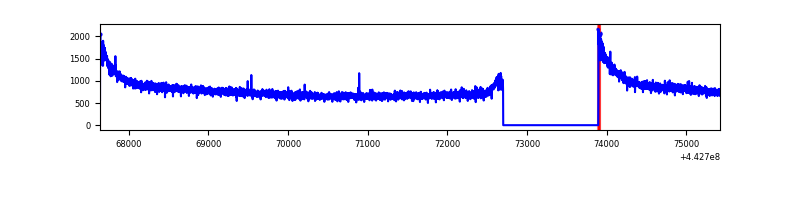 |
| B | 7781 | 6587 | 50 | 50 | 0.64% | 0.76% | 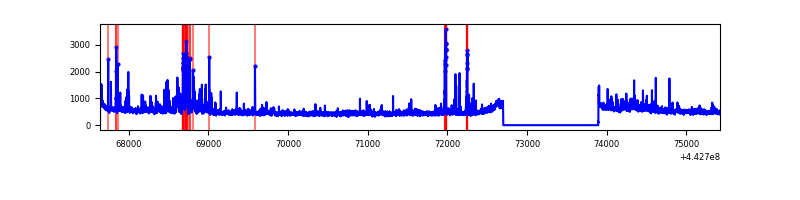 |
| C | 7782 | 6588 | 162 | 162 | 2.08% | 2.46% | 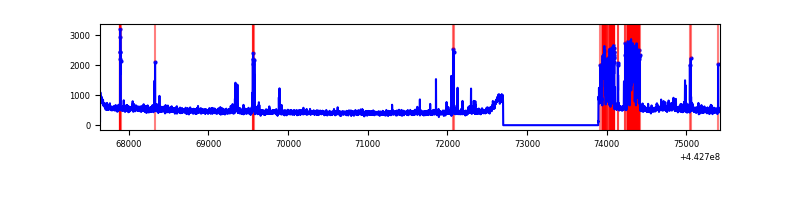 |
| D | 7781 | 6587 | 554 | 554 | 7.12% | 8.41% | 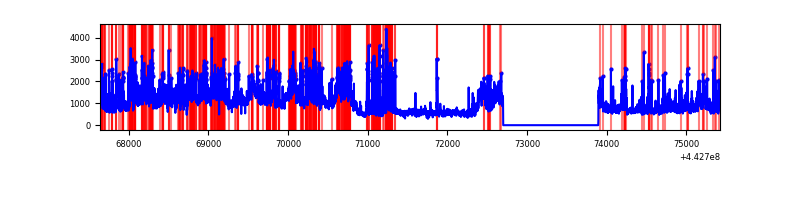 |
Top three noisy pixels from each quadrant. If the there are fewer than three noisy pixels in the level2.evt file, extra rows are filled as -1
| Pixel properties | Quadrant properties | ||||||
|---|---|---|---|---|---|---|---|
| Quadrant | DetID | PixID | Counts | Sigma | Mean | Median | Sigma |
| A | 10 | 83 | 2204231 | 13167.48 | 804 | 788 | 167.3 |
| A | 3 | 137 | 8558 | 46.43 | 804 | 788 | 167.3 |
| A | 13 | 254 | 7715 | 41.39 | 804 | 788 | 167.3 |
| B | 0 | 186 | 151752 | 962.36 | 800 | 776 | 156.9 |
| B | 0 | 155 | 111644 | 706.7 | 800 | 776 | 156.9 |
| B | 5 | 255 | 105827 | 669.62 | 800 | 776 | 156.9 |
| C | 3 | 233 | 497793 | 2701.83 | 791 | 796 | 183.9 |
| C | 14 | 254 | 55651 | 298.21 | 791 | 796 | 183.9 |
| C | 9 | 54 | 45812 | 244.72 | 791 | 796 | 183.9 |
| D | 13 | 187 | 2277622 | 11989.88 | 767 | 746 | 189.9 |
| D | 5 | 235 | 661483 | 3479.4 | 767 | 746 | 189.9 |
| D | 7 | 38 | 236883 | 1243.48 | 767 | 746 | 189.9 |
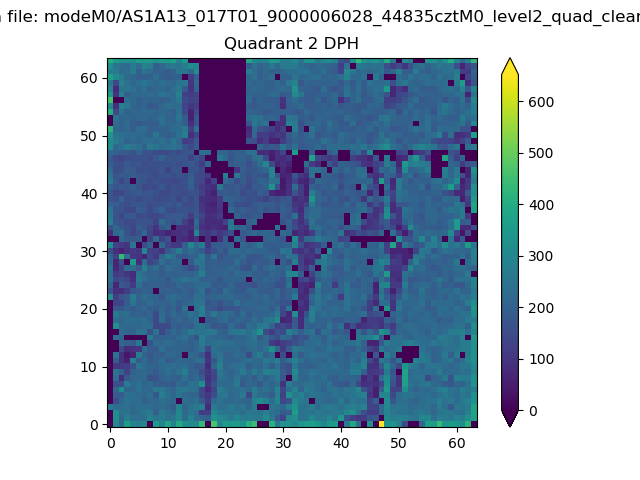
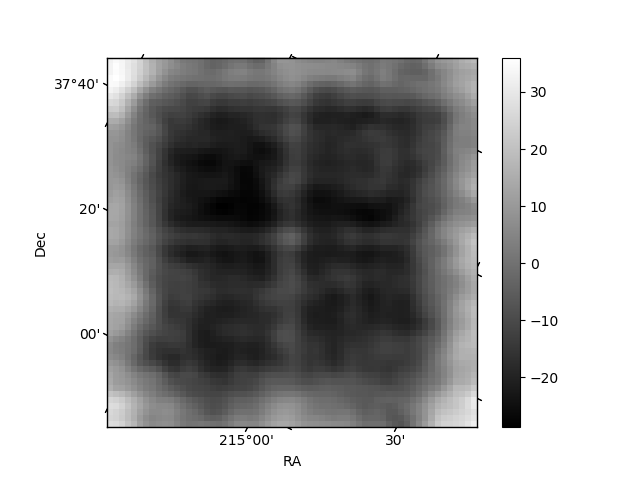
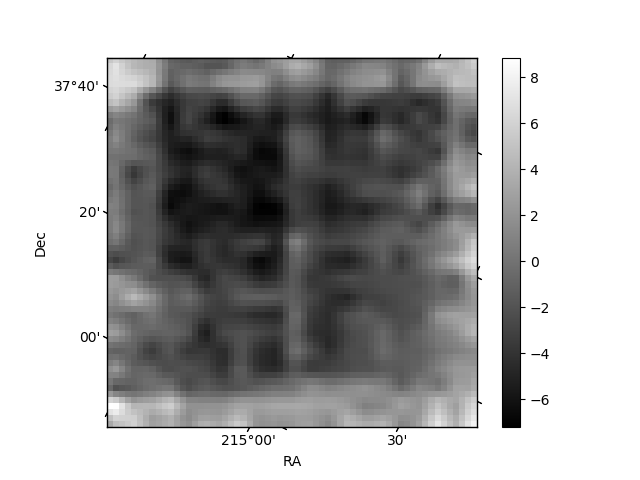
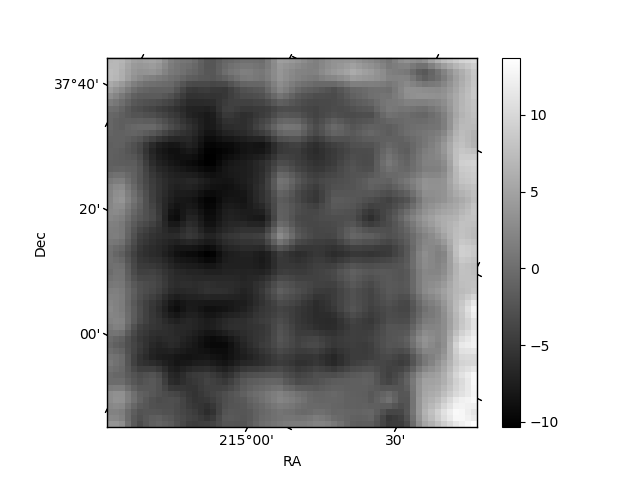
Histogram calculated using DETX and DETY for each event in the final _common_clean file
| Quadrant A | 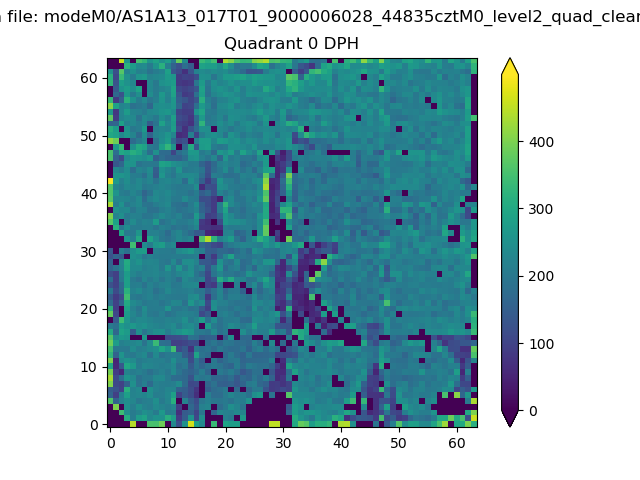 |
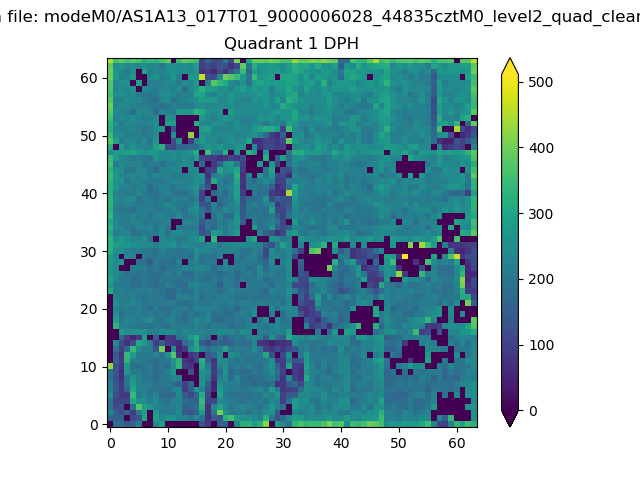 |
Quadrant B |
|---|---|---|---|
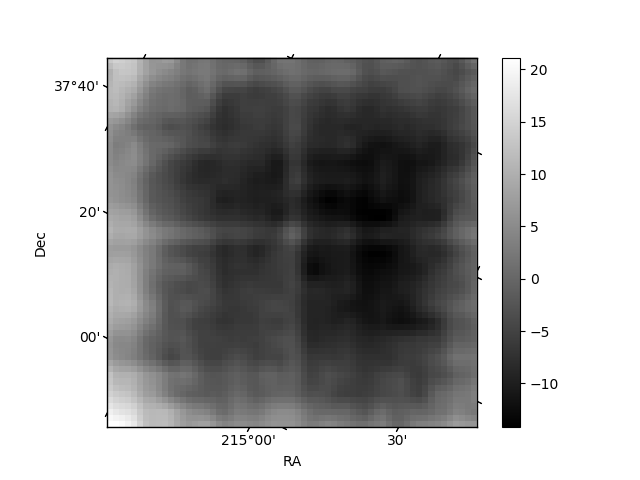
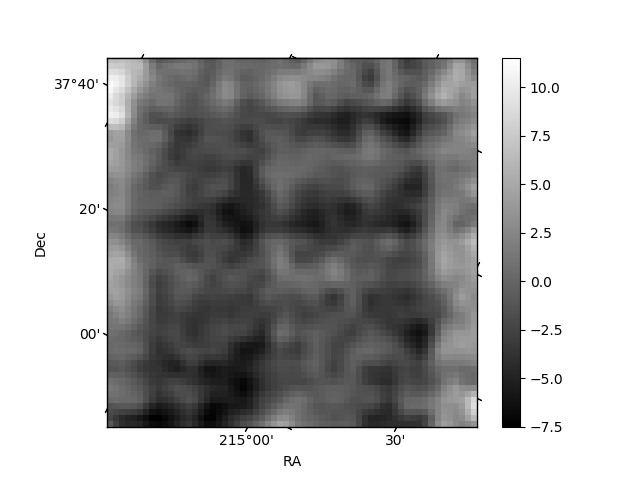
| Quadrant D | 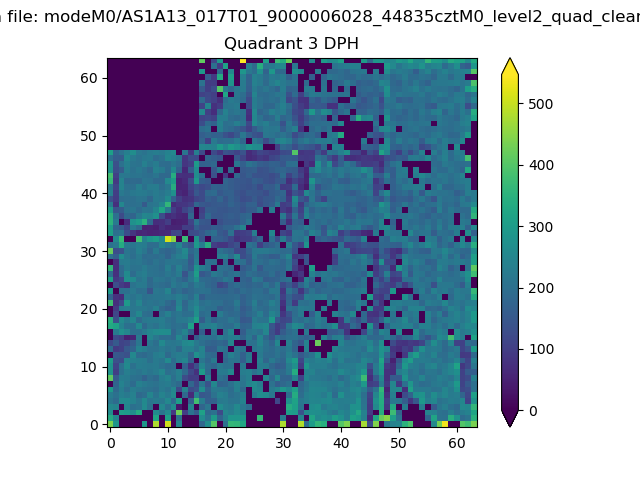 |
 |
Quadrant C |
| Plot type | Count rate plots | Images |
|---|---|---|
| Comparison with Poisson distribution Blue bars denote a histogram of data divided into 1 sec bins. Red curve is a Poisson curve with rate = median count rate of data. |
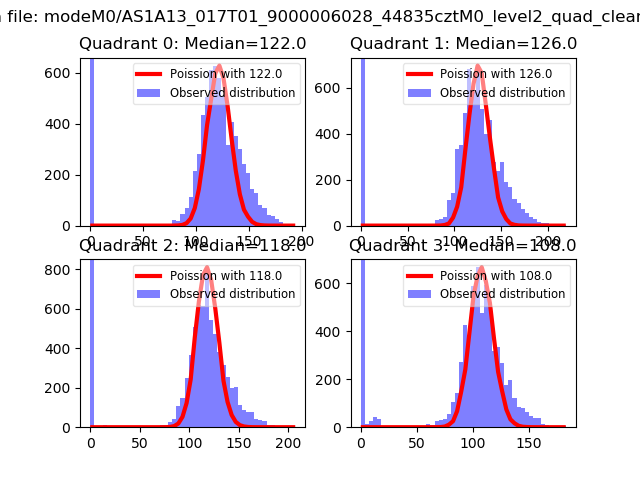 |
 |
| Quadrant-wise count rates Data is divided into 100 sec bins |
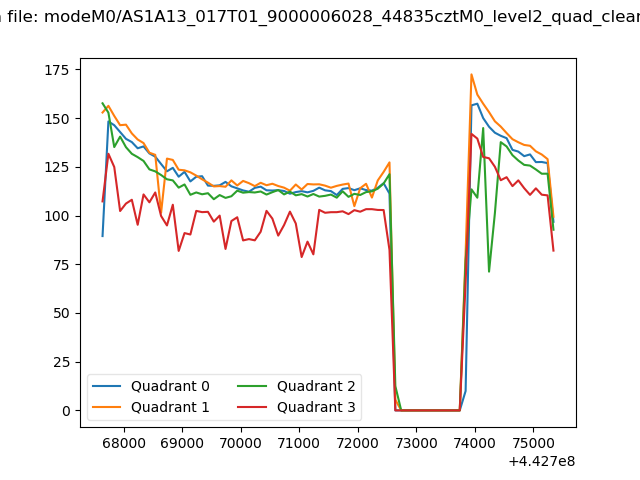 |
|
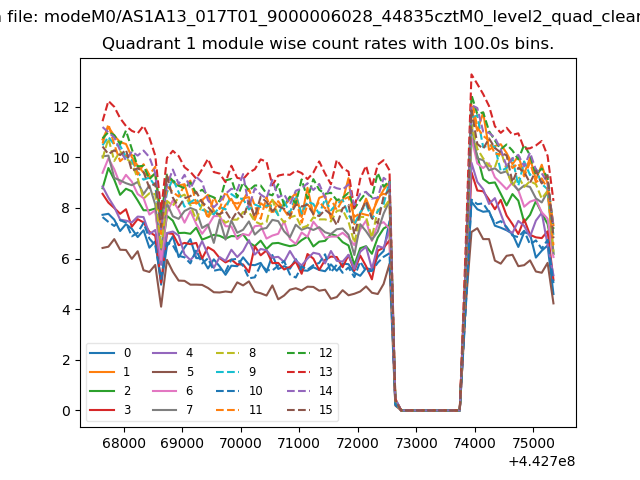
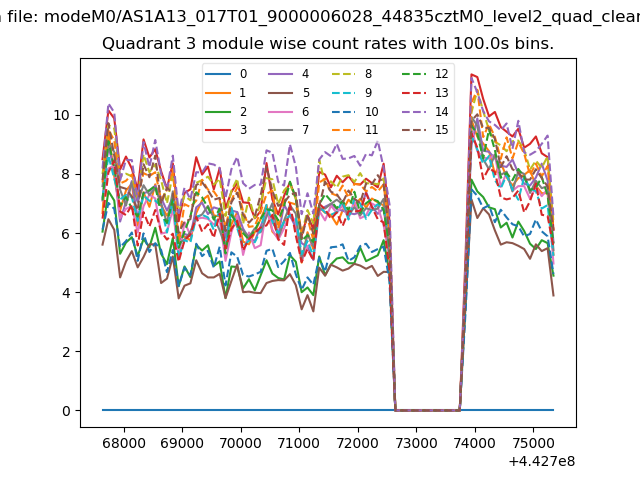
| Module-wise count rates for Quadrant A Data is divided into 100 sec bins |
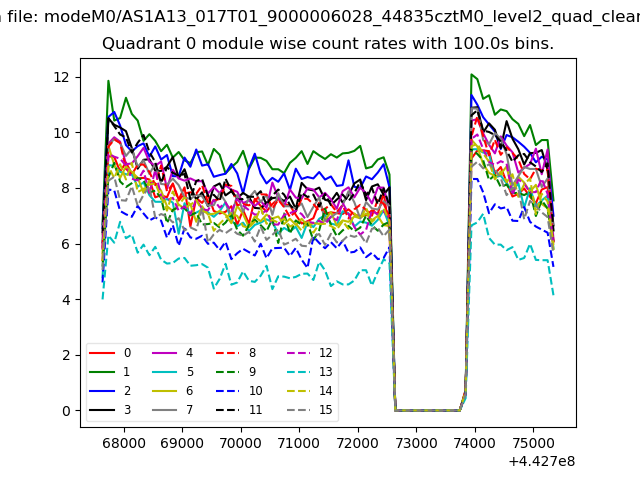 |
 |
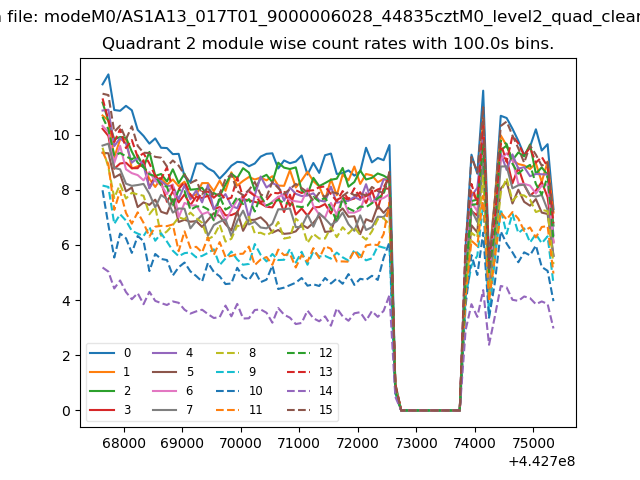
| Module-wise count rates for Quadrant B Data is divided into 100 sec bins |
 |
 |
| Module-wise count rates for Quadrant C Data is divided into 100 sec bins |
 |
 |
| Module-wise count rates for Quadrant D Data is divided into 100 sec bins |
 |
 |
| Parameter | Plot |
|---|---|
| CZT HV Monitor | 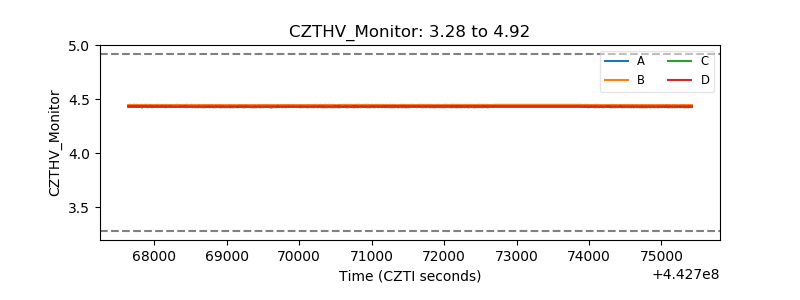 |
| D_VDD | 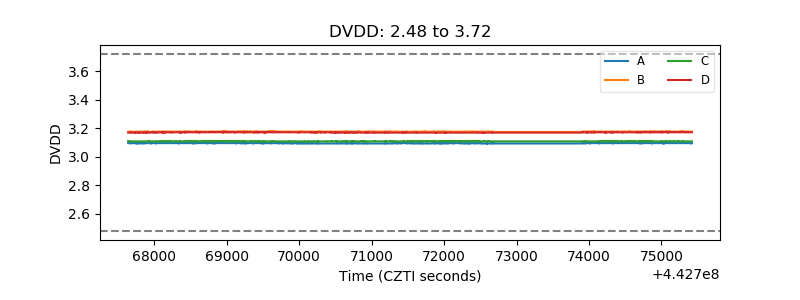 |
| Temperature 1 | 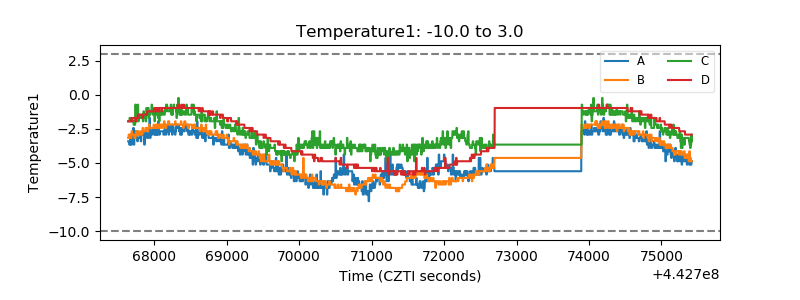 |
| Veto HV Monitor | 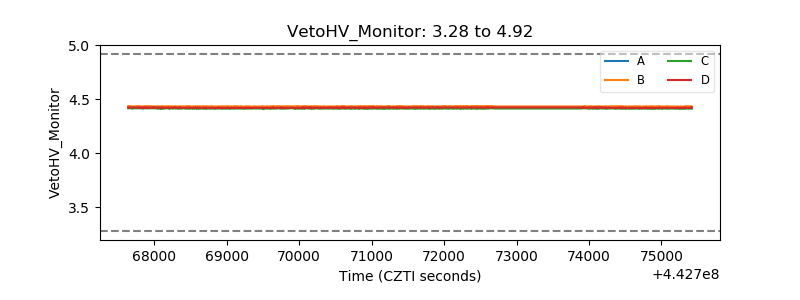 |
| Veto LLD | 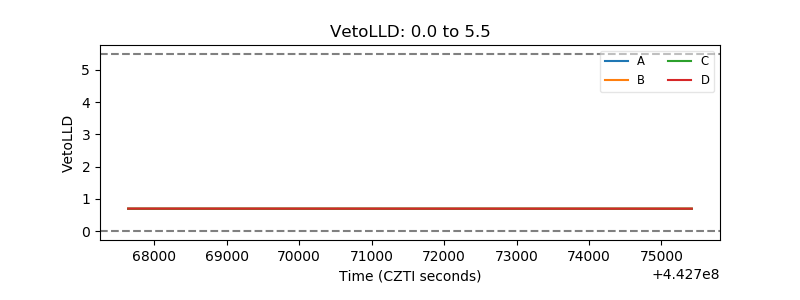 |
| Alpha Counter | 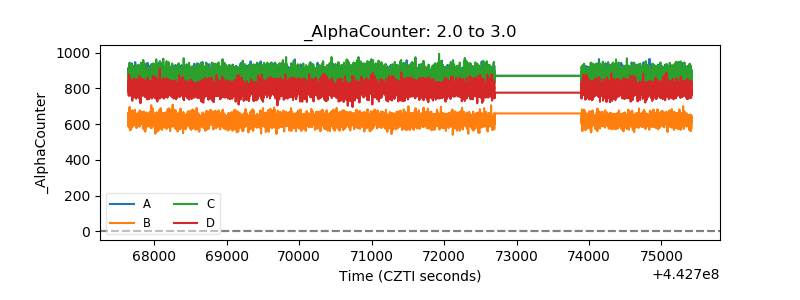 |
| _CPM_Rate | 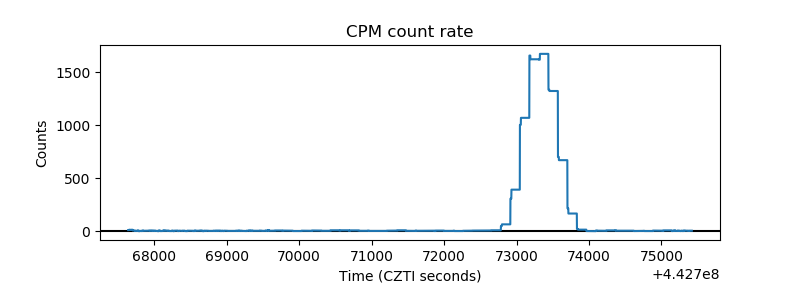 |
| CZT Counter | 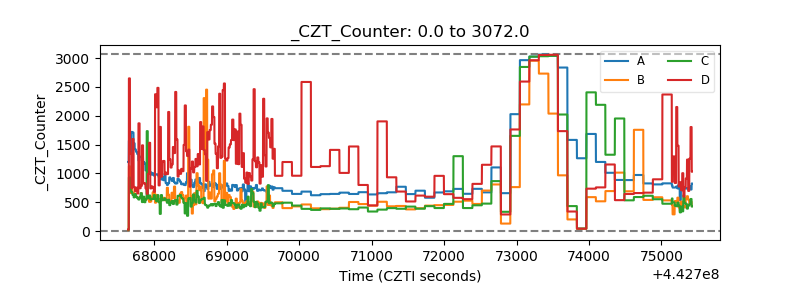 |
| +2.5 Volts monitor | 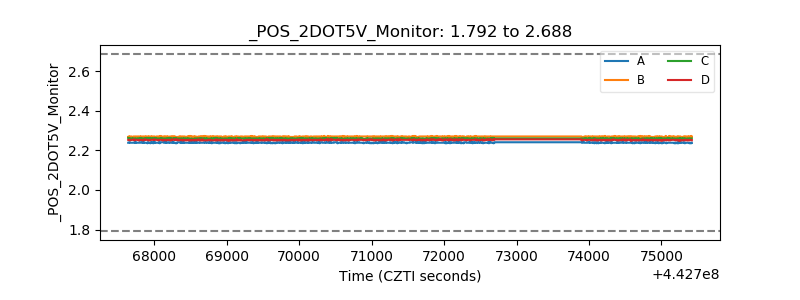 |
| +5 Volts monitor | 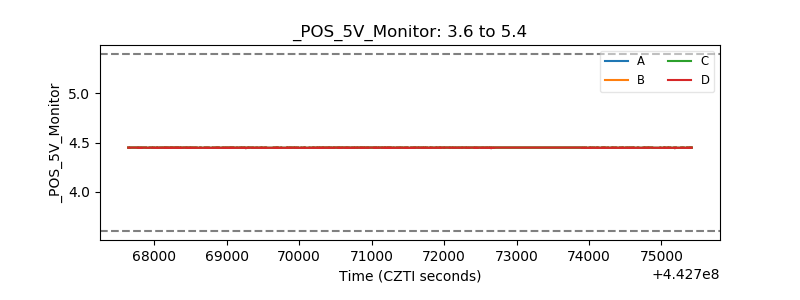 |
| _ROLL_ROT | 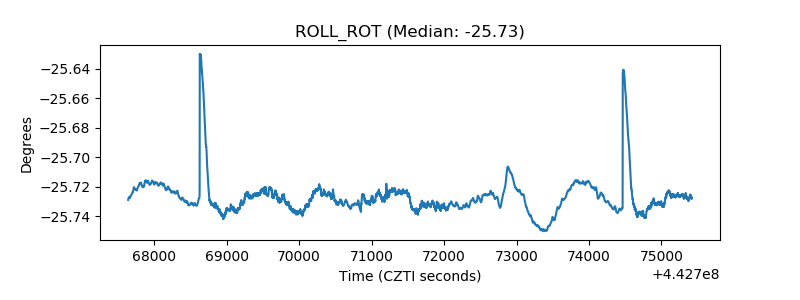 |
| _Roll_DEC | 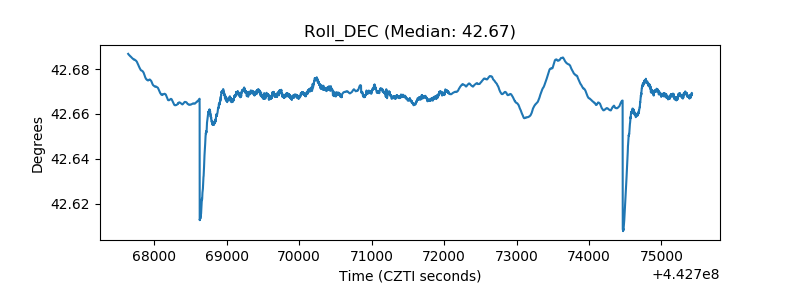 |
| _Roll_RA | 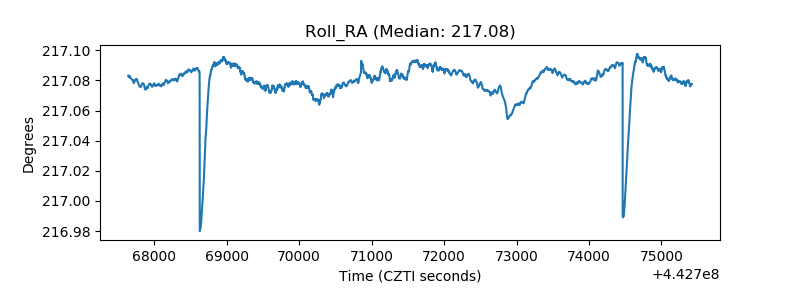 |
| Veto Counter | 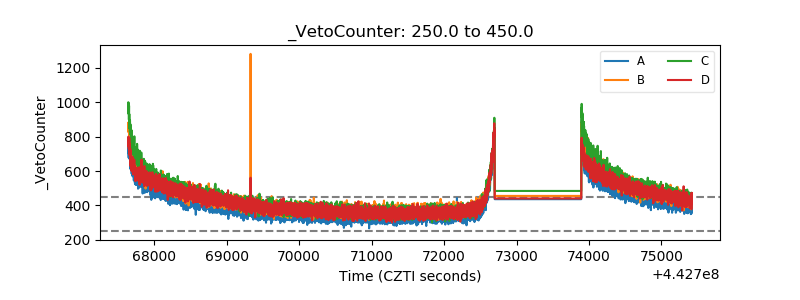 |