| Param | Original file | Final file |
|---|---|---|
| Filename | modeM0/AS1A13_017T01_9000006028_44837cztM0_level2.fits | modeM0/AS1A13_017T01_9000006028_44837cztM0_level2_quad_clean.evt |
| Size (bytes) | 507,061,440 | 103,714,560 |
| Size | 483.6 MB | 98.9 MB |
| Events in quadrant A | 4,639,416 | 709,534 |
| Events in quadrant B | 3,570,533 | 730,483 |
| Events in quadrant C | 2,999,756 | 705,487 |
| Events in quadrant D | 7,095,670 | 576,378 |
| Mode M0 | |||
|---|---|---|---|
| Quadrant | BADHDUFLAG | Total packets | Discarded packets |
| A | 0 | 18737 | 1 |
| B | 0 | 14674 | 1 |
| C | 0 | 12880 | 1 |
| D | 0 | 25289 | 1 |
| Mode SS | |||
|---|---|---|---|
| Quadrant | BADHDUFLAG | Total packets | Discarded packets |
| A | 0 | 122 | 0 |
| B | 0 | 122 | 0 |
| C | 0 | 122 | 0 |
| D | 0 | 122 | 0 |
| Mode M9 | |||
|---|---|---|---|
| Quadrant | BADHDUFLAG | Total packets | Discarded packets |
| A | 0 | 12 | 0 |
| B | 0 | 12 | 0 |
| C | 0 | 12 | 0 |
| D | 0 | 12 | 0 |
| Quadrant | Total seconds | Saturated seconds | Saturation percentage |
|---|---|---|---|
| A | 5991 | 146 | 2.436989% |
| B | 5992 | 169 | 2.820427% |
| C | 5992 | 70 | 1.168224% |
| D | 5992 | 825 | 13.768358% |
Noise dominated data is calculated using 1-second bins in cleaned event files. If a bin has >2000 counts, and if more than 50% of those come from <1% of pixels, then it is considered to be noise-dominated and hence unusable.
| Quadrant | # 1 sec bins | Bins with >0 counts | Bins with >2000 counts | High rate bins dominated by noise | Noise dominated (total time) | Noise dominated (detector-on time) | Marked lightcurve |
|---|---|---|---|---|---|---|---|
| A | 7216 | 5992 | 5 | 5 | 0.07% | 0.08% | 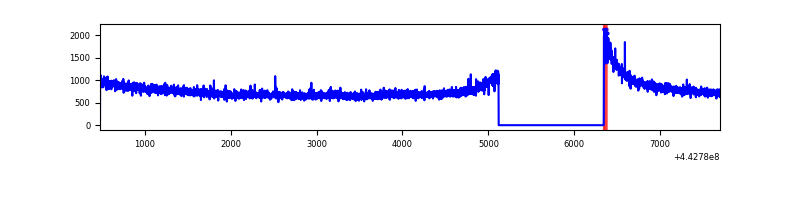 |
| B | 7217 | 5993 | 51 | 51 | 0.71% | 0.85% | 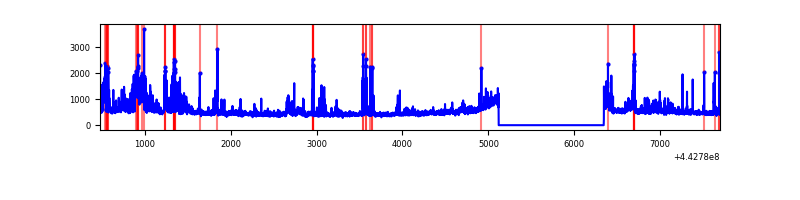 |
| C | 7217 | 5993 | 18 | 18 | 0.25% | 0.30% | 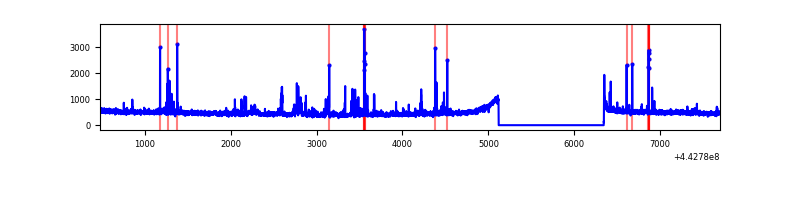 |
| D | 7217 | 5993 | 732 | 732 | 10.14% | 12.21% | 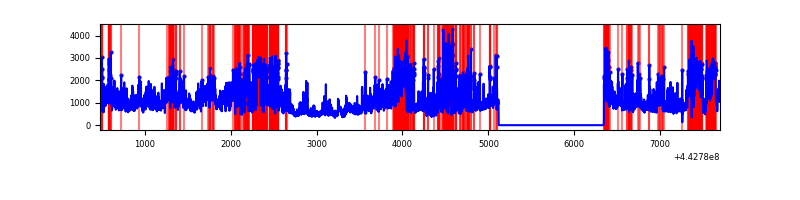 |
Top three noisy pixels from each quadrant. If the there are fewer than three noisy pixels in the level2.evt file, extra rows are filled as -1
| Pixel properties | Quadrant properties | ||||||
|---|---|---|---|---|---|---|---|
| Quadrant | DetID | PixID | Counts | Sigma | Mean | Median | Sigma |
| A | 10 | 83 | 1896289 | 13018.78 | 706 | 691 | 145.6 |
| A | 0 | 243 | 8220 | 51.71 | 706 | 691 | 145.6 |
| A | 13 | 254 | 7872 | 49.32 | 706 | 691 | 145.6 |
| B | 4 | 171 | 380333 | 2770.27 | 705 | 685 | 137.0 |
| B | 5 | 255 | 117923 | 855.48 | 705 | 685 | 137.0 |
| B | 5 | 172 | 55537 | 400.25 | 705 | 685 | 137.0 |
| C | 12 | 2 | 104561 | 633.26 | 701 | 707 | 164.0 |
| C | 14 | 254 | 89004 | 538.4 | 701 | 707 | 164.0 |
| C | 12 | 250 | 31574 | 188.21 | 701 | 707 | 164.0 |
| D | 11 | 241 | 1364239 | 8194.8 | 662 | 639 | 166.4 |
| D | 13 | 187 | 1295909 | 7784.16 | 662 | 639 | 166.4 |
| D | 1 | 52 | 1017433 | 6110.61 | 662 | 639 | 166.4 |
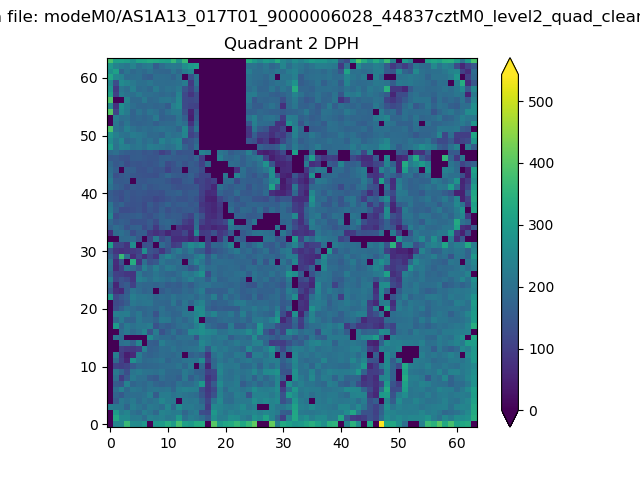
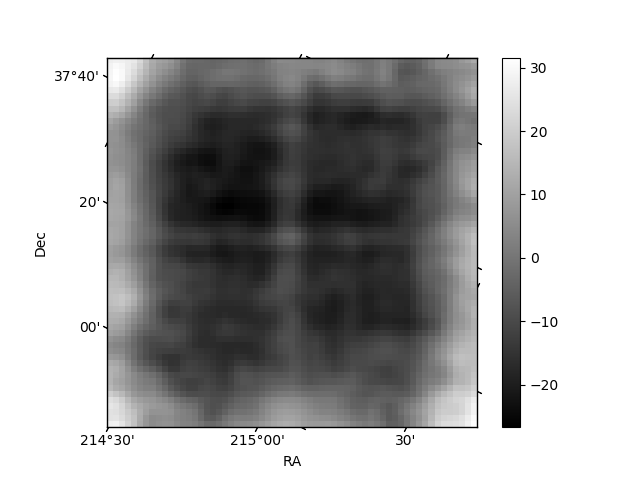
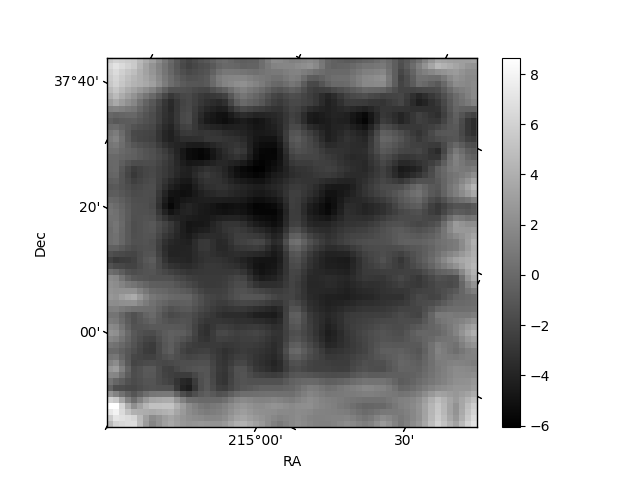
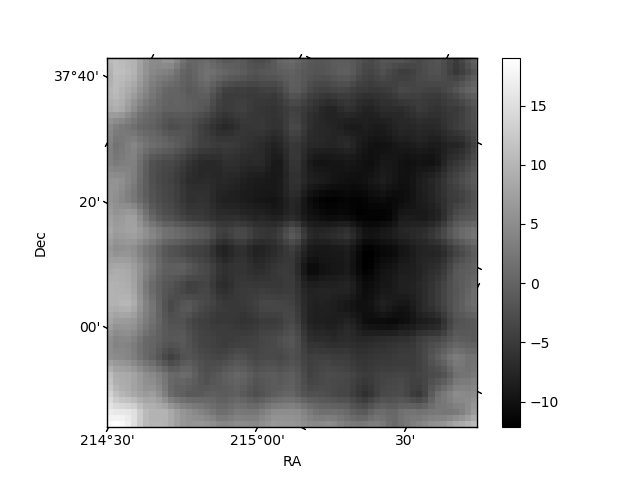
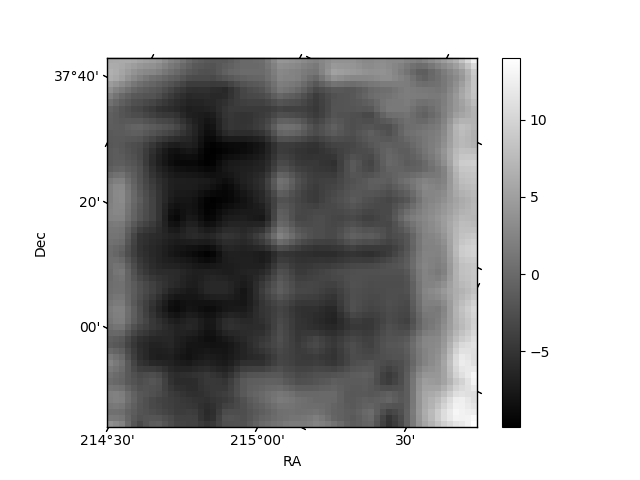
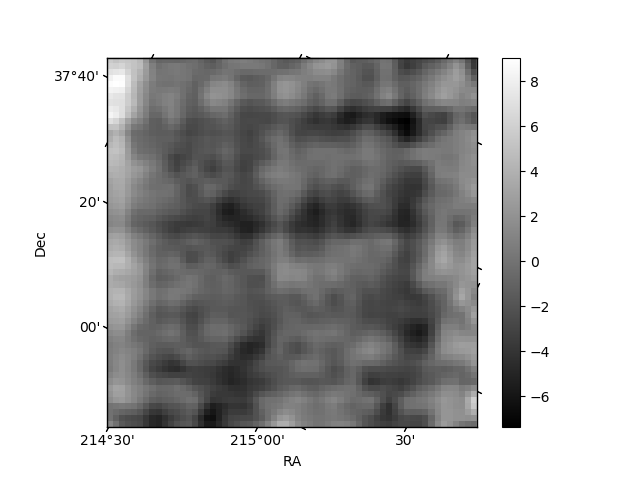
Histogram calculated using DETX and DETY for each event in the final _common_clean file
| Quadrant A | 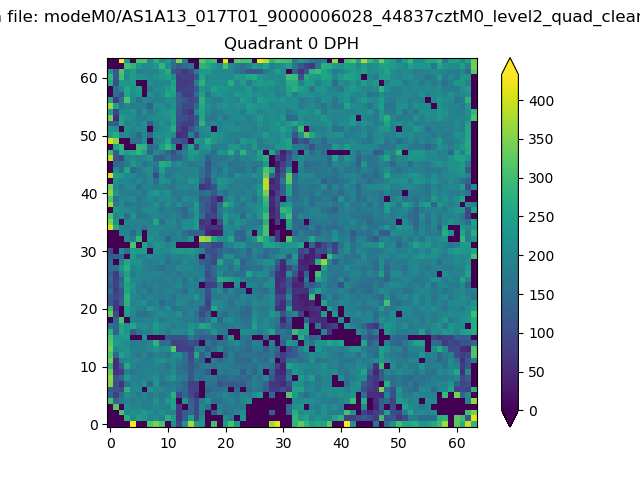 |
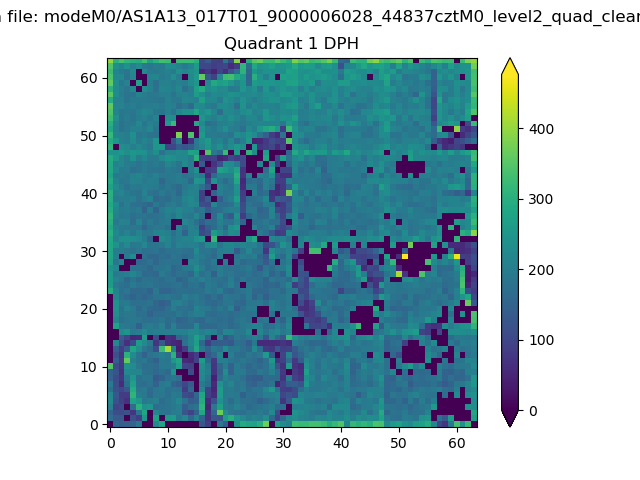 |
Quadrant B |
|---|---|---|---|
| Quadrant D | 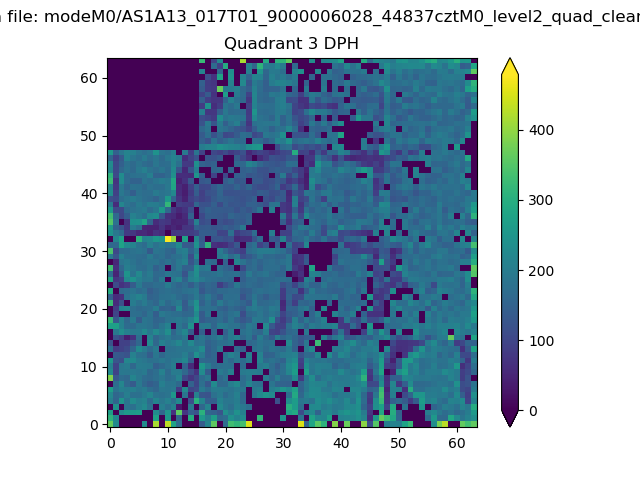 |
 |
Quadrant C |
| Plot type | Count rate plots | Images |
|---|---|---|
| Comparison with Poisson distribution Blue bars denote a histogram of data divided into 1 sec bins. Red curve is a Poisson curve with rate = median count rate of data. |
 |
 |
| Quadrant-wise count rates Data is divided into 100 sec bins |
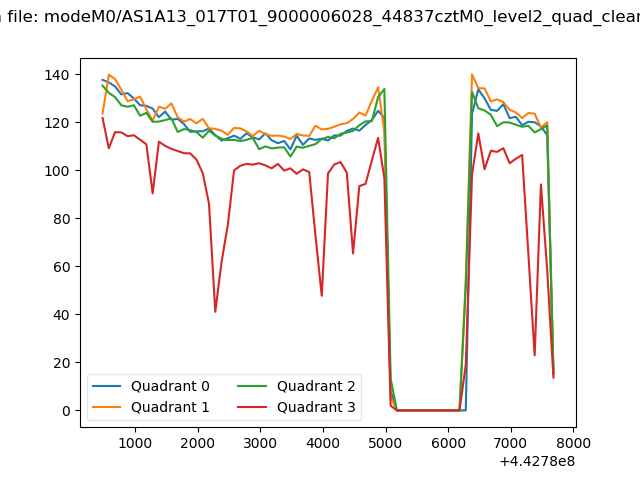 |
|
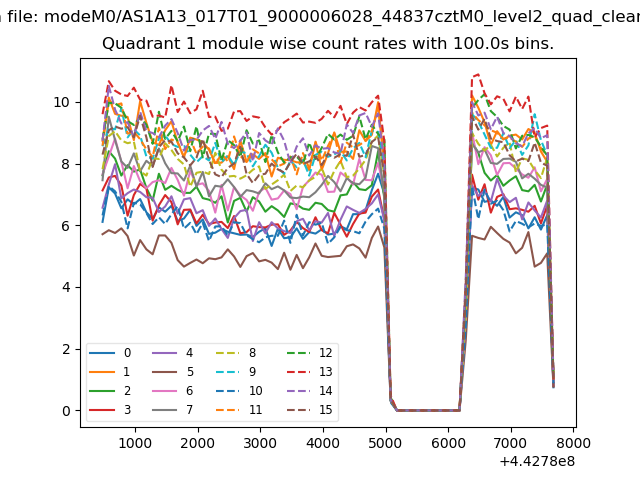
| Module-wise count rates for Quadrant A Data is divided into 100 sec bins |
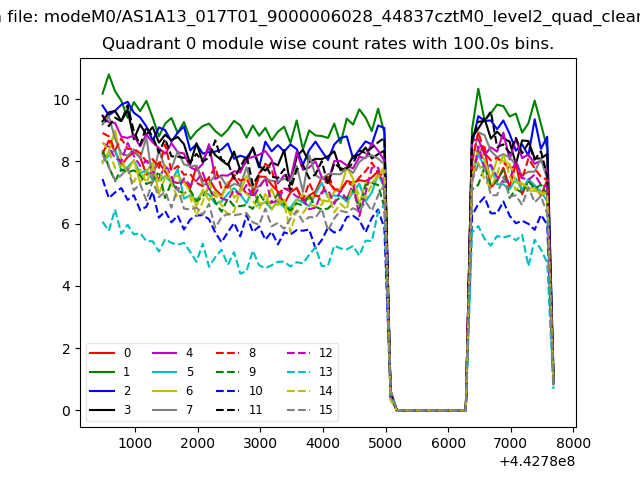 |
 |
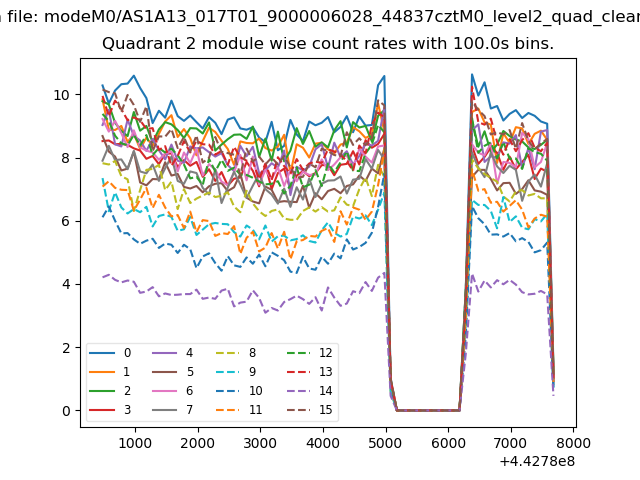
| Module-wise count rates for Quadrant B Data is divided into 100 sec bins |
 |
 |
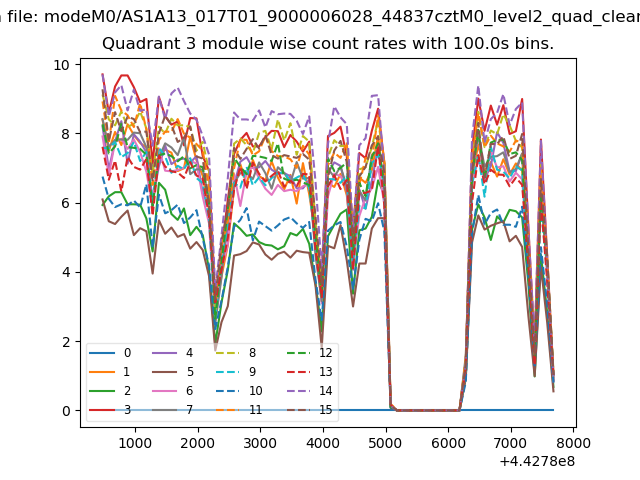
| Module-wise count rates for Quadrant C Data is divided into 100 sec bins |
 |
 |
| Module-wise count rates for Quadrant D Data is divided into 100 sec bins |
 |
 |
| Parameter | Plot |
|---|---|
| CZT HV Monitor | 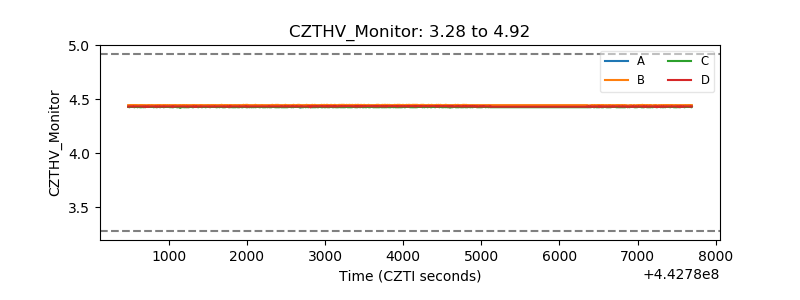 |
| D_VDD | 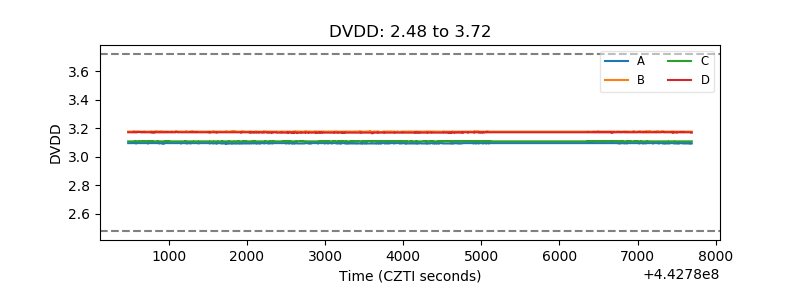 |
| Temperature 1 | 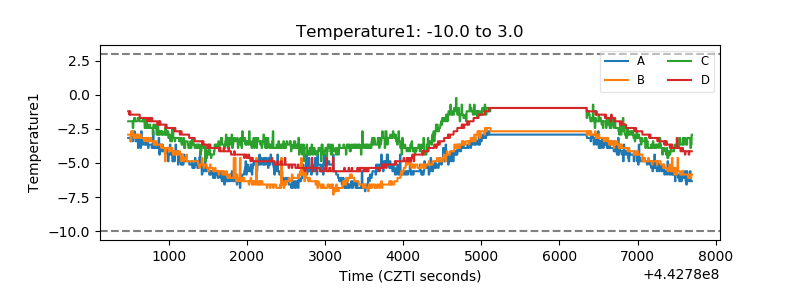 |
| Veto HV Monitor | 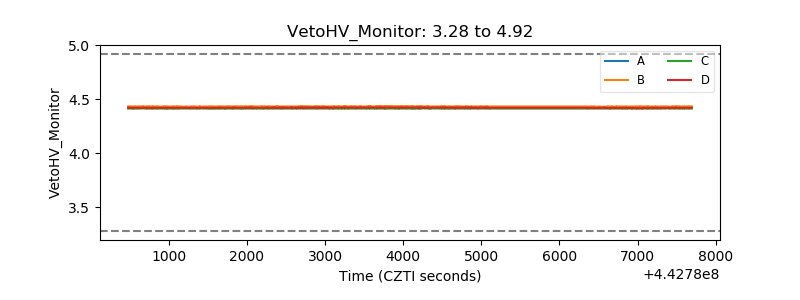 |
| Veto LLD | 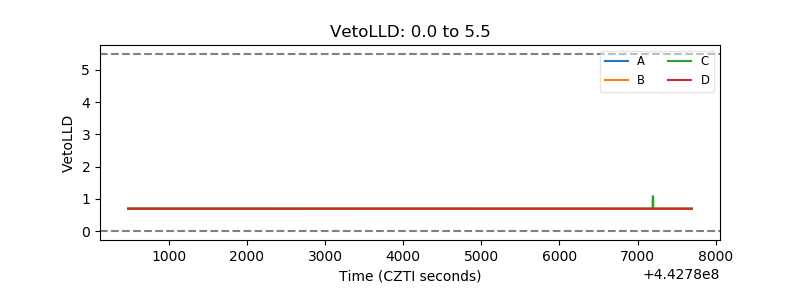 |
| Alpha Counter |  |
| _CPM_Rate | 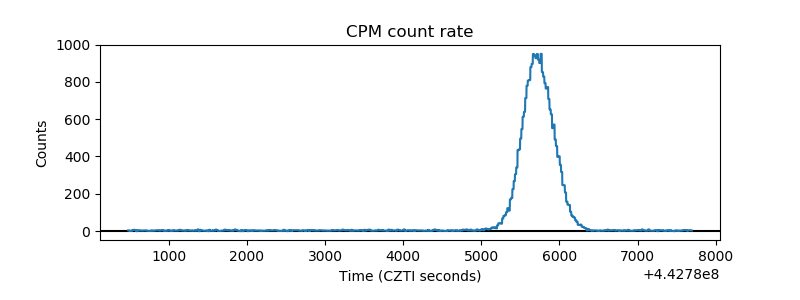 |
| CZT Counter | 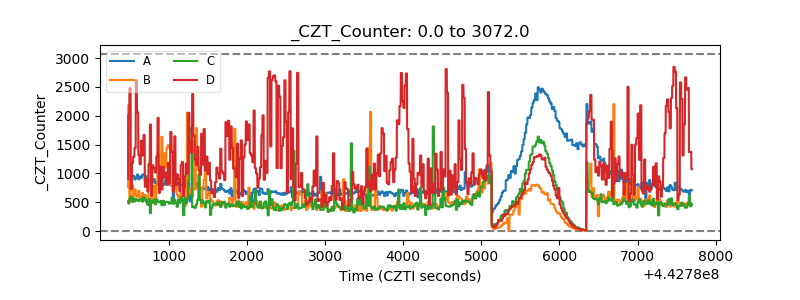 |
| +2.5 Volts monitor | 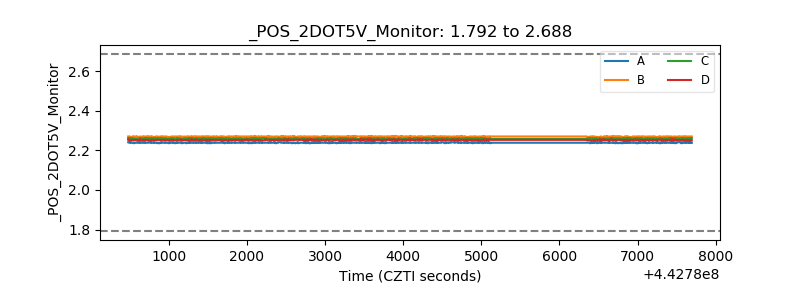 |
| +5 Volts monitor |  |
| _ROLL_ROT | 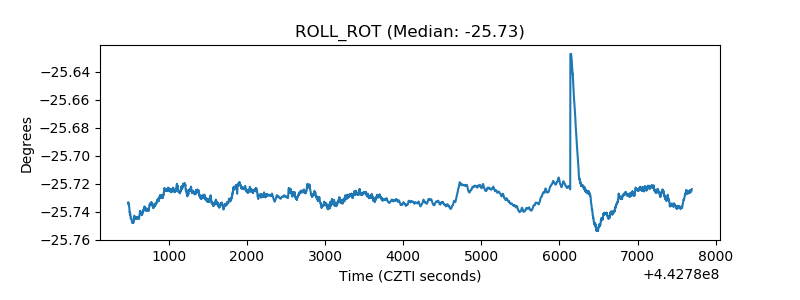 |
| _Roll_DEC | 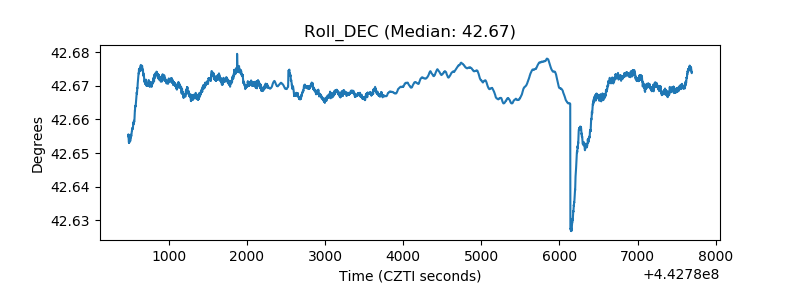 |
| _Roll_RA | 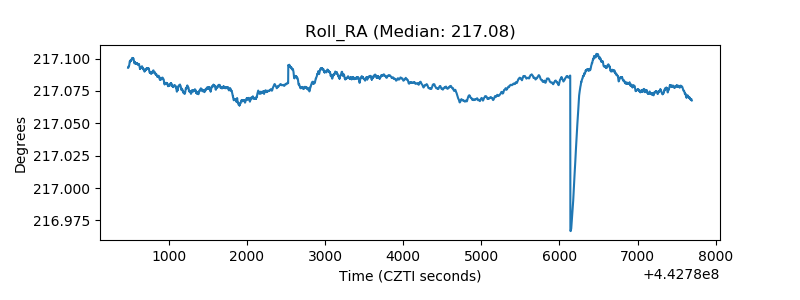 |
| Veto Counter | 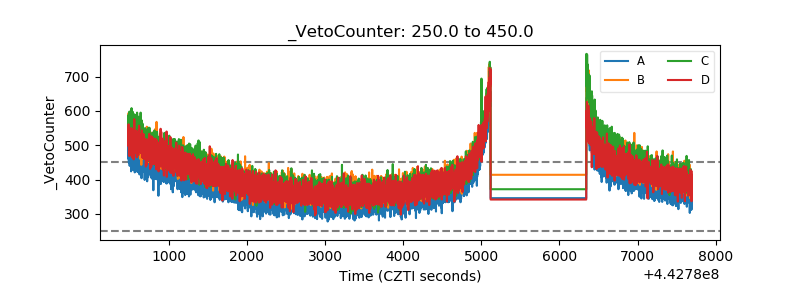 |